e-ISSN: 2278-067X, p-ISSN: 2278-800X, www.ijerd.com
Volume 14, Issue 3 (March Ver. I 2018), PP.09-16
Pre-Factor (A) and N-Factor of (Bi
0.5Na
0.5)
0.92Ba
0.08Zr
0.04Ti
0.96O
3Ferroelectric Ceramic
B. Tilak
Department of Physics, Dr. A. P. J. Abdul Kalam-IIIT Ognole (IIIT Ongole), RGUKT-AP, RK Valley Idupulapaya, Vempalli(M), Kadapa(D) Andhra Pradesh-516330, India
Corresponding Author: B. Tilak
ABSTRACT:-Barium (Ba2+) doped in A-site and Zirconium (Zr4+) doped in B-site of NBT,
(Bi0.5Na0.5)0.92Ba0.08Zr0.04Ti0.96O3 polycrystalline material was prepared by Solid State Reaction method. Frequency dependence of dielectric constant and Electric Modulus were discussed at various temperatures in frequency range (101-106Hz). A relaxation phenomena was observed in the material. The present dielectric material obeys Jonsher’s law. The coefficient’s of Jonsher’s law A(T) and n(T) was interpreted by curve fitting method. Electrical Modulus reveals a long-range mobility of charge carriers at high frequencies at various temperatures.
KEYWORDS :(Bi0.5Na0.5)0.92Ba0.08Zr0.04Ti0.96O3, Jonscher’s Law, Relaxation Phenomenon, Dielectric, Electric Modulus,
--- --- Date of Submission: 19 -02-2018 Date of acceptance: 06-03 2018 ---
---I.
INTRODUCTIONThe ferroelectric relaxor materials are technically important because it displays the wide variety of phenomena. These compounds have diffuse phase transition of perovskite structure as well as those of tetragonal tungsten bronze. A considerable attraction has been made to perovskite structure based materials due to rich diversity of their physical properties and possible applications in various technologies like memory storage devices, micro electromechanical systems, multilayer ceramic capacitors, and recently in the area of Opto-electronic devices [1]. These useful properties have most often been observed in lead-based perovskite compounds, such as PMN–PT, PNN–PZT, PLZT, etc [2-3].The properties of these lead based compounds are attributed to their relaxor behaviour, However these compositions have high volatility and high toxicity in nature, which is not good for mankind. These reasons made researcher’s to think about lead free materials which are environmental friendly have properties whose structure is perovskite and relaxor behaviour in lead free materials. Many lead-free materials with perovskite structure such as BaTiO3 (BT), (Bi1/2Na1/2) TiO3 (BNT), (Bi1/2K1/2)TiO3 (BKT) and KNbO3 (KN) was investigated [4-15] in terms dielectric relaxation, ferroelectric phase transition and electrical properties. Basically, the lead free system are (i) Perovskite, i.e., BNT , BaTiO3(BT), KNbO3,NaTaO3,etc. (ii) Non –Perovskite i.e., Bismuth layer structures ferroelectric (BSLF) tungsten bronze type ferroelectric etc, while the perovskite are suitable for acceleration and high power applications, BLSF seems to be a good candidate for ceramic filters and resonator applications. Apart from polycrystalline lead-free materials, lead-free piezoelectric single crystals, Example: ferroelectric ceramics with tungsten bronze family studies have been reported. The Perovskite type ferroelectric are hopeful candidates for lead free piezoelectric ceramics because of its anisotropy in piezoelectric properties are large compared to other ferroelectric ceramics [16]. (Na1/2Bi1/2)TiO3 (NBT) modified at A- and B-sites with barium at A-site and Zirconium at B-site, i.e., (Bi0.5Na0.5)0.92Ba0.08Zr0.04Ti0.96O3 (8BNBZT), which is just above the MPB region and it is one of the promising candidates for high frequency device applications. It is known from the literature survey, that the existence of electrical conductivity in ferroelectric materials is an undesirable feature, as the dielectric constant measurements do not reflect the real contribution from the lattice, when space charge polarization, triggered by conductivity mechanism, is prevalent. The interest is to visualize how ferroelectric material (Bi0.5Na0.5)0.92Ba0.08Zr0.04Ti0.96O3 (8BNBZT) behaves under the influence of its conductivity, with regard to its dielectric characteristics. In this paper, we report the dielectric constant measurements carried out on (Bi0.5Na0.5)0.92Ba0.08Zr0.04Ti0.96O3 (8BNBZT) ferroelectric ceramic, as a function of frequency (10
1
0.5 0.50.92 0.08 0.04 0.96 3
II.
EXPERIMENTALA. Preparation of Materials:
Polycrystalline (Bi0.5Na0.5)0.92Ba0.08Zr0.04Ti0.96O3 (8BNBZT) ceramic was prepared by standard high-temperature solid-state reaction technique using AR grade (Purity more than 99.5%, Hi- Media) oxides and /or carbonates: Bi2O3, Na2CO3 BaCO3, ZrO2 and TiO2 in a suitable stoichiometry. Initially, all raw materials were grounded. A single phase homogenous powder was formed after grinding. This grounded powder were calcined at 8500C for 3 hrs, further poly vinyl alcohol PVA was added as binder to reduce the brittleness of the pellet. Pellet was having dimensions of 10mm in diameter and 1-2 thickness was sintered at 11800C for 3hrs. Silver paste was induced on the both sides of pellet as electrode for electrical measurements. The measurement of dielectric constant (ε1), dielectric loss (ε11), and Electrical Modulus (M) as a function of frequency range(101 -106Hz) at various temperatures using HIOKI LCR HI-tester , Japan with heating rate of 50C/ min off set temperature 0.20C and time period of 1 Minute for making the above measurements.
III.
RESULTS AND DISCUSSIONDielectric constant is closely associated with polarization in dielectric materials. Polarization is some ordering in space of the electrically charged particles with their displacement under the influence of an external electric field. This causes the formation of an electric moment in the entire volume of the dielectric and also in separate polarization particle (atom, ion and molecule). Structure and temperature dependent dielectric constant related studies of 0.08BNBZT has been reported [17]
102 103 104 105 106 101
102 103 104
4900C 5200C 5500C 5800C 3200C
3500C 4000C 4300C 4600C
(Na0.5Bi0.5)0.92Ba0.08 Zr0.04Ti0.96O3
Real
Diele
ctric
con
stant
(
1 )
Frequency(Hz)
Figure 1(a): Frequency dependence of ε 1 for (Bi0.5Na0.5)0.92Ba0.08Zr0.04Ti0.96O3 ceramic at different temperatures(3000C-6000C)
102 103 104 105 106 107 101
102 103 104 105
4900C 5200C 5500C 5800C 3200C
3500C 4000C 4300C 4600C
(Na0.5Bi0.5)0.92Ba0.08 Zr0.04Ti0.96O3
Imagin
ar
y
Diele
ctric
con
stant
(
11
)
Frequency(Hz)
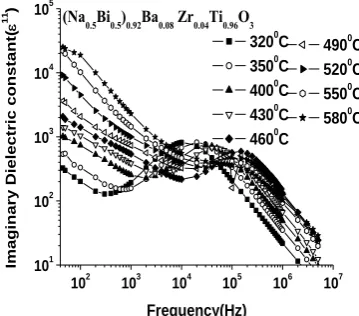
Figure 1(b): Frequency dependence of ε 11 for (Bi0.5Na0.5)0.92Ba0.08Zr0.04Ti0.96O3 ceramic at different temperatures (3000C-6000C)
The real part of the dielectric constant ε 1, is related to the capacitive nature of the material and a measure of the reversible energy stored in the material by polarization. whereas ε 11 is a measure of the energy required for molecular motion, i.e., energy dissipated in the presence of an electric field. It is divided into relaxation and conductivity contribution required to align dipoles and to move ions [14, 15].
In the present dielectric material, the value of ε 1 decreases with the increase of both frequency and temperature, the rate of the decrease in ε 1 by rising temperature is faster at lower and intermediate frequencies. In Mega Hz region the temperature enhances the dielectric constant by a very small rate. The decrease of ε 1 with the increase of frequency can be explained as follows; in carrier- dominated dielectric materials, the value of ε 1 is high at low frequencies and dispersion due to space-charge polarization.
ε 11(ω), was measured as a function of frequency at various temperatures. The origins of the dielectric losses are the conduction losses, dipole losses and vibrational losses [18]. As the temperature increases, σ (ac) increases. The loss of conduction usually increases with the increment in the DC conductivity towards high temperatures. The dielectric loss increases with frequency and decreases with increasing temperature. A flat curve region type determines the losses can be explained by the electron hopping model which considers the frequency dependence of the localized charge carriers hopping in random array of centre. This model is applicable for materials in which the polarization responds effectively or sufficiently rapidly to the appearance of an electron on any one site. This transaction may be said to occur effectively into the final state.
It also observed that at around 300oC (Ferroelectric phase), electric polarization and the dielectric losses are practically frequency independent and ε 1 is of one order of magnitude higher than ε 11. In the paraelectric phase, weak relaxational process is visible and strongly covered the losses of conductivity at low frequencies. This process has maximum between in 103Hz to 104Hz. It is observed that the values of (ε 1) and (ε 11) in paraelectric phase are almost identical within about 2 decades of frequency. This process may be a classical dispersion character diffused, involve a wide distribution of relaxational time. It originates probably from the thermally driven process of ferroelectric domains destruction initiated on the surface of nano-grains. It has been observed that both (ε 1) and (ε 11) show strong dispersion at low frequencies. Such strong dispersion in both the components of the complex dielectric constant appears to be a common feature in ferroelectrics associated with good ionic conductivity and is referred to as low frequency dielectric dispersion (LFDD) [19-22]. This is incomplete contrast with the effect due to d.c conductivity [19], where the real part remains constant while the imaginary part is exactly proportional to (1/ ω). Jonscher’s [8], Hill and Pick up [23] have dealt with LFDD phenomenon in detail.
The dispersion in the imaginary part of the dielectric constant (ε 11) is stronger than that in the real part (ε 1). This is because of the influence of the dc conductivity on (ε 11). The low frequency slope, (ε 11 vs F), if the curve is close to -1 indicating the predominance of the dc conduction in this frequency region which overshadows the true behaviour of ε 11.
3.1 Dielectric dispersion relations and interpretation of the experimental results:
According to Jonscher’s universal law, the complex dielectric constant as a function of radian frequency ω, is given by the following relation Eq (1) (taking into account the true conductivity contribution)
* 1 11 ( ) 1
0
( )
(
n T)
A T
i
i
i
(1)Where ε ∞ is the ‘high frequency’ value of the dielectric constant, n(T) is the temperature dependent exponent, which determines the strength of the ion-ion coupling (small values of n(T) corresponding to strongly interacting systems) and a(T) determines the ‘strength’ of the polarizability arising from universal mechanism in equations Thus
1 ( ) 1
0
( )
sin( ( ) / 2)(
n T
n T)
A T
(2)11 ( ) 1
0 0
( )
cos( ( ) / 2)(
n T
n T)
A T
(3)Where the first term in Eq (2) characterizes the lattice response and that in Eq (3) reflects the dc conduction part, while the second term in the both the equation refers to the charge carrier contribution to the observed dielectric constants.
The Frequency dependencies of the dielectric constant (Figure 1(a) and 1(b) can be explained using
Eq(2). At low frequencies the charge carrier term ( ) 1
0
( )
sin( ( ) / 2)(
n T
n T)
A T
0.5 0.50.92 0.08 0.04 0.96 3
is negligible, therefore for a constant n, Eq(2) gives the straight line with a slope equal to n-1 in the logarithmic plot of ε1 and frequency. Therefore, this strong low frequency dependence dielectric constant at elevated temperatures can be related to the contribution of the ionic space charge such as oxygen ion vacancies, defects, interface polarization located at grain boundary. At high frequencies the charge carriers fail to respond to the external field, therefore the measured dielectric constant is mainly from the intrinsic polarization. This explains the existence of a linear decrease in low frequency region and a frequency independent plateau region at high frequency (Figure 1(a)). As A(T) increases with increasing temperature, the charge carrier term becomes more and more prominent at high temperatures, thereby increasing the low frequency dielectric dispersion. An anomalously strong dispersion of ε 1 near Tc suggests the prevalence of a coupling between the charge carriers and lattice [8]. The behaviour of ε 11 could be explained by Eq (3). At lower frequencies and high temperatures, the dc conductivity term dominates and gives a slope of -1, which indeed is consistent with the data shown in Figure. 1(b).
3.2 Quantitative Calculations:
The verification of the Jonscher’s model is done successful fitting of the experimental dielectric data to the dielectric dispersion relation given in Eq (2) and Eq (3). The present treatment helps in separating the intrinsic dielectric constant from the one which is due to charge carrier contribution.
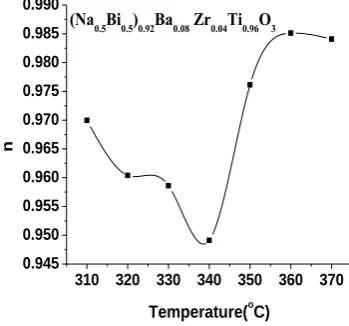
The Exponent n(T) and the coefficient A(T) values were determined from the curve fitting method. The temperature dependence of n(T) and A(T) are shown in Figure. 2 and Figure. 3.
The ‘exponent-n (T)’ describes the interaction between the charge carriers that are participating in the polarization [22]. In Debye case, n=1 at low frequency. In non-Debye type, if n ≤ 1, the motion involved is a translation motion with a sudden hopping, n≥1 indicates a localized hopping.
310 320 330 340 350 360 370 0.945
0.950 0.955 0.960 0.965 0.970 0.975 0.980 0.985 0.990
(Na0.5Bi0.5)0.92Ba0.08 Zr0.04Ti0.96O3
n
Temperature(oC)
Figure.2: Temperature Dependence of exponent-n (T)
310 320 330 340 350 360 370 1.0x10⁻¹⁵
1.5x10⁻¹⁵ 2.0x10⁻¹⁵ 2.5x10⁻¹⁵ 3.0x10⁻¹⁵ 3.5x10⁻¹⁵ 4.0x10⁻¹⁵ 4.5x10⁻¹⁵ 5.0x10⁻¹⁵
5.5x10⁻¹⁵ (Na0.5Bi0.5)0.92Ba0.08 Zr0.04Ti0.96O3
Lo
g A
Temperature(oC)
Figure.3: Temperature Dependence of Pre-factor A(T)
For 0<n<1, the universal capacitance term, B(iω)n-1, is composed of two parts. The imaginary one is attributed to the conductivity and therefore represents the loss of energy, and the real part i.e; the real capacitance represents the stored energy [24, 8].
Energy lost / Energy stored = cot(nח/2)
This implies a low energy loss for a high value of n and a high loss for a small value of n. It is observed from Figure 2that n value decreases with increasing temperature and observed to be minima at Tc and then increases slowly with further increase in temperature in the studied material.
According to lattice dynamics theory [25], the charge carriers become very mobile and the ac conductivity is enhanced, which implies that the energy loss is high and the energy stored is small. According to Dissado and Hill, the exponent characterizes the magnitude of the correlation in a single dipole [13, 26]. A value of unity corresponds to a fully correlated transition and a value of zero or near to zero to a fully uncorrelated transition. Here it is evident that, the exponent ‘n’ tends to be minimum at Tc suggests a strongly uncorrelated reorientation of the charge carrier polarization at Tc in the materials.
From Figure 3, it is observed that the pre-factor A(T) found to increase as temperature increases upto transition temperature Tc at 1kHz with a subsequent decrease with increase in temperature. Temperature dependent A(T), determines the strength of the polarizability (non-ideal conductivity) arising from the diffusive motion of charge carriers which showed an anomaly corresponding to Tc. The higher value of ‘A’ at Tc indicates a longer time to relax. The increase in A(T) with temperature is correlated to a corresponding thermal activation of the process of scattering [27]. The obtained values of A(T) are found to be enhanced
with temperature, because of enhancement of the scattering process by temperature. It was argued that there may be exist of certain correlation between the dc conductivity and the non- ideal conductivity if both are due to the same charge transport.
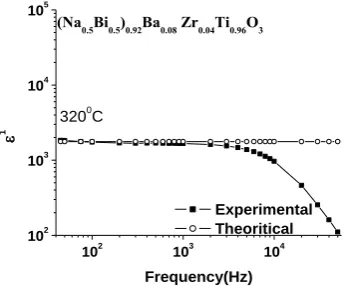
The experimental data points from the ε 1 measurement, at high temperatures (i.e., 3200C), are fit to the theoretical Eqs (2) and (3) with an average relative error not more than 5%. The excellent fitting obtained for the experimental data, for ε 1 at temperature below Tc as shown in Figure 4.
102 103 104
102 103 104 105
3200C
(Na0.5Bi0.5)0.92Ba0.08 Zr0.04Ti0.96O3
1
Frequency(Hz) Experimental Theoritical
Figure.4: Experimental and Theoretical Curve fitting for Dielectric constant
IV.
Electrical ModulusComplex modulus analysis is an alternative approach to explore electrical properties of the material and to magnify any other effects present in the sample It is an important and convenient tool to determine, analyse and interpret the dynamical aspects of electrical transport phenomena (i.e. parameters such as carrier/ion hopping rate, conductivity relaxation time, etc.). In order to analyse and interpret the experimental data, it is essential to have a model equivalent circuit that provides a realistic representation of the electrical properties.
0.5 0.50.92 0.08 0.04 0.96 3
2 3 4 5 6 7
10-6
10-5
10-4
10-3
10-2
5300C 5400C 5600C 5800C 4300
C 4600
C 4800
C 5200
C
(Na
0.5Bi0.5)0.92Ba0.08 Zr0.04Ti0.96O3
M
1
log F
Figure. 5 : Frequency dependency of Real part (M1) of Electrical Modulus
M1 shows a dispersion tending towards M∞ ( the asymptotic value of M1 at higher frequencies). M1 is to found to be very low at lower frequencies and exhibit an increasing trend with increase in frequency. It resembles continuous dispersion on increasing frequency which may be due to short range mobility of charge carriers under the action of an induced electric field. As it is observed that at higher temperature, M1 increases rapidly with the increase in frequency as well as temperature which attributes temperature dependent relaxation process in the material. Also it is observed that the dispersion region shifts towards higher frequencies suggesting long-range mobility of charge carriers. The observed plateau region or its tendency indicates about frequency invariant dc behaviour of the material.
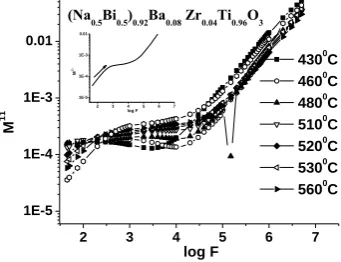
From Figure 6, show the frequency dependence of imaginary part of electrical modulus at different temperatures in 8BNBZT. Asymmetric peak at low frequency reveals that ions can move over a long distance, whereas ions confines in potential shell at high temperature. It is observed that the magnitude of M11 at high frequency region increase with increase in temperature.
2 3 4 5 6 7
1E-5 1E-4 1E-3 0.01
2 3 4 5 6 7
1E-5 1E-4 1E-3 0.01
M
11
log F
4300C 4600C 4800C 5100C 5200C 5300C 5600C
(Na0.5Bi0.5)0.92Ba0.08 Zr0.04Ti0.96O3
M
11
log F
Figure.6 Frequency dependency of Imaginary part (M11) of Electrical Modulus
The appearance of M11 peaks at a characteristic frequency (ωmax) is dependent on temperature resembles an electrical relaxation phenomenon in the studied material. These peaks appear to be shifting towards higher frequency side with rise in temperature, possibly due to decreasing relaxation time in the material. All the curves at different temperatures in the higher frequency regime appear to be merged with one another. Merging of all M11 vs log F curves at high frequencies indicates disappearance of space charge polarization. It is also observed that the width of peaks increases with decrease of temperature. This type of temperature and frequency dependence of M11 arises due to the distribution of relaxation times in the material because of cationic disorder at both A-and B-sites in 8BNBZT.
It is well know that thermal fluctuations are dominant over the dipolar/polar cluster interaction at temperatures of several orders of magnitude greater than Tc. At such very high temperatures the interaction among the dipoles /polar clusters can be treated a negligible and hence, the temperature dependence of angular frequency can be well described by Arrhenius relation.
1.30 1.32 1.34 1.36 1.38 1.40 1.42 1.44 0.0
4.0x10³ 8.0x10³ 1.2x10⁴ 1.6x10⁴
2.0x10⁴ (Na0.5Bi0.5)0.92Ba0.08 Zr0.04Ti0.96O3
Rela
xa
tio
n
al
an
g
u
lar freq
u
en
cy
,
p
Hz
1000/T(K-1)
Figure.7: Relaxation angular frequency(ωp)Hz as a function of 1/T(K-1)
Form the Figure 7, the slopes of relaxation angular frequency, (ωp as a function of 1/T) the activation energy is 0.89 eV for 0.08BNBZT.The activation energy estimated from M11 peak frequencies suggest the involvement of relaxation process by mobile charge carriers and their hopping through oxygen vacancies at high temperatures region in the studied material [28, 29, 30]
V.
CONCLUSIONSFrequency dependent dielectric behaviour of 8 BNBZT ferroelectric ceramic has been studied from 3000C-5800Cin the frequency range of 101Hz-106Hz. A strong low frequency dielectric dispersion (LFDD) has been observed. The parameters Pre-factor A(T) and Exponent, n(T) are determined by fitting the experimentally obtained dielectric data into Jonscher’s universal dielectric dispersion relation. The occurrence of an anomaly in both these parameters near Tc, indicates a coupling between the charge carriers and the phonons. This material may be suitable for capacitive applications. The estimated characteristic relaxation time from the M11 peak frequency represent the time scale of transition from long range mobility of charge carriers and it is clearly a thermally activated process.
REFERENCES
[1]. J. Kuwata, K. Uchino, and S. Nomura, ‘Dielectric and piezoelectric properties of 0.91Pb(Zn1/3Nb2/3)O3-0.09PbTiO3 single crystals’,
Jpn. J. App.Phy, v21 part 1, (1982) p 1298
[2]. S. Park and T. R. Shrout, ‘Ultra strain and piezoelectric behaviour in relaxor based ferroelectric single crystal’, J. Appl, Phys, Vol
82(4), (1997) p1804
[3]. H. Fu and R. E. Cohen, ‘Polarization rotation mechanism for ultrahigh electromechanical response in single-crystal piezoelectrics’,
Nature, Vol 403, (2000), p 281-283
[4]. J. Ravez, and A. J. Simon, Some Solid State Chemistry Aspects of lead –Free Relaxor Ferroelectrics, J. Solid. State. Chem, Vol
162(2),(2001), p 260-265
[5]. T. Takenaka, H. Nagata, Y. Hiruma, Y. Yoshii, and K. Matumoto, ‘Lead-Free Piezoelectric ceramics based on perovskite structure’,
J. Electroceramics, Vol 19(4),(2007) p 259-265
[6]. A. K. Jonscher, ‘The Universal dielectric response’, Nature, Vol 267, (1977) p 673-679
[7]. A. K. Jonscher, ‘Physical basis of dielectric loss’, Nature, Vol 253, (1975) p 717-719
[8]. A. K. Jonscher, ‘Dielectric Relaxation in solids’, Chelsea Dielectric press, London, 1983
[9]. L. A. Dissado, and R. M. Hill, ‘Anomalous frequency dispersion. Near direct current conductivity in disordered
low-dimensional materials’, J. Chem. Soc., Faraday Trans. 2 Vol 80, (1984) p 291-319
[10]. A. K. Jonscher, ‘A many-body model of dielectric polarisation in solid. I. Experimental data and existing interpretations’, Phys. Stat. Sol(b), Vol 83(2), (1977) P 585-597
[11]. A. K. Jonscher, ‘A many-body model of dielectric polarisation in solid. II. The Universal Model’, Phys. Stat. Sol(b), Vol 84(1), (1977), p159- 166
[12]. R. M. Hill, ‘Characterization of dielectric loss in solids and liquids’, Nature, Vol 275,(1978) p 96-99, 1978
[13]. L. A. Dissoda, and R. M. Hill ‘Non-exponential decay in dielectric and dynamics of correlated system’, Nature Vol 279, (1979) p 685-689, 1979
[14]. McCrum, M. E. Read, and G. Williams, ‘An elastic and dielectric effects in polymeric solids’, London, John Wiley and Sons, 1967 [15]. Stefan Chisca, Valentina Elena Musteata, Ion sava and Maria Bruma, ‘Dielectric behaviour of some aromatic polyimide films’,
European Polymer Journal, Vol 47(5), (2011) p 1186-1197
0.5 0.50.92 0.08 0.04 0.96 3
[17]. K. S. Rao, B. Tilak, K.C.V. Rajulu, A. Swathi, H.Workineh, ‘Effect of A-site (Ba2+) and B-site (Zr4+) substitution on structure,
dielectric spectroscopy parameters on Na0.5Bi0.5TiO3 based relaxor ferroelectric ceramic exhibiting morphotropic phase
boundary’, Solid Dielectrics(ICSD), 10th IEEE International Conference, 2010
[18]. U. Akgul, Z. Ergin, M. Sekerci, and Y. Atici ‘AC conductivity and dielectric behaviour of [Cd(Phen)(SCN)2]’, Vacuum, Vol 82(3),
(2007) p 340-345, 2007
[19]. A. K. Jonscher, ‘Low- frequency dispersion in carrier-dominated dielectric’, Philosophical Magazine Part B, Vol 38(6), (1978) p 587-601
[20]. A. K. Jonscher, D. C. Dube, ‘Low-frequency dielectric dispersion in tri-glycine sulphate’, Ferroelectric, Vol 17(1), (1978) p 533-536
[21]. Zhigao. Lu, J. P. Bonnet, J. Ravez and P. Hagenmuller, ‘Correlation between low frequency dielectric dispersion(LFDD) and
impedance relaxation in ferroelectric ceramic Pb2KNb4TaO15’, Solid State Ionics, Vol 57(3-4), (1992) p 235-244
[22]. T. A. Nealon, ‘Low-Frequency dielectric response in PMN-type ceramics’, Ferroelectrics, Vol 76(1), (1987) p 377-382 [23]. R. M. Hill, C. Pickup, ‘Barrier effects in dispersive media’, J. Mat. Sci, Vol 20(12), (1985) p 4431-4444
[24]. J. S. Kim, J. W. Cha, C. S. Kim, and J. S. Kim, ‘Low –Frequency dielectric dispersion of the KLN ferroelectric ceramics’, J. Korean Physical Society, Vol 29(3),(1996) p 365
[25]. T. Mitsui, I. Tatuzaki and E. Nakamura, ‘An Introduction to the physics of ferroelectric’, Science Press, Beijing, Chap1-34, 1983 [26]. L. A. Dissado, and R. M. Hill, ‘Dielectric behaviour of materials undergoing dipole alignment transitions’, Phil. Mag. B, Vol 41(6),
(1980) p 625-642
[27]. S. A. Ahmed, E. M. M. Ibrahim, and S. A. Saleh, ‘Electrical Conduction of SnBi4Se7’, J. Appl. Phys A, Vol 85(2), (2006) p177-184
[28]. J. R. Macdonald, ‘Impedance Spectroscopy’, (NY:Wiley), 1987
[29]. Sangdon. Bu, Dukhyun Chu and Gwangseo Park, ‘Space charge effect on the ferroelectric properties of a (Kx Na 1-x)2(Sry Ba1-y)4
Nb10O30 solid solution system’, J. Korean Physical society, Vol 31(1), (1997) p 223-226
[30]. B. Sundarkannan, K. kakimoto and H. Ohsato, ‘Frequency and temperature dependent dielectric and conductivity behaviour of
KNbO3 ceramics’, J. Appl. PHy, Vol 94, (2003) p5182-5187