Texture Image Classification Using Visual
Perceptual Texture Features and Gabor Wavelet
Features
Muwei Jian
School of Space Science and Physics, Shandong University at Weihai, Weihai, China Email: [email protected]
Haoyan GUO
School of Computer Science and Technology, Harbin Institute of Technology (Weihai), Weihai, China
Lei Liu
Institute of Physics and Electronic Engineering, TaiShan University, Taian, China
Abstract—Texture can describe a wide variety of surface characteristics and a key component for human visual perception and plays an important role in image-related applications. This paper proposes a scheme for texture image classification using visual perceptual texture features and Gabor wavelet features. Three new texture features which are proved to be in accordance with human visual perceptions are introduced. Usually, Subband statistics based on Gabor wavelet features are normally used to construct feature vectors for texture image classification. However, most previous methods make no further analysis of the decomposed subbands or simply remove most detail coefficients. The classification algorithms commonly use many features without consideration of whether the features are effective for discriminating different classes. This may produce unnecessary computation burden and even decrease the retrieval performance. This paper proposes a method for selecting effective Gabor wavelet subbands based on feature selection functions. The method can discard those subbands that are redundant or may lead to wrong classification results. We test our proposed method using the Brodatz texture database, and the experimental results show the scheme has produced promising results.
Index Terms—Visual Perception Texture Features, Gabor wavelet features; Texture image classification; SVM
I. INTRODUCTION
Texture is an important component of human visual perception and can be effectively used for characterizing different image regions. For example, the skin of a zebra can be seen as texture with black and white stripe pattern. In the past, texture features have been extensively studied in the research area of texture image classification and content-based image retrieval, as well as other fields related to pattern analysis [1, 2, 3, 4].
Basically, texture representation methods can be classified into three categories, namely structural, statistical and multi-resolution filtering methods. Typical structure-based methods include morphological and graph
techniques, which describe texture using structural primitives and layout [1]. Statistical methods are commonly used and proved to be effective in texture analysis [3, 4, 5]. Methods based on Multi-resolution decompose a texture image into different scales, from which more statistics can be extracted and used to describe texture features [7, 8, 11, 12, 13]. These methods have been effectively used for solving texture recognition problems.
Due to the resemblance between multi-resolution filtering techniques (such as Gabor and wavelet transform) and human visual process, Gabor and wavelet transform techniques are often used for texture characterization through the analysis of spatial-frequency content. Many publications showed the effectiveness of using these techniques for texture analysis, segmentation, retrieval and classification [7, 8, 11, 12, 13].
However, most previous methods make no further analysis of the decomposed subbands or simply remove most detail coefficients. The classification algorithms commonly use many features without consideration of whether the features are effective for discriminating different classes. This may result in unnecessary computation and even decrease the classification performance.
texture classification performance. We introduce a procedure for selecting effective wavelet subbands [16]. The feature selection functions are used to rank all subbands, so that the problem of selecting the most “useful” subband set reduces to picking up those with highest rankings. Statistics extracted from such subbands are then used to construct feature vectors. In this way, the dimensionality of feature vectors is reduced. Experiments show the selected subbands are effective for discriminating different textures, as the classification performance is much improved.
The rest of the paper is organized as follows. In section 2, we introduce the visual perceptual texture features. Section 3 briefly describes Gabor wavelet decomposition. In section 4, a feature selection algorithm is introduced. In section 5, experimental results are presented in section 5. Finally, we conclude the paper in section 6.
II. NEW TEXTURE FEATURES DERIVING FROM
WAVELET TRANSFORM
Wavelet transform has been widely used in image processing and shows tremendous advantages over Fourier transform. Wavelet transform is a multi-resolution analysis that represents image variations at different scales [6, 7, 8]. According to the definition of wavelet, a wavelet is an oscillating and attenuated function and its integrals equal to zero. It is a mathematical function useful in digital signal and image processing.
Given f(x) is a one-dimensional input signal, a 1-Ddiscrete wavelet transform is defined as:
φjk(x)=2−j/2φ(2−jx−k),
) 2
( 2 )
(x j/2 jx k
jk = − ψ − −
ψ ,
Where: φ(x) and
ψ
(x
)
are the scaling function andwavelet function respectively,
)}
(
{
φ
jkx
and{
ψ
jk(
x
)}
are the two orthogonal function basis sets.Define P0f=f, a 1-D discrete wavelet transform at the
scale j decomposed Pj-1f through orthogonal projection Pjf and Qjf as follows:
∑
+∑
= + = −
k k jk
j k jk j k j
j
j f P f Q f c d
P 1 φ ψ ;
and = ∑−
=
− +
1 0
1 2
) (
p
n
j n k j
k h n c
c ,
∑
= −
=
− +
1 0
1 2
) (
p
n
j n k j
k g n c
d ,
) 1 2 ,..., 1 , 0 , ,..., 2 , 1
(j= L k= N j − .
where: {h(n)} and {g(n)} are low pass filter and high pass
filter, respectively;
{
}
0
n
C
is the input signal; N is thelength of the input signal; L is the necessary progression. Wavelet is commonly used for multi-resolution analysis and representing image variations at different scales. The computation framework of the wavelet transform of a 2D signal involves recursive filtering and sub-sampling, as shown in Fig.1. To clarify the use of symbols, we briefly describe the general process of wavelet transforms and the notations of subbands of wavelet decomposition. At each level, there are three detail images. Following [7], we denote the detail images (subband) as LH (contains the high frequency horizontal information), HL (contains the high frequency vertical information), and HH (contains the high frequency diagonal information). The decomposition/transform also produces one approximation image, denoted by LL, containing the low frequency information. The wavelet transform can recursively decompose the LL band. Since 2 level wavelet decomposition yields 6 detail images, we use LH1, HL1, HH1, LH2, HL2, HH2, and an additional approximation image LL2 to denote all the subband images.
Fig.1. Two-level wavelet decomposition
A. Directionality
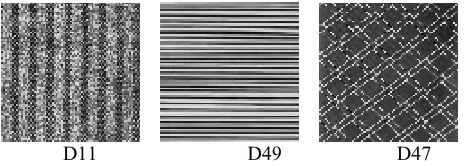
Directionality is an important characteristic for texture images. For example, from human perception’s viewpoint, we perceive the D11 texture in Figure 2 as a “vertical” texture, D49 as a “horizontal” one and D47as “diagonal”. Instead of computing a vague value of directionality, we introduce three different directionalities, namely “the vertical directionality”, “the horizontal directionality” and “the diagonal directionality”, to represent the directional information of a texture image.
LL2 HL2
HL1
LH2 HH2
D11 D49 D47
Fig.2 Three textures from Brodatz database.
The Horizontal Directionality
In allusion to every HL (contains the high vertical frequency information) subband of wavelet decomposition, we compute the horizontal directionality. Let M, N be the sizes of HL subband, and x j k( , )be the subband’s coefficient of wavelet decomposition, where j and k represent the row and column values of the subband images respectively. Firstly, the subband image is
convoluted with a template 1 0 1 1 0 1 1 0 1
⎛ ⎞
⎜ ⎟
⎜ ⎟
⎜ ⎟
⎝ ⎠
at each wavelet
decomposition coefficient in order to enhance the direction contrast. Let h j k( , ) represent the result of convolution. For every row, the normalized convolution result is computed as:
1
| ( , ) |
| ( , ) |
jk N
k h j k p
h j k
=
=
∑
;The horizontal directionality is then defined as :
2
1 1
1 M N
H jk
j k
Dir p
MN = =
=
∑∑
,Where M, N are the sizes of HL subband.
Fig. 3 (a) is the D1 texture from the Brodatz database and (b) shows the 10th row’s coefficient convolution result of HL1 subband .
(a)
0 20 40 60 80 100 120 140
-400 -300 -200 -100 0 100 200
(b)
Fig.3 (a) The D1 texture from Brodatz database. (b). The coefficient convolution result of the 10th row’s HL1 subband .
The Vertical Directionality
Similar to the definition of the horizontal directionality, the LH subband is convoluted with a different template
1 1 1 0 0 0 1 1 1
⎛ ⎞
⎜ ⎟
⎜ ⎟
⎜ ⎟
⎝ ⎠
for each coefficient produced by wavelet
decomposition. Let v j k( , ) represent the result of convolution; j and k represent the row and column values of the subband. Then for every column, normalized coefficient convolution result is computed as:
1
| ( , ) |
| ( , ) | jk M
j v j k q
v j k
=
=
∑
;The vertical directionality is defined as :
2
1 1
1 M N
V jk
j k
Dir q
MN = =
=
∑∑
,Where M, N are the sizes of HL subband.
The Diagonal Directionality
Compared to the horizontal and vertical directionality, the computation of the diagonal directionality is more complex. We should take two diagonal directions into account, namely, / 4π and 3 / 4π .
When we consider the diagonal directionality of / 4π ,
convolution is performed with a template 0 0 1 0 1 0 1 0 0
⎛ ⎞
⎜ ⎟
⎜ ⎟
⎜ ⎟
⎝ ⎠
at the
HH subband. Similarly, when the diagonal directionality of 3 / 4π is considered, convolution is computed with a
template 1 0 0 0 1 0 0 0 1
⎛ ⎞
⎜ ⎟
⎜ ⎟
⎜ ⎟
⎝ ⎠
3 / 4π diagonals for computing the diagonal directionality. The calculation process is the same as the horizontal and vertical directionality. The diagonal directionality in the same wavelet decomposition level is defined as the average of the diagonal directionality of
/ 4
π and 3 / 4π :
1 2
1
( )
2
D D D
Dir = Dir +Dir ,
Where DirD1 represents the Diagonal Directionality of / 4
π andDirD2 represents the Diagonal Directionality
of 3 / 4π , respectively. B. Contrast
For the purpose of denoting the change of grey levels in a texture, contrast is commonly defined for each pixel as an estimate of the local variation in a neighborhood. The calculation of the contrast is implemented in the wavelet decompose approximation subband, denoted as LL, which contains the low frequency and reflecting the global information of the texture.
Given ( , )x j k as the coefficient of LL subband, where j and k represent the row and column values of the subband images, respectively, let the pixel at the point (j, k) be ( , )x j k and the neighborhood of size W W× be a mask of the pixel. Then local contrast is computed as:
max ( ) min ( )
_ ( , )
max ( ) min ( )
x W W x W W x W W x W W
x x
l con i j
x x
∈ × ∈ ×
∈ × ∈ ×
− =
+ .
The global contrast is defined as the mean of all the local contrast values:
1 1
1
_ ( , ) M N
j k
Con l con i j
MN = =
=
∑∑
.
Since the wavelet decomposition results in a smaller size for the approximation subband compared with that of the original texture's size, we recommend a neighborhood window with a size of 3x3, instead of using the size 7x7 as introduced in [20].
C. Coarseness
Coarseness is the granularity measurement of texture and the most fundamental texture feature. Researchers usually identify the texture by “coarseness”. The coarseness defined by Tamura etc. in [3] coincides well with the psychological measurements for human perception, so we also use it in the wavelet decompose approximation subband to calculate the granularity of texture. The computational definition of coarseness is briefly described as follows:
The moving average Az( , )s t over the neighborhood of size 2z×2z (z=0, 1, 2, 3, 4, 5) at the point (s, t) is
1 1
1 1
2 2
2
2 2
( , ) ( , )
2
z z
z z j s k t
z j s k t
Az s t x j k
− −
− −
= + = +
= − = −
=
∑ ∑
.
Wherex j k( , )is the coefficient of the LL subband at ( j, k).
Then, the differences between pairs of non-overlapping moving averages in the horizontal and vertical directions for each pixel are computed,
1, ) 1, ) |
, ( , ) | ( 2z t ( 2z t
Ez h s t = Az s+ − −Az s− − ;
1 1
, ) , ) |
, ( , ) | ( t 2z ( t 2z
Ez v s t = Az s + − − Az s − − .
At each point, the value of Z that maximizes E in either direction is used to set the best size:
( , ) 2z Sbest s t = ;
The global coarseness is calculated by averaging Sbest over the entire LL subband:
1 1
1
( , )
M N
j k
Sbest
Conse j k
MN = =
=
∑∑
More details on the Visual Perception Texture Features can be found in [17, 18].
III. GABOR WAVELET FEATURES
Similar to the wavelet transform, Gabor filtering, which is also called Gabor wavelet, can also produce a multi-resolution representation of the sample texture image. Gabor filtering provides a flexible scheme for designing efficient algorithms to capture more orientation and scale information. A two dimensional Gabor function g(x, y) is defined as
2 2
1 1
( , ) exp - 2
2 2
2 X y 2 X y
y x
g x y π jWx
πσ σ σ σ
⎛ ⎛ ⎞ ⎞
⎜ ⎜ ⎟ ⎟
= ⎜ + + ⎟
⎜ ⎟
⎜ ⎝ ⎠ ⎟
⎝ ⎠
where σX and σy are the standard deviations of the Guassian envelopes along the x and y direction [1].
Then a set of Gabor filters can be obtained by appropriate dilations and rotations of g(x, y):
gmn(x, y) =a-mg( , )x' y' ;
' ( cos sin )
' ( sin cos )
m x y
x a
m x y
y a
θ θ
θ θ
−
= +
−
where a >1, θ = nπ/K, n = 0, 1, …, K-1, and m = 0, 1, …, S-1. K and S are the number of orientations and scales.
The scale factor a−m is to ensure that energy is independent of m.
Given an image I(x, y), its Gabor transform is defined as:
( , ) ( 1, 1) 1 1
I x y g x y y dy
Wmn=∫ ∗mn −x − dx
Where * indicates the complex conjugate. A bank of filters at different scales and orientations can extract the texture frequency and orientation information effectively. Then the mean µmn and the standard deviation σmn of the magnitude of W mn( , )x y can be used to construct
feature vectors, denoted by
[
11, 11,..., mn, mn,..., SK, SK]
f = µ σ µ σ µ σ . The features can
be used to characterize the texture image.
IV. SUBBAND SELECTION ALGORITHM
A feature selection algorithm that can reduce the dimensionality of feature vectors is often desirable. In the context of wavelet transform, feature selection can be treated as subband selection. However, the problem of finding an optimal feature subset is NP-hard [9, 10]. In general, the fewer classes to be dealt with, the simpler the problem can be. For texture image classification, we may divide all the candidate images into two classes. Those candidates similar to the sample image can be considered as one class, because they have similar feature vectors. The remaining images can be treated as the other class, as their feature vectors can be quite different from that of the sample image. Thus, we may set a “threshold” that can be used to select effective subbands, so that the two classes can be well separated.
The basic idea is to rank all the subbands according certain criteria so that the problem of selecting the effective subset reduces to picking the first few subbands. Such subbands can be defined as effective and discriminating ones, offering the benefit that only the effective and discriminating features are involved in computation during texture image classification.
We employ the feature selection functions for choosing effective Gabor wavelet subbands. First, let us define the subband selection problem as follows. Given a texture image that has been decomposed into n subbands, the goal is to select a set of l (l<n) subbands that can be effectively used to produce the minimal retrieval error. Obviously, the number of the selected subbands should be kept as small as possible without affecting the final classification accuracy.
The subband selection scheme comprises the following steps:
(1) Suppose there are m texture images in the database. Compute the J-level Gabor wavelet decomposition of all images to obtain n subbands.
(2) Calculate the values of feature selection functions using the ith-subbands of the query texture and the m
candidate images:
1 s
Gi , …Gijs ,…, Gims ;
where s=L2, Gijs is the Fisher’s discriminant which is a commonly used quantity for feature selection. The basic idea is to select a feature that maximizes the separation of the means of two classes scaled according to the variance. The quantity for measuring the separation is defined as:
2 2
2
) (
σ
σ
µ
µ
jk ik
jk ik k
G
= −+; k=1, 2,…,n
where:
µ
ik andµ
jk are the mean values of the kth features of classω
i andω
j respectively.σ
ik andσ
jk are the standard deviations of the kth features of classω
i andω
j respectively.A greater
G
k indicates that classω
i andω
j has a better separateness (discrimination) with the kth features. Corresponding to the weighted L2 distance, we define the new discriminants based on Fisher’s discriminant :
2
| |
2
2 2 ik jk L
G k
jk ik
µ µ
σ σ
− =
+
;
We name the discriminants as “feature selection functions” respectively.
(3) Calculate the mean of all values computed using the ith-subband’s feature selection functions:
1 1 1 m
s Gijs
i m
i µ = ∑
= ; (j=1,2,…,m)
In this way we obtain altogether n mean values of the feature selection functions corresponding to n subbands : µis1, …µijs,…, µsin ;
(4) Sort the mean values (µis1, …µijs,…, µins ) in a decreasing order. Select l( l <n) subbands corresponding to the first l mean values.
The selected l Gabor wavelet subbands can be effectively used for texture image classification. In this paper, we used the statistics (mean and standard deviation) extracted from the selected subbands to construct texture feature vectors for classification.
V. EXPERIMENTAL RESULTS
A variety of experiments are performed to verify the effectiveness of the combining scheme. Fig. 4 shows some texture samples from the Brodatz texture database [21].
All the texture images are transformed by wavelet decomposition and Gabor wavelet decomposition to extract texture feature for classification. The introduced texture features are tested using the Brodatz texture database [21]. In our experiments, our implementation of the Gabor wavelet is based on Manjunath et al’s work [7, 8]. In our experiment, the feature is computed by filtering the texture image with 6 orientations and 4 scales and computing the mean and standard deviation of the output in the frequency domain. In our experiments, we select the 12 subbands out of the total 24 subbands. Every texture is represented by a 24-dimensional feature vector
Fig4. Some texture samples from the Brodatz texture database.
(comprising mean and variance values), whereas the traditional texture feature vector is 48-dimensional [7, 8]. Then, Support Vector Machine algorithm, which is developed from optimal classification in the sense of linear separation [14, 15], is used as the classifier. Kernel functions are introduced in order to construct non-linear decision surfaces. They map the data to some higher dimensional feature space and construct a separation hyper-plane in this space. Radial basis function kernel, also called RBF:
(
)
={
− − 2 γ2}
/ exp,xi x xi
x
K ;
This is a radial basis classifier. For most pattern recognition applications, using different parameters may have more effects on the correct recognition rate than using different kernel functions [14, 15].The RBF kernel can be used in applications related to human vision characteristics such as license plate recognition.
The SVM algorithm, using the RBF kernel functions, employed for classification was as described in the above section. The experiments results for various experimental training samples are listed in Table 1. Every sample was divided into 24 sub-images to perform the classification. For every class, we random selecting 14 textures used for training and the rest 10 textures for testing. Another experiment is 18 textures used for training per class, and the rest 6 textures were used for testing.
It can be seen that our proposed method is not only effective but also efficient.
Table 1. Experiments results for various experimental trainning samples.
Method A: using all the Gabor wavelet subbands features and visual perceptual texture features.
Method B: selected Gabor wavelet subbands features and visual perceptual texture features using feature selection algorithm.
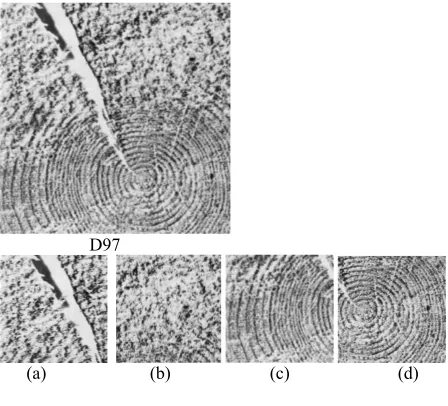
In addition, we analyzed the cases which have low classification accuracy and misclassifications. We discovered that the cause of misclassification was that some sub-images in a same class were not perceptually similar at all. Because some texture images in the Brodatz texture database are anisotropic, in the phase of dividing each texture into 24 overlapping texture-images, sub-images in the same class are not similar ultimately, such as sub-images (b) and (c) derived from the D43 texture, sub-images (a) and (d) from the D97 texture image (shown in Fig.5). These misclassifications of sub-texture-images are observed dissimilar from human visual perception. The experimental results are therefore reasonable if these cases are discarded.
D97
(a) (b) (c) (d)
D43
(a) (b) (c) (d)
Fig.5 Some texture images (D97, D43) in the Brodatz texture database and result of are the sub-texture-images producing by divide the same texture into 4 ((a), (b), (c), (d)) sub-images.
VI. CONCLUSION AND DISCUSSION
In this paper, we propose a scheme for texture image classification using visual perceptual texture features and Gabor wavelet features. Then, a simple feature selection procedure based on a modification of Fisher’s discriminant for texture classification. Subbands are first sorted according to the mean value of proposed feature selection functions. Then the first few subbands are selected. Our experiments show that while the dimensionality of feature vectors is reduced (for Gabor wavelet: from 48 down to 24), the classification accuracy is raised. Many experiments have tested the effectiveness of the proposed scheme.
Furthermore, more experiments based on different image database will be tested in the future.
ACKNOWLEDGMENT
This work is supported by the National Natural Science Foundation of China and Chinese Academic of Sciences joint fund on astronomy under project No. 10778619.
REFERENCES
[1] Long F., Zhang H.J., and Feng D.D. (2003)
"Fundamentals of content-based image retrieval" in Multimedia Information Retrieval and Management- Technological Fundamentals and Applications, D. Feng, W.C. Siu, and H.J. Zhang (Eds.), Springer, 2003.
[2] Howarth, P., Ruger, S.: Evaluation of texture features for content-based image. retrieval. In: Proceedings of the International Conference on Image and Video Retrieval, Springer-Verlag (2004) 326–324
[3] H. Tamura, S. Mori, and T. Yamawaki, "Texture features corresponding to visual perception," IEEE Trans. On Systems, Man, and Cybernetics, vol. Smc-8, No. 6, June 1978.
[4] F. Liu, and R. W. Picard, "Periodicity, directionality, and randomness: Wold features for image modeling and
Training samples number
Testing samples number
Average Accuracy Of Method A
Average Accuracy Of Method B
14ⅹ102 10ⅹ102 81.6% 83.7%
retrieval," IEEE Trans. on Pattern Analysis and Machine Learning, Vol. 18, No. 7,July 1996.
[5] R. W. Picard, T. Kabir, and F. Liu, "Real-time recognition with the entire Brodatz texture database,"Proc. IEEE Int. Conf. on Computer Vision and Pattern Recognition, pp. 638-639, New York, June .1993.
[6] I. Daubechies, "The wavelet transform, time-frequency localization and signal analysis," IEEE Trans. on Information Theory,Vol.36,pp.961-1005,1990
[7] B. S. Manjunath, and W. Y. Ma, "Texture features for browsing and retrieval of image data," IEEE Trans. on Pattern Analysis and Machine Intelligence, Vol. 18, No. 8, pp. 837-842, Aug. 1996.
[8] Manjunath, B. Wu, P. Newsam, S. and Shin, H. “A Texture Descriptor for Browsing and Similarity Retrieval.” Journal of Signal Processing: Image Communication, 16(1), pp. 3343, September 2000.
[9] Abhir H. Bhalerao and Nasir M. Rajpoot.” Discriminant Feature Selection for Texture Classification”.In proc. British Machine Vision Conference ,sep.2003
[10]O. Boz. Feature Subset Selection by Using Sorted Feature Relevance. In Proc. Intl. Conf. on Machine Learning and Applications, June 2002.
[11]Simona E. Grigorescu, Nicolai Petkov, and Peter Kruizinga “Comparison of Texture Features Based on Gabor Filters” IEEE Transactions on image processing, Vol. 11, no. 10, OCTOBER 2002
[12]J. Smith and S.-F. Chang, “Transform features for texture classification and discrimination in large image database”. IEEE Intl. Conf. on Image Proc., 1994.
[13]Y. Ma and B. Manjunath, “Texture features of wavelet transform features for texture image annotation”, IEEE Intl. Conf. on Image Proc., 1995.
[14]Vapnik V N. Statistical Learning Theory [M]. New York: John Wiley & Sons Inc, 1998.
[15]XueGong Zhang. Introduction to statistical learning theory and support vector machines[J]. Acta Automatica
[16]Dong, Junyu; Jian, Muwei; Gao, Dawei; Wang, Shengke. "Reducing the dimensionality of feature vectors for texture image retrieval based on wavelet decomposition". Proceedings - SNPD 2007: Eighth ACIS International Conference on Software Engineering, Artificial Intelligence, Networking, and Parallel/Distributed Computing, v 1, 2007, p758-763..
[17]Muwei, Jian, Dong, Junyu; Gao, Dawei; Liang, Zuojuan "New texture features based on wavelet transform coinciding with human visual perception". Proceedings-SNPD 2007: Eighth ACIS International Conference on Software Engineering, Artificial Intelligence, Networking, and Parallel/Distributed Computing, v 1, 2007, p 369-373.
[18]Muwei, Jian, Junyu Dong, “New Perceptual Texture
Features Based on Wavelet Transform”. International Journal of Computer & Information Science (IJCIS). Volume 9, Number 1, pp 11
[19]Georgeson, M. A., “Spatial Fourier Analysis and Human Vision,” Chapter 2, in Tutorial Essays in Psychology, A Guide to Recent Advances, N. S. Sutherland (ed.), vol 2, Lawrence Earlbaum Associates, Hillsdale, N.J., 1979. [20]Battiato, S. Gallo, G. Nicotra, S. Perceptive visual texture
classification and retrieval. 12th International Conference on Image Analysis and Processing pp. 524- 529. Sept. 2003
[21]P. Brodatz, Textures: A Photographic Album for Artists& Designers, Dover, New York, 1966.
[22]Georgeson, M. A., “Spatial Fourier Analysis and Human Vision,” Chapter 2, in Tutorial Essays in Psychology, A Guide to Recent Advances, N. S. Sutherland (ed.), vol 2, Lawrence Earlbaum Associates, Hillsdale, N.J., 1979. [23]Devalois, R.L., D.G. Albrecht, and L.G. Thorell, “Spatial
-frequency selectivity of cells in acaque visual cortex,” Vision Research, 22, pp. 545-559, 1982.
[24] Caelli, T., Visual Perception, Pergamon Press, 1981.
Muwei Jian is a lecturer in the School of Space Science and Physics, Shandong University at Weihai, China. Mr. Jian holds 3 granted patents and has published more than 20 journal and international conference papers (indexed by EI and ISTP). His research interests include image processing, wavelet analysis, multimedia analysis and computer vision. He has investigated issues in content-based image/multimedia retrieval, 3D texture synthesis, editing and synthesis of 3D surface texture, texture classification and image fusion etc.
Haoyan GUO is a lecturer in the School of Computer Science and Technology, Harbin Institute of Technology (Weihai), Weihai, China.