13
(IJC)
ISSN 2307-4523 (Print & Online)
© Global Society of Scientific Research and Researchers
http://ijcjournal.org/
Design of MIMO Antenna Array Architecture for Higher
Channel Capacity
Phyu Phyu Thin
a*, Aung Myint Aye
ba
Department of Information Technology, Mandalay Technological University, Mandalay,
The Republic of the Union of Myanmar
b
Department of Information Technology, Mandalay Technological University, Mandalay,
The Republic of the Union of Myanmar
aEmail: [email protected]
bEmail: [email protected]
Abstract
In many extensive researches, the channel capacity of narrowband multiple-input multiple-output (MIMO)
communication systems in indoor Line-of-Sight (LOS) environment is investigated and proved that the LOS
signal can get the high channel capacity by designing the antenna arrays. On the other hand, MIMO systems
offer significant capacity enhancements in non Line-of-Sight (LOS) environments where rich scattering is
present. However, the wireless propagation mechanisms and antenna array orientation should be considered
when designing the wireless network to get more precise results and improve the performance. This paper
investigates the performance of MIMO system based on two ray ground reflection model. In this system, the
LOS signal and the LOS signal with one ground reflected ray can provide the optimum MIMO capacity
performance if specific designed antenna arrays are employed at both sides of the communications link. For
achieving the optimal MIMO capacity in a LOS environment, the antenna array architecture is considered as a
function of the distance between transmitter and receiver, the transmitted and received antennas’ height, the
array orientation and the antenna spacing distance. The capacity sensitivity for a number of MIMO architectures
with respect to the experimental data and simulation is investigated by using MATLAB programming language.
Keywords: MIMO; channel capacity; indoor propagation; antenna array orientation; two ray ground reflection
model.
---
14
1. Introduction
MIMO wireless communication systems can increase channel capacity greatly without the expansion of
bandwidth by applying space diversity at both transmit and receive antennas. MIMO capacity increases linearly
with the number of antennas, whereas Single-Input Single-Output (SISO), Single-Input Multiple-Output
(SIMO) and Multiple-Input Single-Output (MISO) systems all increase only logarithmically [1]. Multiple
antenna systems also mitigate deep fades on any of the channel by the spatial diversity provided by multiple
spatial paths. Each pair of transmit-receive antennas provides a signal path from transmitter to receiver. By
sending the same information through different paths, multiple independently-faded replicas of the data symbol
can be obtained at the receiving end and hence, more reliable reception is achieved. Capacity increases linearly
with Signal-to-Noise Ratio (SNR) at low SNR, but increases logarithmically with SNR at high SNR [2].
For LOS channels, ray tracing method is used to find array geometries which result in channel matrices with
close to nonnegligible eigenvalues. The LOS channel response will change as the receiver is moved, so that a
capacity distribution is obtained from the ensemble of sample matrix elements at different receiver locations [3].
However, the capacity is practically affected by various channel parameters, especially correlation between
subchannels. Many models representing MIMO channels have been published, but most of the models assume
specific scenarios, and cannot consider sufficiently various parameters to affect channel performance [2].
According to the ray tracing method, the method proposed here can consider different types of antenna patterns
with array orientation and ground reflected ray of each path between transmit (Tx) and receive (Rx) antenna.
The objective of this paper is to design a new geometrical model for the LOS component with regard to capacity
as a function of the distance between transmitter and receiver, the transmitted and received antennas’ height,the
array orientation and the antenna spacing distance and ground reflected ray for each path at the carrier frequency
of 2.4 GHz.
2. Background Theory
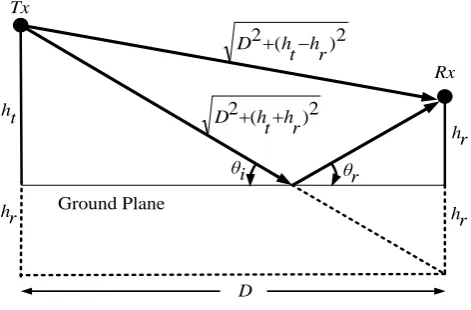
2.1. Two Ray Ground Reflection Model
In a wireless communication system, if there is only a single direct path between transmitter and receiver, the
Friis free space propagation model can be used for simple path loss estimations. However, a slightly more
realistic model, two-ray model is a commonly used propagation model because it accounts for a
ground-reflected path between transmitter and receiver in addition to the LOS component as shown in Figure 1.
Two-ray model has been shown to produce more accurate path loss estimates at long distances than Friis free
space equation. It accounts for antenna height differences at the transmitter and receiver, which is not
considered in the Friis equation [4]. The two-ray model also assumed that the angle of incidence of the reflected
15
Tx
Rx t
h
r h
D
Ground Plane
i
θ θr
r h r
h
2 ) ( 2
r h t h
D
2 ) ( 2
r h t h
D
Figure 1: Two ray ground reflection model with not equal Tx and Rx antenna heights
2.2. MIMO Channel Model
Figure 2: The diagram of a MIMO system
A single user MIMO system employs N antennas at the transmitter and M antennas at the receiver when
transmitting data over a channel as shown in Figure 2. The received signal in each symbol period is represented
by M×1 received complex-valued signal vector, r and the transmitted signal is represented by the N×1
transmitted complex-valued signal vector, s. The channel His described by an M × N complex matrix where the
jith component of the matrix H, denoted by hji, is the channel response between the jth received antenna and the
ith transmitted antenna. The additive white Gaussian noise at the receiver is described by an M × 1 column
matrix n. Thus, the narrowband frequency flat fading MIMO channel model is described by the matrix equation
as [6]:
r = Hs + n (1)
The M × N MIMO channel matrix can be expressed as follows:
MN M
M
N N
h h
h
h h
h
h h
h
H
... ... ... ... ...
... ...
2 1
2 22
21
1 12
11
(2) H
h11
sN rM
r2 r1
s2 s1
Rx .
.
. Tx
.
.
.
h12
hMN h1N
h22 hM2
16 2.3. MIMO Channel Capacity
Acquiring channel knowledge at the transmitter is in general very difficult in practical systems. When the
transmitter has no channel state information, it is optimal to evenly distribute the transmitted power among the
transmit antennas. The MIMO channel capacity with this scenario can be written as [7]:
Hz
bps
HH
N
P
I
C
Hn t
M
]
/
det[
log
2
2
(3)Where IM is the M×M identity matrix, detdenotes the determinant, Ptis the total average transmitted power
from all Tx antennas, σ2n is the noise variance (power) of the receiving system and HH is the Hermitian transpose
operation of H, i.e. the conjugate transpose of complex matrix H. In the following, it is also assumed that the
average total power Pr received by each Rx antenna (regardless of noises) is equal to the average total
transmitted power Ptfrom allTx antennas, the SNR at each Rx antenna is then
2 n r
P
(4)By applying singular value decomposition (SVD) to H [8], equation (3) can be decomposed as:
Hz bps N
C i
m i
/ ) 1 ( log 1
2
(5)
Where, λi is the i th
eigenvalue of HHH and this equation shows that a MIMO system can be viewed as
consisting of m = min (M, N) parallel SISO channels, where each channel has gain λi, and an average SNR
downscaled with the number of transmitters compared to a SISO system with the same total transmitted power.
3. LOS MIMO Channel with Array Orientation and Ground Reflection
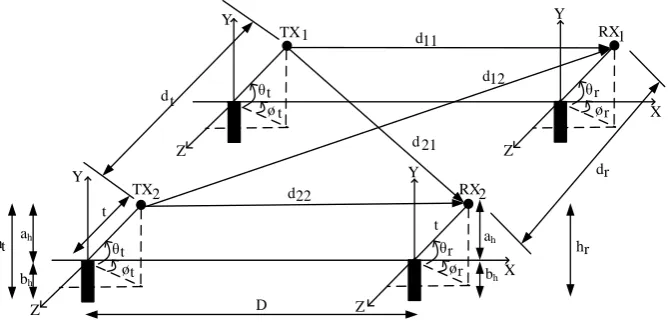
A MIMO channel with direct LOS paths between the antennas is assumed and both Tx and Rx antennas are in
linear arrays as shown in Figure 3. The antenna separation is denoted by dtand drfor both Tx and Rx antennas
respectively and the distance between each Tx and Rx antenna by dji (j=1,…,M, i=1,…,N). D is the distance
between transmitter and receiver. The height of Tx and Rx antennas are ht, and hr respectively and ht=hr = ah +
bh, where,ah = t sin (θt) and t sin (θr) for Tx and Rx antenna respectively and bhis the height of the base under
the antenna.
The proposed system is concentrated on the pure LOS channel and there is no any obstructed thing between Tx
and Rx antenna. Moreover, people are not allowed to walk during experiments. In [3], it was shown that by
placing the antennas in a MIMO system in a smart way, the pure LOS channel matrix actually becomes high
rank, which corresponds to many nonzero eigenvalues λiand thus high MIMO capacity. In this system, more
general geometry, using both Tx and Rx array arbitrary orientation and ground reflection for each path is
17 D Y d11 d22 d12 d 21 ht ø t Y Z d t TX1 θt ør Z θr X Y hr øt Y Z TX2 θt ør Z θr X dr ah bh ah bh t t RX2 RX1
Figure 3: 2 × 2 LOS channel with Tx and Rx array orientation
In this system, the x-axis is taken to be in the direction from each Tx antenna array to each Rx antenna array and
the z-axis is taken to be in the direction between each Tx antenna and each Rx antenna [9]. The transmit array is
placed in the x, y plane. In reference [10], the antenna spacing distances, dtand dr with the uniform linear array
(ULA) are constant. However, the system parameters, dt, dr, ht, hr and D can take different values in this
proposed system. The total length of the Tx and Rx arrays are denoted by (N – 1) dt and (M – 1) dr and the
angles θt, Φt, θr and Φr are the rotation angles of the local spherical coordinate system at the transmitter and
receiver respectively.
3.1. Evaluation of Distance between each Tx and Rx Antenna
The technique used in this proposed system is based on ray tracing approach. The index of Rx and Tx antennas
are described by j = 1,…, M, and i = 1,…, N respectively. As in reference [11], the antenna placements for Tx
and Rx antenna at x, y and z coordinates are given as follows:
)]
sin(
)
cos(
)
1
[(
,
)]
sin(
)
1
[(
,
)]
cos(
)
cos(
)
1
[(
]
,
,
[
t t t x t t y t t t zi
x
y
z
i
d
i
d
i
d
Tx
(6)]
)
sin(
)
cos(
)
1
[(
,
)]
sin(
)
1
[(
,
)]
cos(
)
cos(
)
1
(
[
]
,
,
[
r r r x r r y r r r zj
x
y
z
D
j
d
j
d
j
d
Rx
(7)By using the Euclidean distance formula, the distance between each Tx and Rx antenna is given by
2 1 2 2 2 ] )) cos( ) cos( ) 1 ( ) sin( ) cos( ) 1 (( )) sin( ) 1 ( ) sin( ) 1 (( )) cos( ) cos( ) 1 ( ) cos( ) cos( ) 1 ( [( t t t r r r t t r r t t t r r r ji d i d j d i d j d i d j D d
(8)By assuming that (D(j1)drcos(r)cos(r)(i1)dtcos(t)cos(t))D and using the approximation
A B A B A 2
2 if A >> B since the distance D is much larger than the antenna spacing distance, d t and dr,
18 ] )) cos( ) cos( ) 1 ( ) sin( ) cos( ) 1 (( )) sin( ) 1 ( ) sin( ) 1 [(( 2 1 )) cos( ) cos( ) 1 ( ) cos( ) cos( ) 1 ( ( 2 2 t t t r r r t t r r t t t r r r ji d i d j d i d j D d i d j D d (9)
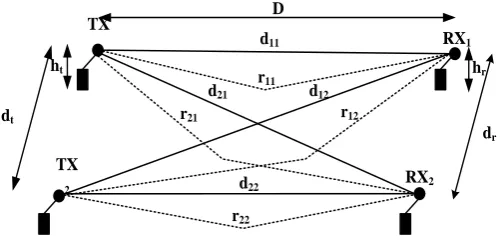
3.2. Channel Matrix Estimation
The channel matrix H is modeled using a ray-tracing approach that includes LOS paths and ground reflected
rays for each path as shown in Figure 4.
dr
TX
1
TX
2 RX2
RX1 d11 d22 d12 d21 D r22 r21 r11 r12 hr ht dt
Figure 4: 2 × 2 LOS channel with ground reflection
Reflection attenuation of the reflected waves is disregarded in this proposed system due to the path loss and
reflection loss they incur, as well as the array orientation to be considered. For narrowband communication
system, the channel is modeled as
H = HLOS +HR (10)
Where HLOS, and HR are the contributions of the LOS path with both Tx and Rx array orientation and ground
reflected path, respectively. In LOS condition, the phase of each channel gain, hji(LOS) is a function of the
geometry and carrier frequency [11]. Thus, the channel gain, hji(LOS), which is jith entry of HLOS, representing
the complex gain from jth Rx antenna to ith Tx antenna is given by
)
2
exp(
)
(
ji jid
j
LOS
h
(11)Where λ is the wavelength of the carrier frequency and djiis the LOS path between the jth Rx antenna and ith Tx
antenna obtained by equation (9). The channel gain, hji(R), from the jth Rx antenna to ith Tx antenna is given by
)
2
exp(
)
(
ji jir
j
R
h
(12)19
4. Experimental Setup
The experimental procedures for this proposed system are briefly described with the system block diagram in
Figure 5. All the experiments were carried out at the portico of the Mandalay Technological University, the
Republic of the Union of Myanmar. The building layout and the top view of the portico are shown in Figure 6
and Figure 7. TP-Link TL-WR1043N router with two 8 dBi omnidirectional antennas was used as a transmitter
and TP-Link TL-WN722N 150 Mbps wireless adapter, configured to mount two 8 dBi omnidirectional antennas
was used as a receiver in all experiments. In all experiments, the actual on-site signal strength measurement
readings were taken using signal analyser software called inSSIDer, which was installed in a laptop. The carrier
frequency was 2.4 GHz and the transmitted power level 20 dBm was used during measurements.
Figure 5: Block diagram of proposed System
Figure 6: Building layout
All the experimental points were marked at the center of the portico as one meter from one end of the portico to
the other end and both Tx and Rx antennas are positioned with the spherical coordinates before measuring the
experiments. Moreover, there was no movement of Tx and Rx antennas during measurements. Exceed Expected
Error? Compare Channel Capacity Values for Different Parameters
MIMO Antenna Array Architecture for Higher Channel Capacity Analyze Narrowband Indoor MIMO
Channel
Analyze Tx and Rx array orientation and ground reflections using two-way model
Modeling channel matrix, H
Conduct Experiments
20
To estimate the channel attenuation and variations, the experiments were made by moving the receiver at every
one meter while the placement of transmitter was stable. The experimental record photos of this system are
shown in Figure 8.
Portico
Registrar’ Office
33 m
Glass wall
Concrete brick wall (thickness = 0.1524 m)
Glass wall and brick wall concrete Portico’ height = 3.5 m
C
lo
se
t
C
lo
se
t
● □ □ □ □ □ □ □ □ □ Tx Rx
1 m
Portico’ width = 15.9 m Portico’ length = 33 m
Figure 7: Top view of the portico
Figure 8: Placement of transmitter and receiver in the portico
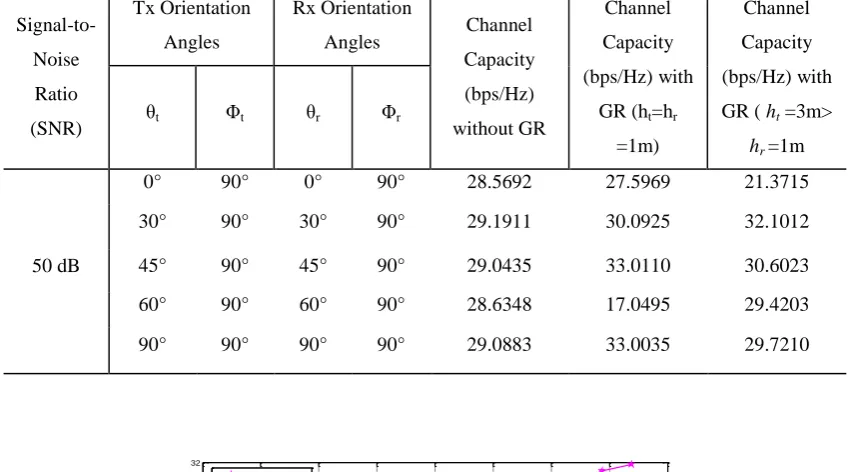
5. Performance Analysis
The configuration for this proposed system is based on the angles of the local spherical coordinate system at the
transmitter and receiver θt, Φt and θr, Φrrespectively. The capacity performance of MIMO antenna structures is
compared using the special angles, 0°,30°, 45°,60° and 90° for θt and θr and 90° for Φt and Φrrespectively. The
performance comparison is shown with the channel capacity versus signal-to-noise ratio (SNR) at 50 dB in the
following Table 1.
Figure 9 shows the experimental result for 2 × 2 LOS MIMO system using array orientation angles of θt = θr =
Φt = Φr = 90
°
and antenna spacing distances of dt = dr = 0.5 m and 0.1524 m respectively. The proposed system
with angles θt = θr = Φt = Φr = 90° has the same consideration with the system which does not have Tx and Rx
antenna orientations [12]. However, it can be seen that the results with Tx and Rx array orientationhave higher
channel capacity than the results with no antenna orientations. This is because of the calculation of the distance
21
Table 1: Comparison Results for Proposed System
34 36 38 40 42 44 46 48 50
12 14 16 18 20 22 24 26 28 30 32
SNR (dB)
C
ha
nn
el
C
ap
ac
ity
(
bp
s/
H
z)
dt=dr=0.5 m dt=dr=0.1524m
Figure 9: Channel capacity versus SNR for LOS channel using θt= θr =Φt = Φr= 90°
In the following, the simulation results for a 2×2 system at D = 24 m, SNR, ρ = 1 to 50 dB, ht = hr=1mforequal
height, ht = 1mor3mand hr= 1m or 3mfor not equal height, andthe antenna spacing distance, dt = dr = 0.5m
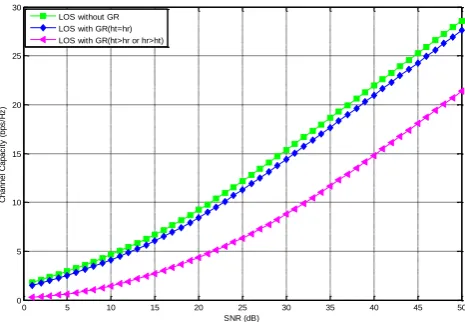
are described. Figure 10 shows the channel capacity versus SNR for three different channels, LOS channel
without ground reflection, GR, LOS channel with GR for equal Tx and Rx heights (ht = hr) and LOS channel
with GR for not equal Tx and Rx heights (ht > hr or hr > ht) using all the orientation angles of 90°. From this
figure, it can be seen how the channel capacity for three different channels differ when the SNR increases with
the antenna configuration θt= θr = Φt = Φr= 90 °
. The channel capacity for LOS channel with GR (ht = hr) is
higher than any two channels with this antenna configuration. The antenna configuration with θt= θr = 45°,
Φt = Φr= 90° has the similar result as shown in Figure 11.
The comparison result for LOS channel and LOS channel with ground reflection (GR) using θt= θr = 0° and Φt =
Φr= 90° is plotted in Figure 12. In this figure, LOS channel without GR has higher capacity result, but it is lower
than the results of LOS channel with GR (ht = hr) in Figure 10 and Figure 11.
Signal-to-Noise
Ratio
(SNR)
Tx Orientation
Angles
Rx Orientation
Angles Channel
Capacity
(bps/Hz)
without GR
Channel
Capacity
(bps/Hz) with
GR (ht=hr
=1m)
Channel
Capacity
(bps/Hz) with
GR ( ht =3m>
hr =1m
θt Φt θr Φr
50 dB
0° 90° 0° 90° 28.5692 27.5969 21.3715
30° 90° 30° 90° 29.1911 30.0925 32.1012
45° 90° 45° 90° 29.0435 33.0110 30.6023
60° 90° 60° 90° 28.6348 17.0495 29.4203
22
On the other hand, in this array configuration, the capacity for LOS channel with GR (ht > hr or hr > ht) is
significantly lower than any other results.
0 5 10 15 20 25 30 35 40 45 50
0 5 10 15 20 25 30 35
SNR (dB)
C
h
a
n
n
e
l
C
a
p
a
c
it
y
(
b
p
s
/H
z
)
LOS without GR LOS with GR(ht=hr) LOS with GR(ht>hr or hr>ht)
Figure 10: Channel capacity versus SNR for LOS channel and LOS channel with Ground Reflection (GR)
using θt= θr =Φt = Φr= 90°
0 5 10 15 20 25 30 35 40 45 50 0
5 10 15 20 25 30 35
SNR (dB)
C
h
a
n
n
e
l
C
a
p
a
c
it
y
(
b
p
s
/H
z
)
LOS without GR LOS with GR(ht=hr) LOS with GR(ht>hr or hr>ht)
Figure 11: Channel capacity versus SNR for LOS channel and LOS channel with Ground Reflection (GR)
using θt= θr = 45°, Φt = Φr= 90°
The following figures, Figure 13 and Figure 14 show the results for the antenna configurations of θt= θr = 30°,
Φt = Φr= 90° and θt= θr = 60°, Φt = Φr= 90° respectively. By seeing these results, it confirms that the antenna
configurations with θt= θr = 90°, Φt = Φr= 90° and θt= θr = 45°, Φt = Φr= 90° are the best antenna structure for
LOS channel with ground reflection, GR (ht = hr) and the antenna configuration with θt= θr = 30°, Φt = Φr= 90°
is the best antenna structure for LOS channel with ground reflection, GR (ht > hr or hr > ht). This is because of
the contributions of this proposed system and so Tx and Rx antenna configuration at the coordinates x, y and z is
the well-designed antenna configuration and ground reflection between each Tx and Rx antennas should be
23
0 5 10 15 20 25 30 35 40 45 50 0
5 10 15 20 25 30
SNR (dB)
C
h
a
n
n
e
l
C
a
p
a
c
it
y
(
b
p
s
/H
z
)
LOS without GR LOS with GR(ht=hr) LOS with GR(ht>hr or hr>ht)
Figure 12: Channel capacity versus SNR for LOS channel and LOS channel with Ground Reflection (GR)
using θt= θr = 0°, Φt = Φr= 90°
0 5 10 15 20 25 30 35 40 45 50 0
5 10 15 20 25 30 35
SNR (dB)
C
h
a
n
n
e
l
C
a
p
a
c
it
y
(
b
p
s
/H
z
)
LOS without GR LOS with GR(ht=hr) LOS with GR(ht>hr or hr>ht)
Figure 13: Channel capacity versus SNR for LOS channel and LOS channel with Ground Reflection (GR)
using θt= θr = 30°, Φt = Φr= 90°
0 5 10 15 20 25 30 35 40 45 50
0 5 10 15 20 25 30
SNR (dB)
C
h
a
n
n
e
l
C
a
p
a
c
it
y
(
b
p
s
/H
z
)
LOS without GR LOS with GR(ht=hr) LOS with GR(ht>hr or hr>ht)
Figure 14: Channel capacity versus SNR for LOS channel and LOS channel with Ground Reflection (GR)
24
6. Conclusion
A new LOS MIMO model is designed geometrically with the consideration of the ground reflection for each
path to find the optimal antenna array orientation with regard to higher channel capacity. The experiments were
made for 2×2 LOS channel using θt = θr = Φt = Φr = 90° antenna configurations. However, the simulation
analysis was made for other antenna configurations using the special angels of 0°,30°, 45°, 60° and 90° for θt and
θr and 90 °
for Φt and Φrrespectively. The antenna configuration with θt= θr = 90 °
, Φt = Φr= 90 °
and θt= θr = 45 °
,
Φt = Φr= 90° can get higher channel capacity than any other configuration for LOS channel with ground reflection,
GR (ht = hr) and the antenna configuration with θt = θr = 30°, Φt = Φr= 90 can give higher channel capacity result for
LOS channel with ground reflection, GR (ht > hr or hr > ht).
In addition, only 2 x 2 matrix antennas radiation type can be used in all experiments as this system proposed to
design the antenna array architecture for higher channel capacity and this system can be extended by using more
antennas similarly. This proposed system can be applied in the consideration of the antenna array architecture in
narrowband communication system.
7. Further Extension
As the further extension, other channel performance measures will be used to analyze the array geometry. Other
types of routers, wireless adapters, antennas, signal analyzer machines or analyzer software will be used to make
performance comparison and estimate the better results. In addition, reflective paths from the side walls and roof
will be considered. The experiments in different indoor environments at Mandalay Technological University
will also be conducted.
Acknowledgements
The author especially would like to take this opportunity to express my sincere gratitude, respect and regards for
supervisor Dr. Aung Myint Aye, Associate Professor, Head of the Department of Information Technology,
Mandalay Technological University, Mandalay, Mandalay Division, the Republic of the Union of Myanmar
under whose guidance, constant encouragement, patient and trust, I have worked on this paper. And the author is
thankful to all my friends who have directly or indirectly assisted me in my endeavors.
References
[1] Charan Langton and Bernard Sklar. “Tutorial 27 - Finding MIMO,” Oct. 2011.
[2] Daniel W. Bliss and Keith W. Forsythe. “MIMO Environmental Capacity Sensitivity,” MIT Lincoln
Laboratory, Lexington, Massachusetts.
[3] P. F. Driessen and G. J. Foschini. “On the Capacity Formula for Multiple Input–Multiple Output Wireless
25
[4] Julia Andrusenko, Jack Burbank, and Jon Ward. “Modeling and Simulation for RF Propagation,” Dec. 2009.
[5] Khaing Phyu and Aung Myint Aye.“Modelling and Analyzing the Signal Strength Attenuation for Indoor
Radio Wave Propagation,” Department of Information Technology, Mandalay Technological University, the
Republic of the Union of Myanmar, May 2011.
[6] A. J. Paulraj, D. Gore, and R. U. Nabar. “Performance limits in fading MIMO channels,” Globecome, 2002.
[7] G. J. Foschini and M. J. Gans, “On limits of wireless communication in a fading environment when using
multiple antennas,” Wireless Personal Commun., vol. 6, no. 3, pp. 311–335, Mar. 1998.
[8] Stefan Schindler and Heinz Mellein. “Accessing a MIMO Channel,” Rohde & Schwarz, Available:
http://www.rohde-schwarz.com [Feb. 2011].
[9] I. Sarris and A. Nix. “Design and performance assessment of maximum capacity MIMO architectures in
line-of-sight,” IEE Proc.-Commun., Vol. 153, No. 4, Aug. 2006.
[10] Frode Bøhagen, P°al Orten and Geir E. Øien. “Construction and Capacity Analysis of High-Rank
Line-of-Sight MIMO Channels,” UniK/Nera Research, Bergerveien 12, N-1375 Billingstad, Norway, 2005.
[11] Phyu Phyu Thin and Aung Myint Aye. “Indoor MIMO Channel Capacity Prediction in Line-of-Sight
(LOS) Environment,” the Fifth International Conference on Science and Engineering (ICSE 2014), Dec. 29-30,