R E S E A R C H
Open Access
Machine learning-based dynamic
analysis of Android apps with improved
code coverage
Suleiman Y. Yerima
1†, Mohammed K. Alzaylaee
2*†and Sakir Sezer
2Abstract
This paper investigates the impact of code coverage on machine learning-based dynamic analysis of Android malware. In order to maximize the code coverage, dynamic analysis on Android typically requires the generation of events to trigger the user interface and maximize the discovery of the run-time behavioral features. The commonly used event generation approach in most existing Android dynamic analysis systems is the random-based approach implemented with the Monkey tool that comes with the Android SDK. Monkey is utilized in popular dynamic analysis platforms like AASandbox, vetDroid, MobileSandbox, TraceDroid, Andrubis, ANANAS, DynaLog, and HADM. In this paper, we propose and investigate approaches based on stateful event generation and compare their code coverage capabilities with the state-of-the-practice random-based Monkey approach. The two proposed approaches are the state-based method (implemented with DroidBot) and a hybrid approach that combines the state-based and random-based methods. We compare the three different input generation methods on real devices, in terms of their ability to log dynamic behavior features and the impact on various machine learning algorithms that utilize the behavioral features for malware detection. Experiments performed using 17,444 applications show that overall, the proposed methods provide much better code coverage which in turn leads to more accurate machine
learning-based malware detection compared to the state-of- the- art approach.
Keywords: Android malware detection, Code coverage, Monkey, DroidBot, Dynamic analysis, Machine learning,
Event generation, State-based input generation, Model-based input generation, Random input generation
1 Introduction
With nearly 80% market share, Google Android leads other mobile operating systems. Over 65 billion down-loads have been made from the official Google play store, and there are currently more than 1 billion Android devices worldwide [1]. According to Statista [2], there will be around 1.5 billion Android devices shipped worldwide by 2021. Due to the increasing popularity of Android, malware targeting the platform has increased significantly over the last few years. According to a recent report from McAfee, there are around 2.5 million new Android mal-ware samples exposed every year, thus increasing the total
*Correspondence:[email protected]
†Suleiman Y. Yerima and Mohammed K. Alzaylaee contributed equally to this
work.
2Centre for Secure Information Technologies (CSIT), Queen’s University Belfast, Belfast, BT7 1NN Northern Ireland, UK
Full list of author information is available at the end of the article
number of malware samples discovered in the wild to more than 12 million [3]. Android malware can be found in a variety of applications such as gaming apps, banking apps, social media apps, educational apps, and utility apps. Malware-infected applications can have access to privacy-sensitive information, send text messages to premium rate numbers without user approval, or even install a rootkit on the device allowing it to download and execute any code the malware developer wants to deploy etc.
In order to mitigate the spread of malware, Google introduced Bouncer to its store in Feb 2012. Bouncer is the system used to monitor submitted applications for poten-tially harmful behaviors by testing the submitted apps in a sandbox. However, Bouncer has been shown to be vulner-able to unsophisticated detection avoidance techniques that can evade sandbox-based dynamic analysis [4]. Fur-thermore, most third party app stores do not have any screening mechanism for submitted applications. There
is therefore a need to further research more efficient approaches for detecting Android malware in the wild.
Android applications are heavily user interface (UI) driven. Because of the UI operation, efficient input gener-ation is crucial for testing applicgener-ations and many tools are available to support developers. Likewise, efficient input generation is needed to drive automated dynamic analysis for malware detection. On the Android platform, malware can hide their malicious activities behind events/actions that require user interaction. Hence, in order to facil-itate effective malware detection, researchers integrate (into their analysis platforms) tools that can simulate the human interaction with the UI. The main goal is to reach a high percentage of code coverage such that most of the suspicious activities are revealed during the analy-sis. However, as highlighted in [5], some challenges still remain with automated test input generation. Many of the existing dynamic analysis systems rely on a random-based input generation strategy random-based on the Android Monkey UI exerciser tool. In fact, the random-based test input generation tool Monkey, iscurrently the most pop-ular input generation tool used in most dynamic analysis systems. Its popularity can be attributed to being readily available as part of the Android developer’s toolkit and its ease of use.
An empirical study conducted in [6] compared the Monkey tool to other input generation tools. The study found that the highest code coverage was achieved by the random-based Monkey tool compared to the other tools. However, the study did not evaluate the impact on machine learning-based detection of Android malware. In our previous work [7], preliminary experiments con-ducted on 2444 Android apps (containing 1222 benign and 1222 malware samples) showed that dynamic analysis behavioral footprint enabled by the random-based Mon-key tool could be improved further. The results showed that stateful approaches enabled better code coverage than the random-based approach. Out of the stateful approaches, the hybrid method performed better than the stand-alone state-based approach. The code cover-age was quantified by the number of apps where specific dynamic behavioral features were traced or discovered from.
This paper extends the preliminary work in [7], and presents a more extensive comparative analysis of the code coverage by the random-based, state-based and hybrid input generation methods by means of a larger dataset of 15,000 apps. The study in this paper focuses on investigating the impact of the input generation methods on performance of machine learning-based Android malware detection, which has not yet been addressed in previous works. In particu-lar, our paper seeks to answer the following research questions:
• Given that the random-based test input generation approach is widely utilized, does this method enable the best possible code coverage for effective detection of Android malware?
• Does the state-based method produce larger behavioral footprints for dynamic analysis compared to the random- based method?
• When the state-based method is combined with the random-based method to enable hybrid input test generation, does this increase the behavioral footprint?
• Lastly, what are the comparative performance differences for various machine learning classifiers that utilize the dynamic behavioral features logged using the random-based vs. state-based vs. the hybrid method? Most importantly, does the use of stateful methods increase classifier performance?
The reminder of the paper is structured as follows. Section2discusses the input generation methods investi-gated in the paper. Section3details the methodology and experiments undertaken. Section4presents and discusses the results. Section 5gives an overview of related work, followed by conclusions and future work in Section6.
2 Input/event generation methods for Android application dynamic analysis
In this section, we describe the input/event generation methods investigated in this paper. The input genera-tion schemes are incorporated into an extended version of our dynamic analysis framework (DynaLog) for com-parative analysis. DynaLog [8] enables dynamic analysis of Android apps by instrumenting the apps with API-Monitor [9] and then logging real-time behavioral fea-tures. DynaLog is extended to enable dynamic analysis on real devices (as described in [10]) in order to mitigate the potential impact of anti-emulation and environmental limitations of emulators on our dynamic analyses. Figure1 shows an overview of the dynamic analysis process using DynaLog. It logs features from API calls and Intents. On the Android platform, Intents are used to signal to the system that a certain event has occurred. Examples of Intents include SMS_RECEIVED, PACKAGE_INSTALL, BOOT_COMPLETED, and PACKAGE_REMOVED. In order to receive the signal for an Intent, an app must register for that particular Intent.
2.1 Random input generation method
The random input generation method is a stateless
Fig. 1Extracting app behavioral footprint using Dynalog [10]
tool, which has been incorporated into many dynamic analyses systems (such as AASandbox [11], ANANAS [12], Mobile Sandbox [13], and vetDroid [14]). Monkey is a random-based events generation tool that is part of the Android Developers’ toolkit [15]. It is a command line tool that can be run on any emulator instance or on a device. It sends a pseudo-random stream of user events into the sys-tem and includes several configuration options. The seed value for the pseudo-random number generator can be set, and if you re-run Monkey with the same seed value it would generate the same sequence of events. A fixed delay can be inserted between the events and if not spec-ified, there is no delay and the events are generated as rapidly as possible. Monkey can be configured to ignore crashes, timeouts or security exceptions and continue to send events to the system until the count is complete.
Although Monkey is quite effective as an event genera-tion tool for dynamic analysis systems, it does not operate with any awareness of the current state of the system. For this reason, the code coverage might not be optimal, and this could reduce effectiveness of detection systems that utilize on it for event generation. This is what we will be investigating in the experiments presented later in the paper by comparative analysis with alternative approaches that have not been utilized in previous works.
The main advantage of the random input generation method is the speed, since events can be sent contin-uously without pausing to determine the current state of the app’s UI. The main disadvantage is that unin-tended consequences, such as turning off Internet con-nectivity, could occur as observed in [7]. Since the input/event generation is not guided, the phone’s set-tings could be inadvertently changed by indiscriminate streams of generated input. This may impact the extent of coverage of the behavioral footprint thus leaving
out key features that could be indicative of malicious activities.
2.2 State-based input generation method
This approach is also known as model-based input gen-eration or model-based exploration [16–20]. The method utilizes a finite state machine model of the app with activ-ities as “states” and events as “transitions.” The finite state model can be built by statically analyzing the app’s source code to understand which UI events are relevant for a specific activity. Alternatively, the model can be built dynamically and terminated when all events that can be triggered from all the discovered state lead to already explored states.
Fig. 2Simplified state transition model example [21]
the new state. Further details on DroidBot are given in [21].
DroidBot was selected for our work because compared to other model-based/state-based tools it is (a) open source, (b) easier to integrate with our existing anal-ysis environment (DynaLog) since it does not require system/framework instrumentation, and (c) usable with common of the shelf Android devices without modifica-tion. The main disadvantage of the state-based approach is that it is considerably slower than the random-based approach. This is due to the fact that the app’s current state needs to be constantly tracked in between sending events. Note that the time taken to traverse the possible states of the app depends on the size and complexity of the apps. Running times therefore vary from app to app.
2.3 Hybrid input generation method
The hybrid input method is a stateful approach that combines the random-based method with the state-based method as described in [7]. This was moti-vated by desire to exploit the strengths of each method for possible improvement in behavioral footprint. Fur-thermore, we want to determine whether a combined scheme will impact the detection accuracy of machine learning-based systems built upon the dynamic analy-sisprocess that utilize the resulting run-time behavioral features.
The hybrid input generation system runs a random-based event generation script random-based on Monkey first.
Afterwards, it commences the state-based phase by starting DroidBot (with dynamic policy mode). It also checks the device configuration in order to restore the device to its original starting configuration, in case this has been altered by any generated ran-dom events. Figure 3 shows a flow chart of the pro-cess [7]. Note that the execution order (i.e., running Monkey before DroidBot) is mandated by technical con-straints that made it infeasible to start with DroidBot first.
3 Methodology and experiments
Two sets of experiments were performed to address the research questions outlined in Section 1: (a) Compara-tive analysis of the random-based, state-based, and hybrid input generation in terms of behavioral footprint. (b) Investigating the impact of the resulting behavioral foot-prints on the performance of various machine learning-based classifiers. In this section, we present the setup of our experiments.
3.1 Testbed configurations
credit-Fig. 3Checking and restoring device configurations on the hybrid input generation system comprising both random and state-based subsystems [7]
loaded sim card to allow sending SMS, outgoing calls, and 3G data usage. The phones were also connected to an Internet-enabled Wi-Fi access point. The aim was to ensure that the dynamic analysis environment mimicked real smartphone operations as much as possible.
The running time was different depending on the input generation method. With the random-based method, each of the applications was installed on a phone and run for 300 s. Preliminary investigation confirmed that 300 s was a sufficient time to generate at least 2000 ran-dom events. The preliminary studies found that for most apps, 2000 events provided optimum coverage beyond which no improvement is observed. With the state-based input generation method, we specified a running time of 180 s which was enough to allow the possible states to be traversed and all relevant events invoked. This was also confirmed via preliminary studies. Therefore, for the hybrid test input generation, we adopted the sum of the times used in the two individual methods, i.e., 480 s.
3.2 Datasets
In order to evaluate behavioral footprints and sub-sequently measure the accuracy performance of the machine learning-based classifiers, we utilized two datasets. The first one (Dataset1) consisted of 2444 apps
with equal numbers of benign and malware apps. The malware apps in Dataset1 are from 49 families of the Android Malware Genome project samples [22], while the benign samples are from McAfee Labs.
The second dataset (Dataset2) had 15,000 apps consist-ing of 6500 clean apps and 8500 malware apps all obtained from McAfee labs. Some of the apps in Dataset2 could not be processed successfully due to errors, crashes, or absence of “activity” components in the app. Out of the initial 6500 benign apps, 6069 were processed successfully. Also, out of 8500 malware apps, only 7434 were processed successfully. Thus, in the end, a total of 13,530 apps were utilized from Dataset2.
3.3 Extracting behavioral features
For each application, a total of 178 dynamic features based on API calls and Intents were extracted. These features were utilized for the comparative behavioral foot-print analyses of the input generation methods using the Dataset1 and Dataset2 respectively. After pre-processing, the total number of features that remained out of the ini-tial 178 for training and evaluating the machine learning classifiers were 102 for random-based method, 110 for state-based method, and 110 for hybrid method.
3.4 Investigated machine learning classifiers
In the second set of experiments, the extracted behav-ioral features were used to investigate the performance of seven popular machine learning classifiers. The classifiers include the following: Sequential Minimal Optimization (SMO), Naive Bayes (NB), Simple Logistic (SL), Multi-layer Perceptron (MLP), Partial Decision Trees (PART), Random Forest (RF), and J48 Decision Tree. These classi-fiers are all implemented in the popular machine learning software WEKA (Waikato Environment for Knowledge Analysis), and we used the default configurations of the classifiers within the software for our experiments. For each input generation method, we studied the perfor-mance of each classifier on the two datasets. The results of our experiments are presented in Section 4 using the “pre-cision,” “recall,” and “weighted F-measure” performance metrics defined as follows:
Recall or sensitivity is the “true positive ratio” given by:
Rec= TP
TP+FN (1)
Precision (also known as “positive predictive rate”) is given by:
Prec= TP
TP+FP (2)
where TP is the true positives, i.e., number of correctly classified instances. FN stands for false negatives, i.e., the number of instances within a class that were incor-rectly classified as the other class. FP is false positives, i.e., the number of instances of the other class that were incorrectly classified as the current class.
F-measure is a metric that combines precision and recall as follows:
FM= 2∗recall∗precision
recall+precision (3)
As the F-measure is calculated for both malware and benign classes, the combined measure known as weighted F-measure is the sum of the F-measures weighted by the number of instances in each class as follows:
W−FM= (Fm.Nm)+(Fb.Nb) Nm+Nb
(4)
where Fm and Fb are the F-measures of the malware and benign classes respectively, while Nmand Nbare the number of instances in the malware and benign classes respectively.
4 Results and disscussions
4.1 Comparisons of behavioral footprint: state-based vs. random vs. hybrid
4.1.1 Random-based approach vs. state-based approach In this subsection, the results of the behavioral footprint analysis of the random-based method compared to the state-based method (from both Datasets 1 and 2) are presented. Figures 4 and 5 show the top 10 extracted run-time features with the largest differences between the two methods, from the malware and benign samples respectively in Dataset1. In this experiment, we discov-ered that some API calls were logged at a higher number with random-based method whereas others were logged at a higher number with state-based method.
Fig. 5Top 10 logged API calls from the benign subset (Dataset1) where the state-based method was better than the random-based method
In Fig.4, the top 10 features where the state-based method had a larger overall behavioral footprint are depicted for the malware subset. The feature NetworkInfo;->getTypeName, logged 114 more with the state-based method than the random-based method. While the feature Landroid/telephony/TelephonyManager;->getDeviceId logged 100 more with the state-based method. In Fig. 5, much larger differences can be seen with the experiments performed on the benign subset of Dataset1. This also corresponds with the fact that the benign apps were generally larger in size than the malware apps in Dataset1.
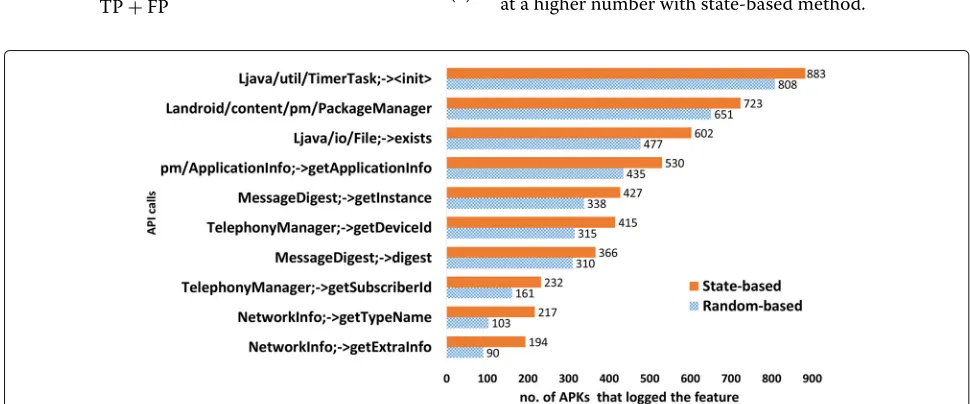
Figures6and7show results of experiments performed on Dataset2 to compare random-based to state-based. In Fig. 6, the top 10 features with the largest differences where the state-based method triggered higher number
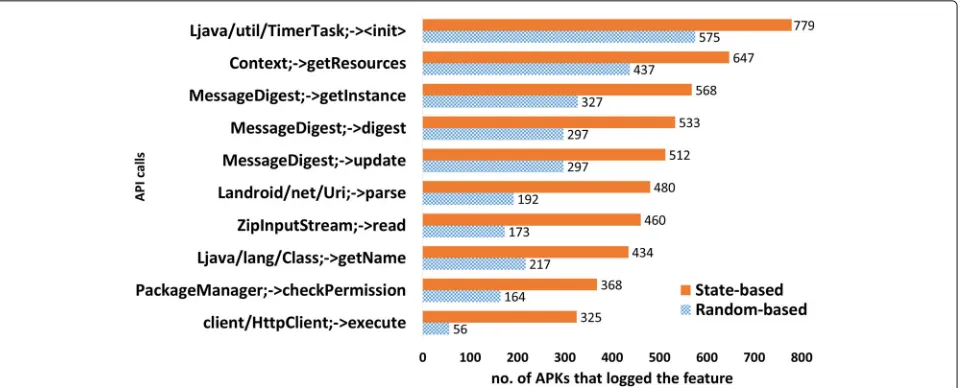
of logs than the random-based method are shown for the malware subset. Similarly, Fig.7illustrates the same for the benign subset. We can see that with Dataset2 there are much higher differences in behavioral footprint between the two test input generation methods compared the Dataset1 scenario.
Figure 8 shows the results of a few exceptional cases where the random-based method outperformed the state-based approach from the malware subset of Dataset1. This indicates that for some applications, the random-based approach could sometimes reach parts of the applications that the state-based method was unable to reach. How-ever, it is worth noting that the overall differences in Fig.8 are smaller than those shown in Fig. 4 thus indicating that the overall footprint is larger with the state-based approach.
Fig. 7Top 10 logged API calls from the benign subset (Dataset2) where the state-based method was better than the random-based method
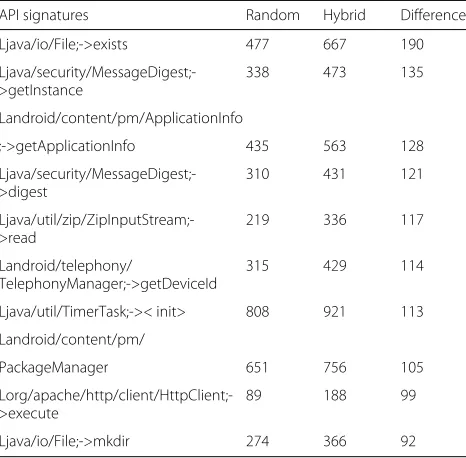
4.1.2 Random-based approach vs. hybrid approach The results of the behavioral footprint analysis of the random-based method compared to the hybrid method (from both Datasets 1 and 2) are presented. Tables 1 and 2 show the top-10 extracted run-time features with the largest differences between the two methods, from the malware and benign samples respectively in Dataset1. Both tables show that more of the API calls were logged from larger number of APKs when the hybrid input test generation method was used com-pared to the random-based method. The API method call Ljava/io/File;->exists, for instance, was logged from 677 malware APKs using the hybrid test input method,
while it was only logged from 477 malware APKs using the random-based approach. Similarly, the method Landroid/telephony/TelephonyManager;>getDeviceId in Table1, was discovered from 429 malware APKs using the hybrid method, whereas only 315 malware APKs logged the same API method when random-based method was used.
Similar results were obtained with the benign samples with even higher differences observed as shown in Table2. For example, the method Landroid/net/Uri;>parse was logged from 492 benign APKs using the hybrid method, while the same method was extracted from only 192 benign APKs using the random-based approach.
Table 1Top 10 API calls logged from malware samples where the hybrid approach was better than the random-based approach (Dataset1)
API signatures Random Hybrid Difference
Ljava/io/File;->exists 477 667 190
Ljava/security/MessageDigest;->getInstance
338 473 135
Landroid/content/pm/ApplicationInfo
;->getApplicationInfo 435 563 128
Ljava/security/MessageDigest;->digest
310 431 121
Ljava/util/zip/ZipInputStream;->read
219 336 117
Landroid/telephony/
TelephonyManager;->getDeviceId
315 429 114
Ljava/util/TimerTask;->< init> 808 921 113
Landroid/content/pm/
PackageManager 651 756 105
Lorg/apache/http/client/HttpClient;->execute
89 188 99
Ljava/io/File;->mkdir 274 366 92
The same experiment was repeated with the larger Dataset2 and the results are presented in Tables 3 and 4. The tables show the top-10 features with the largest differences. In Table 3 (malware subset), the hybrid method shows larger collective behavioral feature foot-prints than the random-based method. For example, the Ljava/util/zip/ZipInputStream;>read feature was logged from 2446 more malware APKs when the hybrid test input method was used compared to the random-based method. Likewise, the Ljava/lang/reflect/Method;->getClass fea-ture was discovered from 4346 malware samples using the hybrid method compared to only 2468 using the
Table 2Top 10 API calls logged from benign samples where the hybrid approach was better than the random-based approach (Dataset1)
API Signatures Random Hybrid Difference
Landroid/net/Uri;->parse 192 492 300
Ljava/util/zip/ZipInputStream;->read 173 408 235
Ljava/security/MessageDigest;->digest 297 519 222
Ljava/security/MessageDigest;->getInstance 327 549 222
Lorg/apache/http/client/HttpClient;->execute 56 264 208
Ljava/lang/reflect/Method;->getClass 359 565 206
Ljava/lang/Class;->getName 217 422 205
Landroid/content/Context;->getResources 437 639 202
Ljava/util/TimerTask;->< init> 575 774 199
Landroid/content/pm/
PackageManager;->checkPermission 164 359 195
Table 3Top 10 API calls logged from malware samples where the hybrid approach was better than the random-based approach (Dataset2)
API signatures Random Hybrid Difference
Ljava/util/zip/ZipInputStream;->read
1270 3716 2446
Lorg/apache/http/client/methods/ HttpPost;->< init>
1128 3501 2373
Ljava/security/MessageDigest;->Instance
2406 4660 2254
Ljava/security/MessageDigest;->digest
2213 4442 2229
Landroid/content/Context;->getResources
2754 4870 2116
Landroid/net/Uri;->parse 917 2992 2075
Ljava/security/MessageDigest;->update
2023 4072 2049
Landroid/telephony/ TelephonyManager;->getDeviceId
2277 4223 1946
Ljava/lang/reflect/Method;->getClass
2468 4346 1878
Ljava/lang/Class;->getName 1879 3742 1863
random-based method. From Table6, out of 122 features with differences in Dataset2, the random-based method had only two features where it logged higher than the hybrid-based method. The results from the benign sam-ples shown in Table 4depict the same pattern of larger
Table 4Top 10 API calls logged from benign samples where the hybrid approach was better than the random-based approach (Dataset2)
API signatures Random Hybrid Difference
Ljava/lang/Class;->getName
1622 2764 1142
Ljava/util/zip/ZipInputStream;->read
817 1943 1126
Ljava/security/MessageDigest;->update
866 1983 1117
Ljava/security/MessageDigest;->digest
934 2040 1106
Ljava/security/MessageDigest;->getInstance
1079 2177 1098
Ljava/util/Date 811 1847 1036
Ljava/lang/reflect/Method;->getClass
2052 3058 1006
Ljava/util/Date;->< init> 784 1785 1001
Ljava/util/List 784 1785 1001
Landroid/content/Context;->bindService
behavioral footprint with the hybrid input test genera-tion method compared to the random-based input test generation method.
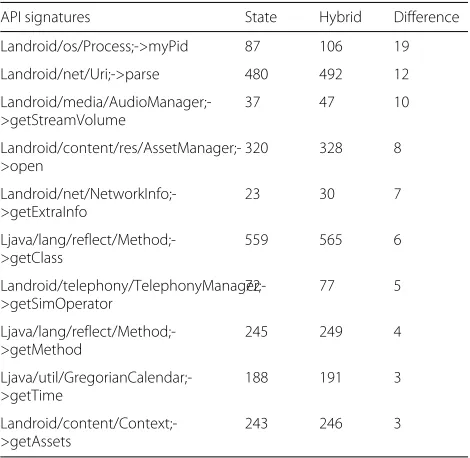
4.1.3 State-based approach vs. hybrid approach
The results of the behavioral footprint analysis of the state-based method compared to the hybrid method (from both Datasets 1 and 2) are presented. Tables5and6show the top-10 extracted run-time features with the largest dif-ferences where the hybrid method logged higher than the state-based method (in Dataset1). Both tables show that more of the API calls were logged from larger number of APKs when the hybrid input test generation method was used compared to the state-based method. It can be seen that the hybrid approach allows for the discovery of more API calls with a difference of over 100 in some cases. For instance, the class Ljava/util/Date was extracted from only 177 malware samples using state-based test input gener-ation, while with the hybrid method, it was logged from 124 more malware samples. The differences decreased to less than 20 samples when we applied the same analysis to the benign sample set.
Tables7, 8, and9present results of comparative anal-ysis with Dataset2. In Tables7 and 8, we show the top 10 features where the hybrid approach has larger behav-ioral footprints than the state-based approach within the APK subsets. With 125, the feature Landroid/net/Uri;->parse has the largest difference in the malware sample set, followed by the Landroid/content/ContextWrapper;->sendBroadcast feature with 92. Similarly, with 117, the feature Landroid/os/Process->;myPid has the largest difference in the benign sample set, followed by the Ljava/Lang/ClassLoader->;loadClass feature with 61.
In Table9, we depict the top 10 features where the state-based approach has larger behavioral footprints than the hybrid approach within the APK subsets. It was stated
Table 5Top 10 API calls logged from malware samples where the hybrid approach was better than the state-based approach (Dataset1)
API signatures State Hybrid Difference
Ljava/util/Date 177 301 124
Ljava/util/Date;->< init> 171 289 118
Ljava/util/List 171 289 118
Ljava/util/Timer;->schedule 222 339 117
Ljava/util/GregorianCalendar;->getTime 107 207 100
Ljava/util/zip/ZipInputStream;->read 242 336 94
Ljava/io/File;->exists 602 667 65
Ljava/security/MessageDigest;->digest 366 431 65
Lorg/apache/http/client/HttpClient;->execute 133 188 55
Ljava/security/MessageDigest;->update 288 335 47
Table 6Top 10 API calls logged from benign samples where the hybrid approach was better than the state-based approach (Dataset1)
API signatures State Hybrid Difference
Landroid/os/Process;->myPid 87 106 19
Landroid/net/Uri;->parse 480 492 12
Landroid/media/AudioManager;->getStreamVolume
37 47 10
Landroid/content/res/AssetManager;->open
320 328 8
Landroid/net/NetworkInfo;->getExtraInfo
23 30 7
Ljava/lang/reflect/Method;->getClass
559 565 6
Landroid/telephony/TelephonyManager;->getSimOperator
72 77 5
Ljava/lang/reflect/Method;->getMethod
245 249 4
Ljava/util/GregorianCalendar;->getTime
188 191 3
Landroid/content/Context;->getAssets
243 246 3
in [7] that out of 76 features with differences, only 4 had the state-based method showing higher logs than the hybrid method, using Dataset1. However, with Dataset2,
there were several more features where the state-based method showed higher logs than the hybrid method,as evi-dent from Table 9. The largest difference can be found in the HttpClient;->execute feature which was found
Table 7Top 10 API calls logged from malware samples where the hybrid approach was better than the state-based approach (Dataset2)
API signatures State Hybrid Difference
Landroid/net/Uri;->parse 2867 2992 125
Landroid/content/ContextWrapper;->sendBroadcast
693 785 92
Landroid/net/NetworkInfo;->getExtraInfo
115 156 41
Landroid/telephony/SmsManager;->sendTextMessage
26 44 18
Landroid/telephony/SmsManager;->divideMessage
3 16 13
Landroid/net/wifi/WifiManager;->setWifiEnabled
9 18 9
Ljava/lang/System;->loadLibrary 1867 1872 5
Landroid/content/ContextWrapper;->startActivity
19 23 4
Ljava/lang/Process;->getOutputStream
80 84 4
Table 8Top 10 API calls logged from benign samples where the hybrid approach was better than the state-based approach (Dataset2)
API signatures State Hybrid Difference
Landroid/os/Process;->myPid 761 878 117
Ljava/lang/ClassLoader;->loadClass 637 698 61
Ljava/lang/Class;->getClassLoader 715 775 60
Landroid/net/Uri;->parse 2322 2378 56
Landroid/media/AudioManager;->getStreamVolume
76 127 51
Ljava/lang/ClassLoader 1130 1177 47
Ljava/util/GregorianCalendar;->getTime
1196 1236 40
Landroid/content/ContentResolver 1223 1258 35
Ljava/io/File;->delete 1221 1256 35
Ljava/io/File;->mkdir 1961 1996 35
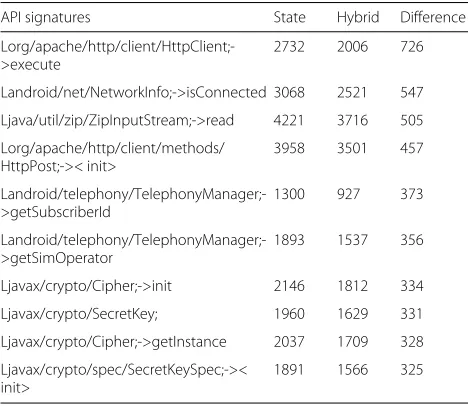
in 726 more malware APKs, followed by the Network-Info;>isConnected feature found in 547 more malware APKs. The methods getSubscriberId and getSimOpera-tor from the TelephonyManager class, were logged from 373 and 356 more malware samples respectively using the state-based compared to the hybrid method.
In a nut shell, much larger differences can be seen in Dataset2 with the features were the state-based approach logged higher than the hybrid approach than vice-versa (for instance 726 vs. 125). Hence, this suggests that the
state-based method enabled an overall larger behavioral footprint than the hybrid method. Investigating how these differences will impact on the machine learning-based
Table 9Top 10 API calls logged from malware samples where the state-based approach was better than the hybrid approach (Dataset2)
API signatures State Hybrid Difference
Lorg/apache/http/client/HttpClient;->execute
2732 2006 726
Landroid/net/NetworkInfo;->isConnected 3068 2521 547
Ljava/util/zip/ZipInputStream;->read 4221 3716 505
Lorg/apache/http/client/methods/ HttpPost;->< init>
3958 3501 457
Landroid/telephony/TelephonyManager;->getSubscriberId
1300 927 373
Landroid/telephony/TelephonyManager;->getSimOperator
1893 1537 356
Ljavax/crypto/Cipher;->init 2146 1812 334
Ljavax/crypto/SecretKey; 1960 1629 331
Ljavax/crypto/Cipher;->getInstance 2037 1709 328
Ljavax/crypto/spec/SecretKeySpec;->< init>
1891 1566 325
detection systems trained on these set of features is the goal of the experiments presented in the next subsection.
The summary of the overall differences in number of features where one method logged higher that the other (far Dataset1 and Dataset 2) are shown in Tables 10 and11.
From Table10, out of 76 features with differences, the random-based method had 23 features where it logged higher than the based method. Conversely, the state-based method had higher logs than the random-state-based method in 49 different features. In Dataset2 (Table 11) (out of 103 features with differences), the random-based is higher than based in 3 features, whereas the state-based is higher than the random-state-based in 100 features. These numbers suggest that the behavioral footprint is larger in both Datasets for the state-based compared to the random-based test input generation method.
Table 10also shows that the hybrid method is higher than the random-based method in 62 features, while the random-based is higher than the hybrid in 10 fea-tures. Similarly, from Table11(Dataset2), hybrid exceeds random-based for 93 features and random-based exceeds hybrid for only 1 feature. These numbers also suggest that the behavioral footprint is larger in both datasets for the hybrid compared to the random-based test input generation method.
In Dataset 1 (Table10) the state-based exceeds hybrid in 4 features while hybrid exceeds state-based in 64 features. This suggests that the behavioral footprint of the hybrid approach is larger than that of the state-based approach. In Dataset 2 (Table11), we have the opposite, i.e., state-based exceeds hybrid in 80 features, while hybrid exceeds state-based in 22 features. This suggests that the behav-ioral footprint is larger for the state-based compared to the hybrid with Dataset2. In theAppendix, we present a full table of the features and number of apps that logged each feature for each respective test input generation method (Table6).
4.1.4 Explanation of the obtained results
The random-based method generates test input events at a much faster rate but a large percentage of these are usu-ally redundant or irrelevant to the current state of the
Table 10Number of features out of 76 total features with differences, where one method had a higher log than the other (Dataset1)
Random-based State-based Hybrid
Random-based - 23 10
State-based 49 - 4
Hybrid 62 64
Table 11Number of features out of 103 total features with differences, where one method had a higher log than the other (Dataset2)
Random-based State-based Hybrid
Random-based - 3 1
State-based 100 - 80
Hybrid 93 22
-Method on the left column is greater than the compared to the method on the top row by the value given in the intersecting box
application. This explains why some of the behavioral fea-tures might not be triggered and logged by the system despite sending thousands of events to the UI. On the other hand, the state-based approach although slower and with much less events being sent to the UI is more accu-rate because of the relevance of the events sent in response to the current state.
The accuracy of the state-based method may be the reason why it enables larger numbers of the apps to log the behavioral features when tested in the dynamic anal-ysis system. Another issue that was observed with the random-based method is that app being analyzed, or the phone was sometimes driven into a state where no fur-ther progress could be made in traversing the app. This also contributed to limiting the extent of the collected behavioral footprint.
In the smaller dataset (Dataset1), the hybrid approach logged higher for more features than the state-based approach. Whereas, with the larger dataset (Dataset2) the state-based approach logged higher for more fea-tures than the hybrid approach. This was counter-intuitive to our original expectation since the combined
approach was designed to exploit the advantages of both state-based and random-based methods. This sug-gests that in the hybrid system, rather than enhance the code coverage, the accuracy of the state-based method was affected by integrating it with the random-based method.
Looking back at Fig.3, during the experiments we dis-covered that it was not always possible to restore the device configuration (i.e., airplane mode and/or WiFi con-nectivity) whenever it had been altered by the random-based subsystem (Monkey) within the hybrid system. In most cases the device was restored properly before the state-based subsystem was invoked. Instances where the proper restoration failed contributed to the lowering the accuracy of the state-based subsystem within the hybrid system. This explains the reason why the stand-alone state-based system had better code coverage than the hybrid system consisting of both state-based and random-based components. In the next subsection, we shall examine the impact of the different code coverage capac-ities of the three methods on various machine learning classifiers.
4.2 Comparisons of impact of the code coverage on machine learning classifiers
In this section the performance of the three input gen-eration approaches are compared using seven popular machine learning classifiers. From the experiments we can gain insight into the impact of their relative code coverage capacities on machine learning-based Android malware detection performance.
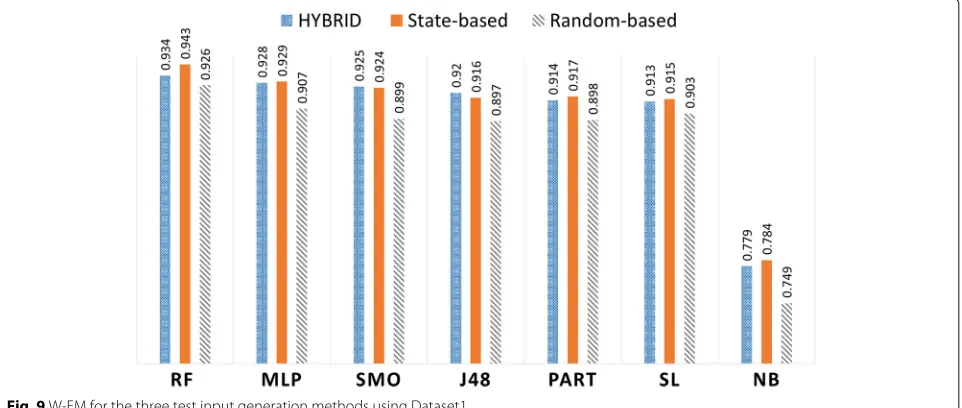
First, we discuss the performance evaluation results from Dataset1 (i.e., 1146 malware and 1109 benign samples). All results are obtained using 10 fold
cross-validation approach. Figure 9 summarizes the weighted F-measures (W-FM) of the seven classi-fiers for the three input generation methods. The Random Forest (RF) classifier performs best for the three methods. The state-based method achieved the best W-FM of 0.943, followed by the hybrid method with 0.934 and then the random-based method with 0.926.
In the remaining 6 classifiers, both state-based and hybrid methods outperformed the random-based method with higher W-FM results. These results can be seen in Table 15 in theAppendix. The hybrid approach showed slightly higher W-FM results for the SMO and J48 classi-fiers. For the MLP, PART, SL and NB classifiers, the state-based approach obtained better W-FM results. Thus, we can conclude that for Dataset1, the overall best accuracy performance is achieved with the state-based, followed by the hybrid method and lastly the random-based method.
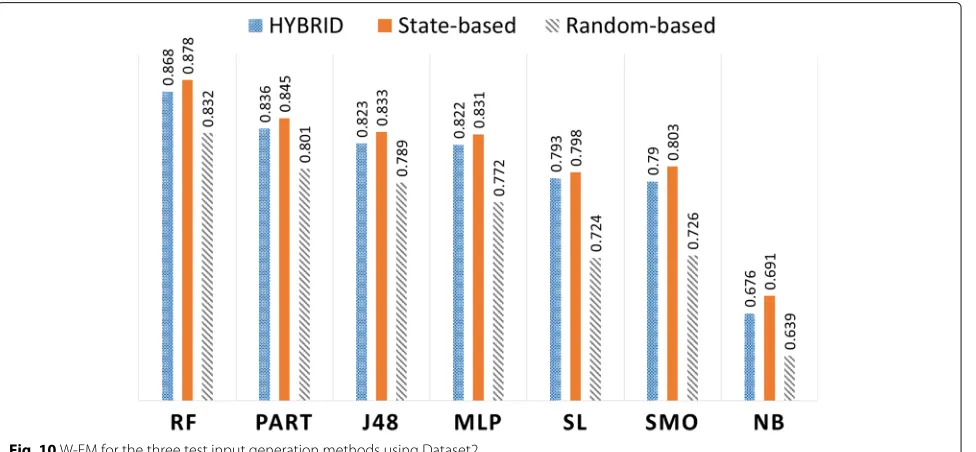
Table 16 in the Appendix contains the performance evaluation results for the seven classifiers, from a second experiment with Dataset2 (i.e., 7434 malware and 6069 benign samples). Figure10summarizes the weighted F-measures (W-FM) of the seven classifiers for the three input generation methods. These results for Dataset2 shows more significant performance differences between the three methods. Again, for each of the test input gen-eration methods, RF achieves the best accuracy perfor-mance. For the RF classifier, the state-based method has WFM of 0.878, followed by the hybrid with 0.868 and then the random-based method with 0.832. Furthermore, both hybrid and state-based methods performed signifi-cantly better than the random-based method in the other
6 classifiers. Figure10shows that the W-FM results for PART, J48, MLP, SL, SMO, and NB were higher for the state-based method compared to the hybrid method.
Figures 11 and 12 show the results from top 20, 40, 60, 80, and 100 information-gain ranked features for the analyzed Dataset1 and Dataset2 respectively. It illustrates the W-FM performance obtained for the RF algorithm trained on both datasets. In all cases, the random-based test input generation method achieved the lowest perfor-mance as the number of features is increased. In addition, from the figures it is clear that the overall detection per-formance of the state-based method surpassed the others especially from 60 features and above.
Even though the analyses in the previous section (as summarized in Tables10and11) showed that each test input generation approach collected higher logs for some specific features, it is the “importance” of the features that will ultimately impact the machine learning performance. The relative importance of the features can be computed by a feature ranking algorithm such as information gain. In Tables12and13, the total information gain scores for each method are presented.
In both datasets, the combine scores for the state-based method is highest (with 1.735 and 1.661487 respectively). This is followed closely by that of the hybrid method, and both of them surpass the random-based method. Even when considering only the top 20 or top 40 ranked fea-tures, the combined information gain scores maintained the same ranking. These results show that the different code coverage capacities of the three methods had an impact on the most important/significant behavioral fea-tures, which ultimately affected the performance of the
Fig. 11W-FM for the RF classifier vs. the top 20, 40, 60, 80, and 100 features (Dataset1)
machine learning classifiers. It shows that compared to the state-based approach, the random-based method is not an optimal choice for dynamic behavioral analysis of Android apps for malware detection.
4.3 Evaluating accuracy performance with additional statically obtained permission features.
In this section we explore accuracy performance improve-ment of the RF dynamic classifiers (trained from Dataset2) with additional static features. In order to achieve this, we extended the dynamically obtained features
(API calls + Intents) with static permission features. Using only Dataset2, the overall W-FM results are illus-trated in Fig. 13. From the Figure we can see that for state-based, hybrid and random-based methods, the W-FM improves from 0.8774, 0.8674, and 0.8319 to 0.93, 0.926 and 0.918 respectively. This illustrates that machine learning-based malware detection systems that utilize both static and dynamic features still need to consider more effective test input generation for the run-time feature extraction aspect in order to maximize accuracy performance.
Table 12Combined Information gain score for the top ranked features within the different test input generation methods
Random-based State-based Hybrid
Dataset1 1.24779 1.735 1.53881
Dataset2 0.586078 1.661487 1.325491
5 Related work
This section reviews related work on Android mal-ware detection and automated test input generation for Android. Previous work on Android malware detection can be categorized under static analysis or dynamic anal-ysis, although some systems combine both techniques. In the static analysis approach, the code is usually reverse engineered and examined for presence of any malicious code. [24–34] are examples of detection solutions based on static analysis. Dynamic analysis on the other hand, involves executing apps in a controlled environment such as a sandbox, virtual machine, or a physical device in order to trace its behavior. Several automated dynamic analy-sis systems such as [8, 19, 35–44] have been proposed for detecting suspicious behaviors from Android applica-tions. However, the efficiency of these systems depend on the ability to effectively trigger the malicious behaviors hidden within an application during the analysis.
Dynamic analysis systems seek to improve behavioral footprint of apps under analysis by applying automated test input generation tools. Hence, test input generation needs to be as efficient as possible because it impacts on the discovery of malicious behavior. Several test input generation tools have been developed in order to trigger Android applications under testing.
Monkey [15], is the most frequently used tool for test-ing Android apps. Linares-Vàsquez et al. [5] stated that Monkey is the only random testing tool available for the researchers. It does not require any additional installa-tion effort as it is part of the Android developers’ toolkit. Monkey implements a random exploration strategy that considers the application under test as a black box to which it continuously sends UI events, until the specified maximum upper bound is reached. Monkey can be used on both emulators and real devices.
Table 13Combined Information gain score for the top 20 and top 40 ranked features within the different test input generation methods
Dataset1 Dataset2
Top-20 Top-40 Top-20 Top-40
Random 0.9 1.13724 0.448147 0.548407
Hybrid 0.94289 1.31038 0.988139 1.202276
State 1.00912 1.45324 1.227877 1.505216
Dynodroid [45] is a random-based test input genera-tion tool for Android. It can generate both IU events and system events. It also has the ability to allow users to manually provide inputs (e.g., for authentication) when exploration is stalling. Its drawback is the need to instru-ment the Android framework in order to generate system events. Also, Dynodroid can only run on an emulator and cannot be used with real devices.
ORBIT [17], is proprietary tool developed by Fujitsu Labs. It implements a model-based exploration strategy (i.e., a state based approach). ORBIT statically analyses the application’s source code to understand which UI events are relevant for a specific activity. Unlike ORBIT, Mobi-GUITAR [46], formerly known as GUIRipper [16] dynam-ically builds the GUI model of the application under test. It implements a depth-first search strategy and re-starts its exploration from its starting state when it can no longer detect new states during exploration. It can only generate UI events and not system events. Also, it is not an open source tool and is only available as a Windows binary.
A3E [18] is publicly available tool that consists of two strategies to trigger the applications: the DFS (depth first search) and a taint-targeted approach. How-ever, the open source A3E repository does not pro-vide the taint-targeted strategy. ACTEve [47] is devel-oped to support both system events and UI events which is based on concolic-testing and symbolic exe-cution. However, ACTEve needs to instrument both the Android framework and the application in order to perform the test. For this reason, ACTEve cannot be used for analysing apps on “common off the shelf ” devices.
PUMA [20] is a tool designed to be a general pur-pose UI automator for Android. It provides the random exploration approach using Monkey. It is also extensible to implement different exploration strategies because it provides a finite state machine representation of the app. However, PUMA is only compatible with the most recent releases of the Android framework.
Fig. 13W-FM of RF classifier for the three test input generation with static permission features included (Dataset2)
each feature as an indicator of code coverage, which has more relevance to malware detection systems.
Unlike [6], this paper focused on code coverage analy-sis of random-based, state-based and a hybrid approach to test input generation using a much larger number of applications consisting of benign and malware samples. As mentioned earlier, the Monkey tool was used to imple-ment the random-based approach, while DroidBot, was used to implement the state-based approach. Both of these tools best met our requirements as representative candidates for the different methods due to the following reasons: (a) open source; (b) usable with common off the shelf Android devices without modification; (c) Android framework and platform independence, i.e., no require-ment for platform or app instrurequire-mentation; (d) amenable to large scale automation for malware detection. Note that DroidBot was not one of the test input generation tools evaluated in [6].
Several dynamic analysis tools for characterizing Android apps have been published in the literature. The majority of these rely on random-based test input gen-eration using Monkey, for example, AASandbox [11], ANANAS [12], Mobile-Sandbox [13], vetDroid [14], TraceDroid [48], Andrubis [49], Dynalog [8], HADM [50], Maline [51], Glassbox [52], NetworkProfiler [53], Andlatis [54], Hu & Neamtiu [55], and Cai & Ryder [56]. Oth-ers such as AppsPlayground [38] used a more intelligent event generation technique, but unlike our paper, did not
investigate code coverage capabilities in the context of on performance analysis of machine learning-based malware detection.
Furthermore, several works have presented machine learning-based Android malware detection systems built upon dynamically obtained features. Marvin [57] applies a machine learning approach to features extracted from a combination of static and dynamic analysis techniques. Shabtai et al [58] presented a dynamic framework called Andromaly which applies several different machine learn-ing algorithms, includlearn-ing random forest, naive Bayes, multilayer perceptron, Bayes net, logistic, and J48 to clas-sify the Android applications. However, they assessed their performances on only four self-written malware applications. MADAM [59] is also a dynamic analysis framework that uses machine learning to classify Android apps. MADAM utilizes 13 features extracted from the user and kernel levels. Other systems include Droidcat [60], STREAM [61], Mobile-Sandbox (2014) [62], Dysign [63], Massarelli et. al [64], Alzaylaee et. al. [10], and Afonso et al. [65]. All of these machine learning-based malware detection systems employ the random-based Monkey tool for test input generation.
on machine learning-based Android malware detection. Such a study provides valuable insights that will be useful for optimizing and improving dynamic analysis systems designed for future Android malware detection.
6 Conclusion
In this paper, stateful input generation approaches are proposed for machine learning-based dynamic analysis for malware detection. These include a state-based approach and a hybrid approach that combines the based with the random-based method. The state-ful approaches were compared to the commonly used random-based method (utilizing the Monkey tool) by evaluating their respective code coverage capac-ities within a dynamic analysis system using real devices. The code coverage capacities were deter-mined based on their respective behavioral footprints measured from logged API calls and Intents cap-tured at run-time from two datasets each consist-ing of benign and malware applications. The state-based approach is implemented using DroidBot, while the hybrid approach combines the Monkey tool with DroidBot.
The paper also presents experiments conducted to study the impact of the respective code coverage capacities of
the input generation systems on various machine learning classifiers. It was found that both state-based and hybrid approaches provided much better code coverage than the random-based method. Contrary to expectation, the hybrid method was unable to improve the code coverage over the state-based method. This was because the ran-dom component of the hybrid system frequently interferes with device operation (despite our implementation of mitigating measures) leading to sub-optimal code cover-age. The state-based approach ultimately enabled the best accuracy performance in majority of the machine learning classifiers.
Based on our findings, it is clear that Android dynamic analysis systems need to incorporate better input generation methods than the currently popu-lar random-based Monkey tool. Furthermore, machine learning-based malware detection systems that employ dynamically obtained features need better input gen-eration tools to improve code coverage. Utilizing a state-based/model-based tool such as DroidBot is def-initely a step towards more robust dynamic analy-sis systems and higher accuracy malware detection capability.
Appendix
Table 14A full table of the features and number of apps that logged each feature for each respective test input generation method
Dataset2 Dataset1
Malware Benign Malware Benign
API signatures RB SB H RB SB H RB SB H RB SB H
1 Ljava/util/TimerTask;->< init> 4373 5893 5776 2785 3499 3465 808 883 921 575 779 774
2 pm/PackageManager 4282 5667 5567 2975 3485 3487 651 723 756 563 742 731
3 Context;->getResources 2754 4994 4870 2536 3410 3414 583 595 639 437 647 639
4 Ljava/security/MessageDigest;->getInstance 2406 4892 4660 1079 2169 2177 338 427 473 327 568 549
5 Ljava/security/MessageDigest;->digest 2213 4538 4442 934 2020 2040 310 366 431 297 533 519
6 Ljava/io/File;->exists 2821 4453 4361 2065 2816 2807 477 602 667 346 501 495
7 Ljava/lang/reflect/Method;->getClass 2468 4433 4346 2052 3084 3058 522 512 540 359 559 565
8 TelephonyManager;->getDeviceId 2277 4512 4223 446 872 874 315 415 429 278 387 378
9 Ljava/security/MessageDigest;->update 2023 4259 4072 866 1951 1983 259 288 335 297 512 465
10 pm/ApplicationInfo;->getApplicationInfo 2538 4019 3893 1485 2088 2078 435 530 563 210 305 300
11 Ljava/lang/Class;->getName 1879 3885 3742 1622 2801 2764 216 175 219 217 434 422
12 Ljava/util/zip/ZipInputStream;->read 1270 4221 3716 816 1927 1943 219 242 336 173 460 408
13 client/methods/HttpPost;->< init> 1128 3958 3501 354 967 927 68 116 150 179 380 369
14 Ljava/util/Date 1351 3295 3212 811 1824 1847 296 177 301 182 342 338
15 Ljava/util/Date;->< init> 1330 3232 3161 784 1752 1785 293 171 289 177 331 329
16 Ljava/util/List 1330 3232 3161 784 1752 1785 293 171 289 177 331 329
17 pm/PackageManager;->checkPermission 1284 3198 3128 301 795 812 76 77 89 164 368 359
18 Landroid/net/Uri;->parse 917 2867 2992 1448 2322 2378 279 241 287 192 480 492
19 Ljava/lang/reflect/Method;->getMethod 1237 2904 2780 711 1442 1440 259 269 285 163 245 249
Table 14A full table of the features and number of apps that logged each feature for each respective test input generation method (Continued)
Dataset2 Dataset1
Malware Benign Malware Benign
API signatures RB SB H RB SB H RB SB H RB SB H
21 Ljava/io/FileOutputStream;->write 868 2723 2674 409 1382 1352 320 344 372 90 147 139
22 Landroid/net/NetworkInfo;->isConnected 666 3068 2521 523 1510 1448 73 84 98 70 210 197
23 Landroid/content/Context;->getFilesDir 1200 2508 2423 1008 1483 1485 49 67 68 96 156 155
24 Landroid/content/res/AssetManager;->open 1452 2300 2277 948 1355 1369 169 187 207 221 320 328
25 wifi/WifiManager;->getConnectionInfo 883 2282 2112 238 582 593 6 14 20 60 120 116
26 intent.BOOT_COMPLETED 2090 2088 2090 1100 1103 1104 621 622 622 170 171 171
27 Lorg/apache/http/client/HttpClient;->execute 333 2732 2006 122 863 785 89 133 188 56 325 264
28 TelephonyManager;->getNetworkOperator 564 2147 1994 124 558 559 86 70 102 68 226 216
29 Ljava/lang/System;->loadLibrary 1538 1867 1872 861 1035 1021 29 22 33 176 207 200
30 Landroid/content/Context;->getAssets 1170 1873 1835 735 1175 1177 125 119 134 155 243 246
31 Landroid/content/Context;->getCacheDir 644 1894 1824 594 1132 1131 15 42 48 38 181 181
32 Ljavax/crypto/Cipher;->init 501 2146 1812 357 1133 1159 41 51 51 69 151 139
33 Ljava/util/GregorianCalendar;->getTime 519 1905 1797 386 1196 1236 224 107 207 64 188 191
34 Ljava/io/File;->delete 527 1956 1776 397 1221 1256 72 88 93 55 118 120
35 Landroid/net/NetworkInfo;->getTypeName 393 1979 1736 122 330 322 103 217 192 48 130 119
36 Landroid/net/NetworkInfo;->getState 621 1922 1726 99 238 241 191 119 135 80 153 145
37 Ljavax/crypto/Cipher;->getInstance 517 2037 1709 303 980 995 47 57 56 73 146 136
38 Ljavax/crypto/SecretKey; 429 1960 1629 333 1071 1095 41 51 51 59 137 127
39 Ljavax/crypto/spec/SecretKeySpec;->< init> 382 1891 1566 326 1061 1086 15 13 15 47 118 112
40 TelephonyManager;->getSimOperator 576 1893 1537 111 245 243 61 109 131 29 72 77
41 Ljavax/crypto/Cipher;->doFinal 413 1562 1480 237 901 918 29 40 40 47 100 88
42 enfperm 1456 1453 1456 2963 2963 2963 47 47 47 147 146 146
43 Ljava/lang/ClassLoader 557 1556 1420 544 1130 1177 190 191 201 34 75 72
44 Landroid/content/Context;->bindService 430 1287 1248 434 1457 1396 1 2 2 31 59 61
45 Ljava/util/Timer;->schedule 404 1240 1213 274 1055 1015 331 222 339 52 120 122
46 Ljava/lang/ClassLoader;->getParent 438 1246 1187 422 917 923 85 76 87 78 173 158
47 Landroid/content/ContentResolver 266 1203 1178 551 1223 1258 101 96 100 52 77 80
48 Ljava/lang/Runtime;->getRuntime 643 1162 1124 465 982 1016 79 56 66 65 85 86
49 Ljava/lang/Class;->getClassLoader 400 1129 990 317 715 775 183 186 196 23 51 49
50 TelephonyManager;->getSubscriberId 478 1300 927 96 154 155 161 232 230 51 78 78
51 com.android.vending.INSTALL_REFERRER 905 907 905 2091 2089 2090 29 29 29 195 196 197
52 Landroid/os/Process;->myPid 318 852 850 326 761 878 6 5 12 32 87 106
53 Ljava/lang/Process 394 798 789 76 265 275 112 122 142 43 70 67
54 ContextWrapper;->sendBroadcast 217 693 785 110 338 332 9 10 13 36 67 65
55 Ljava/net/URLConnection;->connect 6 925 774 3 421 402 12 47 73 2 108 93
56 Ljava/lang/ProcessBuilder;->start 218 777 752 77 251 271 70 122 132 18 56 52
57 Ljava/lang/ClassLoader;->loadClass 239 768 738 283 637 698 0 1 2 16 30 32
58 TelephonyManager;->getLine1Number 322 785 720 71 115 111 114 141 159 34 92 64
59 Landroid/content/Context;->unbindService 84 719 695 70 557 579 0 0 0 4 8 11
60 Ljava/lang/ClassLoader;->getResource 295 766 652 167 275 259 175 182 193 8 23 22
Table 14A full table of the features and number of apps that logged each feature for each respective test input generation method (Continued)
62 PackageManager;->getInstalledApplications 122 776 617 98 166 191 4 4 6 14 59 41
63 USER_PRESENT 565 564 565 202 202 201 45 45 45 24 24 24
64 PACKAGE_ADDED 564 566 564 218 215 215 3 3 3 14 14 13
65 CONNECTIVITY_CHANGE 551 551 551 659 658 657 22 22 22 30 30 29
66 Ljava/lang/Runtime;->exec 330 440 442 66 179 186 70 31 40 38 48 47
67 TelephonyManager;->getSimSerialNumber 245 477 425 62 100 103 132 133 159 17 23 18
68 PACKAGE_REMOVED 406 407 406 284 282 283 10 10 10 34 33 32
69 ClassLoader;->getResourceAsStream 235 446 406 85 139 130 175 182 191 3 15 15
70 Ljava/lang/ProcessBuilder;->< init> 97 417 396 18 108 116 50 97 110 6 24 24
71 AudioManager;->getStreamVolume 117 375 378 43 76 127 17 20 25 20 37 47
72 TelephonyManager;->getCellLocation 136 362 335 3 13 14 25 24 29 15 18 21
73 SMS_RECEIVED 281 282 281 177 177 177 71 71 71 8 8 8
74 PACKAGE_REPLACED 263 263 263 665 664 664 15 15 15 17 18 17
75 ContextWrapper;->openOrCreateDatabase 125 254 253 40 82 82 19 21 22 8 31 30
76 Document;->getDocumentElement 45 214 166 11 108 91 4 4 6 11 32 29
77 Ljava/net/Socket;->getOutputStream 85 171 162 17 106 100 48 7 15 7 11 12
78 Landroid/net/NetworkInfo;->getExtraInfo 49 115 156 1 22 16 90 194 149 8 23 30
79 sqlite/SQLiteDatabase;->openDatabase 75 138 134 27 81 79 2 2 2 5 10 10
80 action.PHONE_STATE 132 133 132 101 101 101 68 68 68 11 11 11
81 TelephonyManager;->getCallState 13 120 122 15 57 53 6 18 6 2 4 4
82 NEW_OUTGOING_CALL 104 105 104 50 50 50 50 51 50 13 13 13
83 Ljava/net/URL;->openStream 16 96 98 5 66 74 0 0 0 4 16 16
84 reflect/Method;->getDeclaringClass 33 94 94 38 165 161 1 1 1 1 1 1
85 Ljava/lang/Process;->getOutputStream 68 80 84 6 10 9 48 7 15 3 3 3
86 Socket;->getInputStream 17 91 78 11 98 92 0 0 0 4 8 9
87 Landroid/net/wifi/WifiManager;->getWifiState 38 71 72 34 65 69 3 5 8 14 20 21
88 SmsManager;->sendTextMessage 22 26 44 0 0 0 1 2 2 0 0 0
89 Ljava/io/DataInputStream;->available 16 37 40 4 12 16 22 7 17 5 10 8
90 ContextWrapper;->openFileOutput 15 35 33 7 28 26 0 0 0 5 6 6
91 ACTION_POWER_CONNECTED 28 28 28 119 117 117 44 44 44 1 1 1
92 TelephonyManager;->isNetworkRoaming 17 26 27 17 36 28 0 0 0 6 9 8
93 PACKAGE_RESTARTED 26 26 26 33 33 33 0 0 0 3 3 3
94 WAP_PUSH_RECEIVED 24 24 24 25 25 26 14 14 14 3 3 3
95 PACKAGE_INSTALL 22 23 23 9 9 9 16 16 16 2 2 2
96 ContextWrapper;->startActivity 6 19 23 2 4 7 0 0 0 1 4 3
97 wifi/WifiManager;->setWifiEnabled 19 9 18 10 8 14 0 1 1 2 2 5
98 SmsManager;->divideMessage 0 3 16 0 0 0 0 0 0 0 0 0
99 Ljava/net/Socket;->isConnected 1 17 11 3 39 49 0 0 0 0 1 1
100 ContextWrapper;->openFileInput 5 7 10 5 7 12 0 0 0 2 2 3
101 ACTION_POWER_DISCONNECTED 9 9 9 152 153 153 0 0 0 1 1 1
102 BATTERY_LOW 7 7 7 20 20 19 0 0 0 1 1 1
103 Landroid/app/Service;->onDestroy 0 17 7 0 0 1 0 0 0 0 23 1
104 Ljava/lang/ProcessBuilder;->command 4 6 6 4 37 39 0 0 0 2 2 2
Table 14A full table of the features and number of apps that logged each feature for each respective test input generation method (Continued)
Dataset2 Dataset1
Malware Benign Malware Benign
API signatures RB SB H RB SB H RB SB H RB SB H
106 PACKAGE_CHANGED 3 3 3 65 65 65 0 0 0 3 3 3
107 BATTERY_OKAY 3 3 3 16 16 16 0 0 0 0 0 0
108 Landroid.content.ContentProviderClient 0 3 3 17 32 37 0 0 0 0 0 0
109 SIG_STR 2 2 2 0 0 0 31 31 31 0 0 0
110 Ljava/lang/Runtime;->exec_Chmod775 0 1 2 0 0 0 4 4 4 0 0 0
111 Landroid/app/Service;->onCreate 6 3 2 6 3 2 3 0 0 0 0 0
112 UMS_DISCONNECTED 1 1 1 2 2 2 184 183 184 0 0 0
113 SIM_FULL 1 1 1 4 4 4 0 0 0 0 0 0
114 SEND_MESSAGE 1 1 1 2 2 2 9 9 9 0 0 0
115 SmsManager;->sendMultipartTextMessage 0 0 1 0 0 0 0 0 0 0 0 0
116 Landroid/content/ServiceConnection 0 2 1 0 0 0 0 0 0 0 0 0
117 fdaccess 0 1 0 0 0 0 0 0 0 0 0 0
118 recvnet 0 1 0 0 0 0 0 0 0 0 0 0
119 init_APIMonitor 0 1 0 0 0 0 0 0 0 0 0 0
120 ContextWrapper;->sendOrderedBroadcast 0 0 0 0 2 2 0 0 0 0 0 0
121 getInstance_APIMonitor 0 1 0 0 0 0 0 0 0 0 0 0
122 SmsManager;->sendDataMessage 0 1 0 0 0 0 0 0 0 0 0 0
Table 15Performance evaluation of the machine learning classifiers trained on Dataset1 using random-based, state-based and hybrid approaches
Classifier PrecM RecM PrecB RecB W-FM
Random-based approach
RF 0.926 0.919 0.927 0.933 0.9267
MLP 0.902 0.902 0.911 0.911 0.9067
SL 0.897 0.899 0.908 0.906 0.9027
SMO 0.88 0.912 0.917 0.887 0.8991
J48 0.89 0.894 0.903 0.9 0.8972
PART 0.884 0.903 0.91 0.893 0.8834
NB 0.81 0.63 0.72 0.866 0.7493
State-based approach
RF 0.953 0.925 0.934 0.959 0.9427
MLP 0.93 0.921 0.929 0.937 0.9292
SMO 0.918 0.923 0.93 0.925 0.9241
J48 0.918 0.905 0.915 0.927 0.9167
PART 0.91 0.916 0.923 0.917 0.9167
SL 0.905 0.918 0.925 0.913 0.9157
NB 0.741 0.843 0.836 0.732 0.7843
Hybrid approach
RF 0.948 0.911 0.922 0.954 0.9337
MLP 0.937 0.911 0.921 0.944 0.9282
SMO 0.921 0.92 0.928 0.928 0.9247
J48 0.92 0.912 0.921 0.928 0.9202
PART 0.902 0.92 0.926 0.909 0.9147
SL 0.912 0.906 0.915 0.92 0.9137
Table 16Performance evaluation of the machine learning classifiers trained on Dataset2 using random-based, state-based and hybrid approaches
Classifier PrecM RecM PrecB RecB W-FM
Random-based approach
RF 0.855 0.835 0.804 0.827 0.8319
PART 0.828 0.805 0.77 0.796 0.8011
J48 0.819 0.79 0.754 0.787 0.7887
MLP 0.825 0.741 0.719 0.809 0.7720
SMO 0.733 0.795 0.721 0.647 0.7265
SL 0.731 0.794 0.719 0.643 0.7241
NB 0.741 0.536 0.577 0.772 0.6391
State-based approach
RF 0.904 0.87 0.848 0.887 0.8774
PART 0.872 0.84 0.813 0.849 0.8447
J48 0.862 0.828 0.8 0.838 0.8333
MLP 0.868 0.814 0.789 0.85 0.8301
SMO 0.866 0.759 0.745 0.856 0.8031
SL 0.847 0.772 0.749 0.83 0.7985
NB 0.744 0.665 0.639 0.721 0.6917
Hybrid approach
RF 0.891 0.864 0.84 0.871 0.8671
PART 0.862 0.835 0.806 0.838 0.8358
J48 0.848 0.825 0.793 0.82 0.8229
MLP 0.842 0.831 0.797 0.81 0.8217
SL 0.837 0.773 0.747 0.816 0.7932
SMO 0.846 0.754 0.735 0.833 0.7898
Acknowledgements Not applicable.
Funding
This work was supported by EPSRC under Grant CSIT-2 EP/N508664/1.
Availability of data and materials
The datasets supporting the conclusions of this article are included within the article (and its additional files)."
Authors’ contributions
We have read the ICMJE guidelines and can confirm that the authors SY, MA, and SS contributed intellectually to the material presented in this manuscript. MA is the corresponding author of the paper. All authors read and approved the final manuscript.
Competing interests
The authors declare that they have no competing interests.
Publisher’s Note
Springer Nature remains neutral with regard to jurisdictional claims in published maps and institutional affiliations.
Author details
1De Montfort University, Leicester, LE1 9BH England, UK.2Centre for Secure
Information Technologies (CSIT), Queen’s University Belfast, Belfast, BT7 1NN Northern Ireland, UK.
Received: 17 April 2018 Accepted: 4 April 2019
References
1. Google Play: number of downloads 2010-2016 | Statistic.https://www. statista.com/statistics/281106/number-of-android-app-downloads-from-google-play/. Accessed Jan 2019
2. Global smartphone shipments by OS 2016-2021 | Statistic.https://www. statista.com/statistics/309448/global-smartphone-shipments-forecast-operating-system/. Accessed Feb 2019
3. McAfee Labs Threats Predictions Report | McAfee Labs.https://www. mcafee.com/uk/resources/reports/rp-quarterly-threats-mar-2016.pdf. Accessed Feb 2019
4. J. Oberheide, C. Miller. Dissecting the Android Bouncer. SummerCon2012, (New York, 2012), p. 110
5. M. Linares-Vàsquez, K. Moran, D. Poshyvanyk, in2017 IEEE International Conference on Software Maintenance and Evolution (ICSME). Continuous, evolutionary and large-scale: A new perspective for automated mobile app testing, (2017), pp. 399–410.https://doi.org/10.1109/ICSME.2017.27 6. S. R. Choudhary, A. Gorla, A. Orso, inIn 2015 30th IEEE/ACM International
Conference on Automated Software Engineering (ASE). Automated test input generation for android: Are we there yet? (IEEE, 2015), pp. 429–440 7. M. K. Alzaylaee, S. Y. Yerima, S. Sezer, in2017 International Conference on
Cyber Security And Protection Of Digital Services (Cyber Security). Improving dynamic analysis of android apps using hybrid test input generation, (2017), pp. 1–8.https://doi.org/10.1109/CyberSecPODS.2017.8074845 8. M. K. Alzaylaee, S. Y. Yerima, S. Sezer, in2016 International Conference On
Cyber Security And Protection Of Digital Services (Cyber Security). Dynalog: an automated dynamic analysis framework for characterizing android applications, (2016), pp. 1–8.https://doi.org/10.1109/CyberSecPODS. 2016.7502337
9. APIMonitor.https://github.com/pjlantz/droidbox/wiki/APIMonitor. Accessed Sept 2018
10. M. K. Alzaylaee, S. Y. Yerima, S. Sezer, inProceedings of the 3rd ACM on International Workshop on Security And Privacy Analytics. IWSPA ’17. Emulator vs real phone: Android malware detection using machine learning (ACM, Scottsdale, 2017), pp. 65–72.https://doi.org/10.1145/ 3041008.3041010.http://doi.acm.org/10.1145/3041008.3041010 11. T. Bläsing, L. Batyuk, A. D. Schmidt, S. A. Camtepe, S. Albayrak, in2010 5th
International Conference on Malicious and Unwanted Software. An android application sandbox system for suspicious software detection, (2010), pp. 55–62.https://doi.org/10.1109/MALWARE.2010.5665792 12. T. Eder, M. Rodler, D. Vymazal, M. Zeilinger, in2013 International
Conference on Availability, Reliability and Security. Ananas - a framework for
analyzing android applications, (2013), pp. 711–719.https://doi.org/10. 1109/ARES.2013.93
13. M. Spreitzenbarth, F. Freiling, F. Echtler, T. Schreck, J. Hoffmann, in
Proceedings of the 28th Annual ACM Symposium on Applied Computing. SAC ’13. Mobile-sandbox: having a deeper look into android applications (ACM, New York, 2013), pp. 1808–1815.https://doi.org/10.1145/2480362. 2480701
14. Y. Zhang, M. Yang, B. Xu, Z. Yang, G. Gu, P. Ning, X. S. Wang, B. Zang, in
Proceedings of the 2013 ACM SIGSAC Conference on Computer; Communications Security. CCS ’13. Vetting undesirable behaviors in android apps with permission use analysis (ACM, New York, 2013), pp. 611–622.https://doi.org/10.1145/2508859.2516689
15. UI/Application Exerciser Monkey (2017).https://developer.android.com/ studio/test/monkey.html. Accessed Sept 2018
16. D. Amalfitano, A. R. Fasolino, P. Tramontana, S. De Carmine, A. M. Memon, inProceedings of the 27th IEEE/ACM International Conference on Automated Software Engineering. ASE 2012. Using GUI ripping for automated testing of android applications (ACM, New York, 2012), pp. 258–261.https://doi. org/10.1145/2351676.2351717
17. W. Yang, M. R. Prasad, T. Xie, inFundamentalApproaches to Software Engineering. FASE 2013. LectureNotesinComputer Science, Vol. 7793, ed. by Cortellessa V., Varró D. A grey-box approach for automated GUI-model generation of mobile applications (Springer, Berlin, 2013), pp. 250–265 18. T. Azim, I. Neamtiu, Targeted and depth-first exploration for systematic
testing of android apps. SIGPLAN Not.48(10), 641–660 (2013).https://doi. org/10.1145/2544173.2509549
19. W. Choi, G. Necula, K. Sen, inProceedings of the 2013 ACM SIGPLAN international conference on Object oriented programming systems languages & applications (OOPSLA ’13). Guided GUI testing of android apps with minimal restart and approximate learning, vol. 48 (ACM, New York, 2013), pp. 623–640.https://doi.org/10.1145/2509136.2509552
20. S. Hao, B. Liu, S. Nath, W. G. Halfond, R. Govindan, inProceedings of the 12th Annual International Conference on Mobile Systems, Applications, and Services (MobiSys ’14). Puma: Programmable UI-automation for large-scale dynamic analysis of mobile apps (ACM, New York, 2014), pp. 204–217. https://doi.org/10.1145/2594368.2594390.http://doi.acm.org/10.1145/ 2594368.2594390
21. Y. Li, Z. Yang, Y. Guo, X. Chen, in2017 IEEE/ACM 39th International Conference on Software Engineering Companion (ICSE-C). Droidbot: a lightweight UI-guided test input generator for android, (2017), pp. 23–26. https://doi.org/10.1109/ICSE-C.2017.8
22. Z. Yajin, J. Xuxian, Android Malware Genome Project.http://www. malgenomeproject.org/. Accessed Sept 2018
23. L. Santoku.https://santoku-linux.com/. Accessed July 2018
24. D. Arp, M. Spreitzenbarth, H. Malte, H. Gascon, K. Rieck, Drebin: effective and explainable detection of Android malware in your pocket. Symposium on Network and Distributed System Security (NDSS) (February), 23–26 (2014).https://doi.org/10.14722/ndss.2014.23247 25. Y. Aafer, W. Du, H. Yin, DroidAPIMiner: mining API-level features for robust malware
detection in Android. Security and Privacy in Communication Networks. 127, 86–103 (2013).https://doi.org/10.1007/978-3-319-04283-1_6 26. S. Y. Yerima, S. Sezer, I. Muttik, inScience and Information Conference (SAI),
2015. Android malware detection: an eigenspace analysis approach (IEEE, London, 2015), pp. 1236–1242.https://doi.org/10.1109/SAI.2015.7237302 27. M. Fan, J. Liu, W. Wang, H. Li, Z. Tian, T. Liu, Dapasa: detecting android
piggybacked apps through sensitive subgraph analysis. IEEE Trans. Inf. Forensics Secur.12(8), 1772–1785 (2017).https://doi.org/10.1109/TIFS. 2017.2687880
28. S. Y. Yerima, S. Sezer, I. Muttik, High accuracy android malware detection using ensemble learning. IET Inf. Secur.9(6), 313–320 (2015).https://doi. org/10.1049/iet-ifs.2014.0099
29. B. Kang, S. Y. Yerima, S. Sezer, K. McLaughlin, N-gram opcode analysis for android malware detection. CoRR.abs/1612.01445(2016).1612.01445 30. L. Cen, C. S. Gates, L. Si, N. Li, A probabilistic discriminative model for
android malware detection with decompiled source code. IEEE Trans. Dependable Secure Comput.12(4), 400–412 (2015).https://doi.org/10. 1109/TDSC.2014.2355839
![Fig. 2 Simplified state transition model example [21]](https://thumb-us.123doks.com/thumbv2/123dok_us/874126.1584919/4.595.60.542.85.340/fig-simplified-state-transition-model-example.webp)
![Fig. 3 Checking and restoring device configurations on the hybrid input generation system comprising both random and state-based subsystems [7]](https://thumb-us.123doks.com/thumbv2/123dok_us/874126.1584919/5.595.56.540.85.377/checking-restoring-device-configurations-hybrid-generation-comprising-subsystems.webp)