103
A Study on Microgel System as a
Template for Dispersion and
Separation of Chiral Tartaric Acid
Azwan Mat Lazim*, Aishah Hasbullah, Siti Fairus M. Yusoff, Mellissa Andarini School of Chemical Sciences and Food Technology, National University of Malaysia
(UKM) 43600 Bangi, Selangor
*Corresponding email: [email protected]
Abstract
Separation of tartaric acid enantiomers in organic compounds using conventional techniques requires high energy demand, high chemicals consumption, lengthy, complicated and expensive processes. This research demonstrates utilization of PNIPAM microgel system as a template for incorporation of chiral D- and L- tartaric acids (TA). The poly(n-isopropylacrylamide) (PNIPAM) microgel was synthesized using surfactant free emulsion polymerization (SFEP) and was characterized using standard procedures. The combination of 1.4×10⁻³ g/ml microgel with 3.02×10⁻⁴ g/ml TA gave the most stable system. Subsequently, a two-phase system was obtained after centrifugation. Both phases were subjected to dynamic light scattering (DLS) analysis and the corresponding separated systems gave particle sizes ranging from 80-90 nm for the upper phase, and 1200-1500 nm for the lower phase. Scanning electron micrographs showed the presence of agglomeration in the lower phase, supporting the DLS results. Nuclear magnetic resonance (1H NMR) analysis confirmed the presence of TA indicated by a peak at δ = 13.1 ppm. Based on these findings, the system can be a potential alternative template for TA racemix acid dispersion and separation.
1. INTRODUCTION
Chiral compounds (CC) are an important category of molecules in pharmaceuticals [1]. However these compounds are usually exist in racemix mixtures, in which one of the enantiomer has good biological activity and the other will not have the same ability. Therefore the separation of pure enantiomer into distinguish compounds has been the subject of increasing attention.
Up to now, the techniques employed for chiral separation mainly involved chromatography such as HPLC [2], GC [3], micellar MEKC and capillary gel electrophoresis (CGE) [4]. Although these techniques offer promising approaches, there are still drawbacks such as the separation process which is challenging, resulting hard to predict elution order of enantiomers and poor selectivity for enantiomers. Obviously, these techniques are time consuming and expend solvent. Therefore, it is desirable to analyse alternative, of a more efficient methods.
Of relevance to this work are salt-induced separation [2], surfactant- protein complexes separation [3] and membrane separation [4] which are prepared in microemulsion systems. Although microemulsions offer good supporting systems, however these systems are complicated and difficult to maintain their stability [5]. Attempts were also made using molecularly imprinted polymers (MIPs) where it has been developed and used for the separation of racemates due to their high selectivity [6]. Yet, interactions between MIPs functional monomers and template would lead to aggregation. This instability becomes the limitation factor for the applicability of MIPs. Recently, by controlling microgel properties, simple phase separation has elegantly been demonstrated by Lazimet. al [7,8]. The authors have shown microgel systems could be manipulated as a template for supporting material, phase separation and recovery
By virtue of the polymer chemistry aqueous microgels can possess different charges (anionic or cationic) in one medium which leads to important properties. Interestingly, these responsive polymers can be formulated from single components, or synthesized as polyampholytes. There are no literature found describing microgels with potential to incorporate with CC or used these smart polymers for separation and recovery purposes.
105
2. EXPERIMENTAL SECTION
2.1 Materials
All reagents unless otherwise stated, were purchased from Aldrich Ltd.
2.2 Analysis Technique
For all samples, pH was measured by using a dip-cell pH meter (HI98127, pHep Hanna).
2.3 Microgel Preparation
Microgel was synthesized using the following reagents and quantities [9,10]. In a reaction flask, 800 mL of purified water (PureLab, Elga) was added to 0.51 g of potassium persulfate initiator. Separately, 5.0 g of NIPAM and 0.51 g of cross-linking agent N,N-methylenebisacrylamide (BA) were dissolved in 200 mL of purified water (mili-Q). The dissolved reagents were added to the reaction flask and the polymerization reaction was set at 70 oC under an inert atmosphere. The polymerization reaction was left to proceed for 6 hours with continuous stirring (~150 rpm). The outcome of the dispersion was filtered through glass wool
2.4 Dynamic Light Scattering
Hydrodynamic diameters were determined by dynamic light scattering (DLS) using a Malvern Instruments Zeta Nano Series, Nano S90 apparatus, equipped with a 15 mW laser (λ = 678 nm). Electrophoretic mobility measurements on the microgel particles were performed by phase analysis light scattering (PALS) using a Malvern Instruments Nano Z mobility apparatus.Sample for analysis contained a microgel concentration with dilution factor of 10.
2.6 Transmission Electron Microscopy (TEM)
3. RESULTS AND DISCUSSIONS
3.1 Microgel Stability
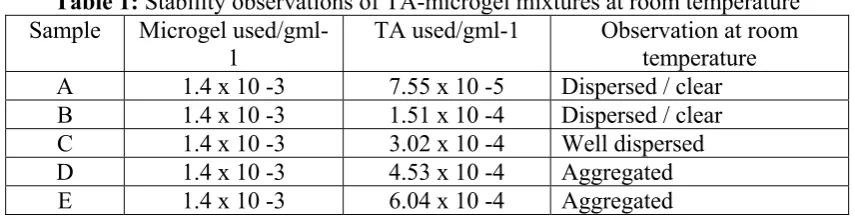
Aggregation behavior for each complex sample is possibly influenced by the increasing of ionic strength due the pH adjustments, as described in detail by Snowden et. al. [11]. Based on that approach TA-microgels samples were prepared with varying concentrations, dispersion compositions, and mixed microgel ratios. Hence a large matrix of samples was screened, varying all composition parameters over certain appropriate ranges. Results obtain from the screening test are very important in order to build a model for further applications whereby the L/D acid tartaric will be used.
In this section five most significant samples from that array were discussed (Table 1) in comparison between results obtained from the samples prepared by author (A-E) and previously reported [11, 12] All samples were examined based on their aggregation as a function of pH at different mass concentration microgels used. The physical state of all samples was determined visually at room temperature.
Table 1: Stability observations of TA-microgel mixtures at room temperature Sample Microgel
used/gml-1
TA used/gml-1 Observation at room temperature A 1.4 x 10 -3 7.55 x 10 -5 Dispersed / clear B 1.4 x 10 -3 1.51 x 10 -4 Dispersed / clear C 1.4 x 10 -3 3.02 x 10 -4 Well dispersed D 1.4 x 10 -3 4.53 x 10 -4 Aggregated E 1.4 x 10 -3 6.04 x 10 -4 Aggregated
107
3.2 Particle Size
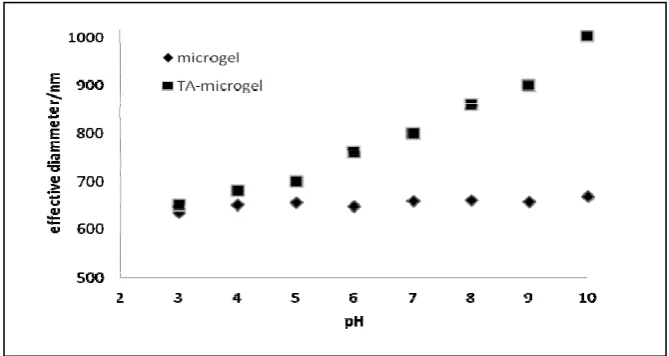
Figure 1 shows the dependence of effective diameter of microgels at different pH as a reference. Due to its insensitivity to pH, the size of the microgel is consistent over the pH range of 3 to 10. This result is significant as reported previously [12]. On contrary, the TA- microgels complexes at pH 3-10 shows opposite trends where their effective diameter rose with pH increment. As a result of adding NaOH for pH adjustment, consequently leads to the TA protonation [13]. Under these conditions the carboxylate groups within the microgel particles are dissociated [12-14]. Therefore the increment of carboxylate (COO-) charged groups raise the hydrophobic interactions which caused the microgel swelling through electrostatic repulsion between these negatively charged [15].
Figure 1: Effective diameter of microgel systems and TA-microgels in a function of pH
3.3 Separation
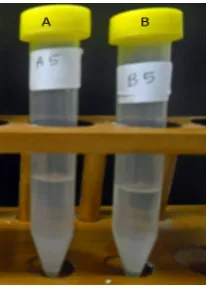
Figure 2: Biphasic systems of TA-microgel mixtures where A is (D- tartaric acid) and B is (L-tartaric acid) after the centrifuge
Table 2: Particle sizes for upper phase and lower phase for racemic TA-microgels (D and L) at pH 3 and pH 10
Sample pH 3 pH 10 Upper phase
D-tartaric acid microgel L-tartaric acid microgel
80 nm 85 nm
90 nm 93 nm Lower phase
D-tartaric acid microgel L-tartaric acid microgel
1350 nm 1200 nm
1500 nm 1420 nm
109
3.4 SEM Image
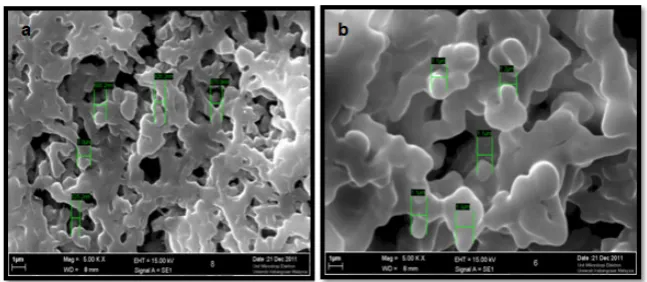
Figure 3: SEM image for lower phase of TA-microgel after the centrifuge process where a) D-tartaric acid microgels and b) L- tartaric acid microgels
The high resolution image of the TA-microgel complex shown in Figure 3 verifies the aggregation occurred between the tartaric acid and microgels. The average diameter is 900-100 nm, which is in agreement with DLS data reported in the previous section. The existence of large agglomeration was also observed, possibly an artefact from the interaction of Na+/COO- with the microgel systems [18]. The Na+ as co-ion increased due to the pH adjustments. Therefore their existence is considered as one of the inducing factor for interparticle aggregation whereby the COO- group acts as a ‘sticker’ in the complexation [19]. Moreover, it becomes more pronounced with increasing of ionic strength. A similar qualitative study was reported by Daly and Saunders [19] the particles were collapsed and flocculated at a higher ionic strength due to absence of electrostatic stabilization.
3.5 NMR Spectroscopy Analysis
4. CONCLUSION
These microgel systems have successfully incorporated with both chiral D- and L- tartaric acid. A combination of microgels 1.4 x 10 -3 g/ml and tartaric acid 3.02 x 10⁻⁴ g/ml exhibited as the most stable system. Further optimization and characterizations were made, where two phase systems were obtained after the centrifugation. The dynamic light scattering (DLS) showed the lower phase has bigger sizes due to the settlement of microgels colloid. In comparison, the range of particle sizes of the upper phase was very small (80-90 nm) confirmed that most of TA-microgels settled to the bottom phase. These results were supported by the SEM micrographs which clearly shown agglomeration occurred. Based on these promising results, these systems are potentially useful as a template for complex racemix dispersion and separation.
REFERENCES
[1] Reetz, M.T., Carsten, J. Ruggerberg, Melloney, J. Droge, & Wim, J. Quax. (2002); “Immobilization of chiral enzyme inhibitors on solid supports by amide-forming coupling and olefin metathesis”, Tetrahedron. pp 8465-8473. [2] Lindner, w. (1995); “A practical approach to chiral separations by liquid
chromatography”, J. Chromatogr, Vol. 718, Issue 2, pp 459-461.
[3] Gyllenhaal, O., & Anders Karlsson. (2002); “Enantiomeric separations of amino alcohols by packed-column SFC on Hypercarb with l-(+)-tartaric acid as chiral selector”, Journal of Biochemical and Biophysical Methods, Vol.54, Issue 1-3, pp 169-185.
[4] Tang, Kawen, Jianmin Yi, Yong bing Liu, Xinyu Jiang, & Yang Pan. (2009); “Enantioselective separation of R,S- phenylsuccinic acid by biphasic recognition chiral extraction”, Chemical enginering science, Vol. 64, pp 4081-4088.
[5] Myakonkaya, O., & Eastoe, J. (2009); “ Low energy methods of phase separation in colloidal dispersion and microemulsions”, J adv Colloid Interface Sci, Vol. 149, pp 39-46.
111
[7] Lazim, A., Bradley M., & Eastoe J. (2011); “Stimulus Responsive Heteroagrgregation of colloidal dispersion : Reversible system and composite material”, Polymer, Issue 3, pp 1036-1050.
[8] Lazim, A. (2010); “Application of responsive microgels for separation and recovery”. Unpublished phD dissertation. University of Bristol.
[9] Saunders, B. R., & Brian V. (1999); “Microgel particles as model colloids: theory, properties and applications”, Advances in Colloid and Interface Science, Vol. 80, Issue 1, pp 1-25.
[10] Baker, W. O. (1949); “Microgel, A New Macromolecule”, Ind. Eng. Chem. Vol. 41, pp 511.
[11] Snowden, M. J., Gracia, L., & Cosgrove, T. (2008); “The Structural Elucidation of Poly (N-isopropylacrylamide/butyl acrylate) Microgel A Small-angle Neutron Scattering Study”, Langmuir. Vol. 41, Issue 19, pp 7133-7137.
[12] Lazim, A., Julian, E., & Melanie, B. (2012); “Incorporation of gold nanoparticles into pH responsive mixed microgel systems”, Mediterranean Journal of Chemistry, Vol. 1, No. 5, pp 259-272.
[13] Lazim, A.M, Eastoe, J., Bradley, M., Trickett, K., Mohamed, A., & Rogers, S.E.(2010); “Recovery of gold nanoparticles using pH-sensitive microgels. Soft Matter”, Issue 6, pp 2050-2055.
[14] Hui, D., Nawaz M., Morris DP., Edwards M.R., & Saunders B.R. (2008); “Study of pH triggered heteroaggregation and gel formation within mixed dispersions”, J. Colloid Interface Sci, Vol. 324, pp 110-117.
[15] Warren, N. (2005); “Interaction of photodegradable surfactant with poly(2-vinyl prirdine) microgels particles”, Unpublished Thesis Honours of Msci. Unversity of Bristol.
[16] Olle, G., & Karlsson, A. (2002); “ Enantiomeric separation of amino alcohols by packed coloumn SFC on hypercrab with L(+)- tartaric acid as chiral selector”, Jornal of biochemical and biophysical methods, Vol.54, pp 169-185.
[18] Hoare, T., & Pelton, R. (2007); “Functionalized Microgel Swelling:Ԝ
Comparing Theory and Experiment. of physical chemistry B 111”, Vol. 41, pp 11895-11906.