Vol. 7, No. 2, December 2013 • ISSN : 1823-6782
ASM
Science Journal
7(2) 2013
RESEARCH ARTICLES
Distribution of Disease and Pest Resistance Markers in Malaysian Rice Varieties 105 W. Wilonita, R. Nurliyana, D.D. Asma, M. Noorazizah and M.Y. Hirzun
A Review on Materials Waste Quantification and Management in
Construction Activities 113
C.H. Asmawati, M.R. Ahmad Ruslan, Y. Zulkiflee and M.N.N. Husna
Photoinhibition and Development of Stress Proteins in Macroalgae
Irradiated with Ultraviolet Radiation 118
A.Z. Hazlina, K. Bischof and D. Hanelt
Risk Assessment for Living Modified Organisms 129
S.L. Tan
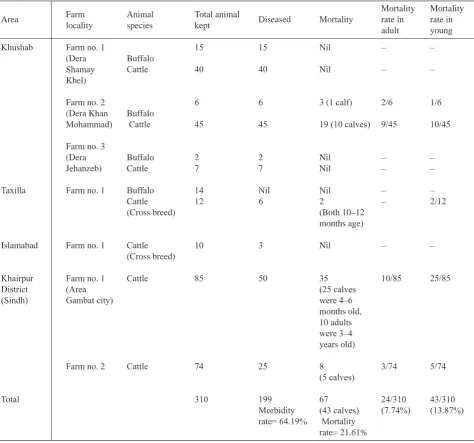
Mortality Rate in Association with Foot and Mouth Disease Outbreaks in
Cattle and Buffaloes, Pakistan 139
M. Abubakar, E. Khan, M.J. Arshed, M. Hussain, Q. Ali and M. Afzal
Modeling and Simulation of Artificial Hair Cell Sensor for
Underwater Applications 144
M.N.M. Nawi, A.A. Manaf and M.R. Arshad
Systems Perspectives in Agricultural Education, Research and Development:
A Vision for Sustaining Food Security in Asia 152
C. Devendra
Contents
ASM Sc. J. Volume 7(2), 2013
intro.indd 1
•
Ahmed Zewail (Nobel Laureate)
Richard R. Ernst (Nobel Laureate)
Lee Yuan Tseh (Nobel Laureate)
John Sheppard Mackenzie
M.S. Swaminathan
EDITORIAL BOARD
Editor-in-Chief/Chairman: Md. Ikram Mohd Said
Abdul Latiff Mohamad
Chia Swee Ping
Ibrahim Komoo
Lam Sai Kit
Lee Chnoong Kheng
Looi Lai Meng
Mashkuri Yaacob
Mazlan Othman
Mohd Ali Hashim
Francis Ng
Radin Umar Radin Sohadi
of our understanding of the natural world and continuing to deliver technologies that impact almost every aspect of our lives. In this issue in an article entitled Global Trends in Chemistry Research
and the Challenge for Malaysian Scientists: A Perspective Review (pp. 173−220), the author takes
the reader into the challenging new frontiers of chemistry research that will be worked globally
over the next few decades, offering just the right level of detail for the uninitiated to follow the
increasingly interdisciplinary trend of the topics being worked. Researchers across the spectrum of academia and industry as much as research grant committees will find the article a welcome read that gives a comprehensive coverage of key research in contemporary areas like energy, catalysis
and chemical synthesis, materials science and biological chemistry. Value addition to the article has also come in the way of recommendations towards forging strong research collaborations between the universities, public research institutes and the industry which are seen as vital in providing cross-cutting chemical solutions throughout the value chains and to the success of technologies
identified as critical to the nation.
The cover of this issue shows three figures in the hexagons taken from the above review article: The uppermost figures—on the right (section of Figure 3, pp. 178) depicts the PCBM acceptor
molecule; and on the left (Figure 12, pp. 198) molybdenum disulphide structures of 2D material.
The image (Figure 13, pp. 204) in the lower-left section of the cover shows optical images of
polyethylene glycol scaffolds expanding in response to stretching—result of research by scientists from the University of California (San Diego) in the discovery of a new biomaterial which closely
mimics human tissue.
Three examples of sea cucumbers from the genus Stichopus which look very similar in their outer
morphology is shown in the centre of the cover—pictured (Figure 1, pp. 168) in an article where
researchers from the Marine Science Laboratory, School of Biological Sciences, Universiti Sains Malaysia concluded that management and conservation of marine organisms was not possible
without the ability to identify and classify them taxonomically.
In Pursuit of E xcellence in Scienc
e
Vol. 7, No. 2, December 2013 • ISSN :
1823-6782
© Academy of Sciences Malaysia
All rights reserved. No part of this publication may be reproduced in any form or by any
means without permission in writing from the Academy of Sciences Malaysia.
The Editorial Board, in accepting contributions for publications, accepts no responsibility
for the views expressed by authors.
ASM Science Journal is listed and indexed in Scopus.
The Academy of Sciences
Malaysia (ASM)
The Academy of Sciences Malaysia (ASM) was established, under the Academy of Sciences Act 1994 which came into force on 1 February 1995, with the ultimate aim to pursue excellence in science. Thus the mission enshrined is to pursue, encourage and enhance excellence in the field of science, engineering and technology for the development of the nation and the benefit of mankind.
The functions of the Academy are as follows:
•
To promote and foster the development of science, engineering and technology•
To provide a forum for the interchange of ideas among scientists, engineers and technologists•
To promote national awareness, understanding andappreciation of the role of science, engineering and technology in human progress
•
To promote creativity among scientists, engineers and technologists•
To promote national self-reliance in the field of science, engineering and technology•
To act as a forum for maintaining awareness on the part of the Government of the significance of the role of science, engineering and technology in the development process of the nation and for bringing national development needs to the attention of the scientists, engineers and technologists•
To analyse particular national problems and identify where science, engineering and technology can contribute to their solution and accordingly to make recommendations to the Government•
To keep in touch with developments in science,engineering and technology and identify those developments which are relevant to national needs to bring such developments to the attention of the Government
•
To prepare reports, papers or other documents relating to the national science, engineering and technology policy and make the necessary recommendations to the Government•
To initiate and sponsor multi-disciplinary studies related to and necessary for the better understanding of the social and economic implications of science, engineering and technology•
To encourage research and development and education and training of the appropriate scientific, engineering and technical man power•
To establish and maintain relations between the Academy and overseas bodies having the same or almost similar objectives in science, engineering and technology as the Academy•
To advise on matters related to science, engineering and technology as may be requested by the Government from time to time; and•
To carry out such other actions that are consistent with the 1994 Academy of Sciences Act as may be required in order to facilitate the advancement of science, engineering and technology in Malaysia, and the well being and status of the Academy.The Academy is governed by a Council. Various Working Committees and Task Forces are charged with developing strategies, plans and programmes in line with the Academy’s objectives and functions.
The functions of the Council are:
•
To formulate policy relating to the functions of the Academy•
To administer the affairs of the Academy•
To appoint such officers or servants of the Academy as are necessary for the due administration of the Academy•
To supervise and control its officers and servants•
To administer the Fund; and•
To convene general meetings of the Academy to decide on matters which under this Act are required to be decided by the Academy.The Academy has Fellows and Honorary Fellows. The Fellows comprise Foundation Fellows and Elected Fellows. The Academy Fellows are selected from the ranks of eminent Malaysian scientists, engineers and technocrats in the fields of medical sciences, engineering sciences, biological sciences, mathematical and physical sciences, chemical sciences, information technology and science and technology development and industry. The Future
Creativity and innovation are recognised the world over as the key measure of the competitiveness of a nation. Within the context of K-Economy and the framework of National Innovation System (NIS), ASM will continue to spearhead efforts that will take innovation and creativity to new heights in the fields of sciences, engineering and technology and work towards making Malaysia an intellectual force to be reckoned with.
intro.indd 1
RESEARCH ARTICLES
Distribution of Disease and Pest Resistance Markers in Malaysian Rice Varieties 105 W. Wilonita, R. Nurliyana, D.D. Asma, M. Noorazizah and M.Y. Hirzun
A Review on Materials Waste Quantification and Management in
Construction Activities 113
C.H. Asmawati, M.R. Ahmad Ruslan, Y. Zulkiflee and M.N.N. Husna
Photoinhibition and Development of Stress Proteins in Macroalgae
Irradiated with Ultraviolet Radiation 118
A.Z. Hazlina, K. Bischof and D. Hanelt
Risk Assessment for Living Modified Organisms 129 S.L. Tan
Mortality Rate in Association with Foot and Mouth Disease Outbreaks in
Cattle and Buffaloes, Pakistan 139
M. Abubakar, E. Khan, M.J. Arshed, M. Hussain, Q. Ali and M. Afzal
Modeling and Simulation of Artificial Hair Cell Sensor for
Underwater Applications 144
M.N.M. Nawi, A.A. Manaf and M.R. Arshad
Systems Perspectives in Agricultural Education, Research and Development:
A Vision for Sustaining Food Security in Asia 152
C. Devendra
Taxonomy and Conservation: Overfishing of Sea Cucumber in
the Straits of Malacca 167
S.P. Woo, I.H. Siti, Y. Zulfigar and S.H. Tan
SPECIAL SCIENCE REVIEW
Global Trends in Chemistry Research and the Challenge for Malaysian Scientists:
A Perspective Review 173
V.G. Kumar Das
COMMENTARY
Patenting of Genes 221
Rice (Oryza sativa L.) is the staple food to more than half of the world’s population and is produced and consumed particularly in Asia (Chakravarthi & Naravaneni 2006). The projected increase in global population to nine billion by 2050 and predicted increase in water scarcity and decrease in arable land, the constant battle against new emerging pathogens and pests, and possible adverse effects from climate change present great challenges for rice breeders and agricultural scientists. Although the Malaysian elite variety, MR219, has been cultivated in Malaysia for many years, FAO warns of increasing constraints and issues including brown plant hopper (BPH), stem borers, blast, rice tungro virus, sheath blight and other abiotic and biotic stresses.
Marker-assisted selection (MAS) can be a useful tool for expediting the rice breeding programme which aims to overcome all these challenges. MAS refers to the use of DNA based markers, such as SSR, that are tightly linked to target loci as a substitute or to aid phenotypic screening. Determination of the allele of the DNA marker, allows identification of plants that possess particular genes or quantitative traits loci in terms of their genotype rather than their phenotype (Mackill 2007).
The wild rice species are valuable resources of genes for resistance against major diseases and insects and have been used widely as donor strains (He 2007). According to Gowda et al. (2003), four hundred and fifty genes have been identified in rice genomes that are related to abiotic stresses, quality traits as well as pest and disease resistance. BPH, Nilaparvata lugens, is one of the most serious insect pests throughout the rice growing areas in Asia. BPH causes direct damage to crops and indirect damage by acting as a vector for viral diseases. Normal practice for controlling these pests are by chemical treatment that is expensive and harmful to the environment (Kim & Sohn 2005). Jena and Kim (2010) have reported that host plant resistance is the most effective way of controlling pests including BPH. To date, researchers have discovered up to twenty-one BPH genes (Jena & Kim 2010) related to rice brown planthopper resistance.
A common disease affecting rice production in Asia is bacterial leaf blight (BLB), which is caused by the rod- shaped bacterium, Xanthomonas oryzae. This disease has taken on new importance since the introduction and widespread cultivation of high yielding but susceptible rice varieties, and is especially prevalent in irrigated and rainfed
Distribution of Disease and Pest Resistance Markers
in Malaysian Rice Varieties
W. Wilonita1, R. Nurliyana1, D.D. Asma1, M. Noorazizah1 and M.Y. Hirzun1*
Molecular markers have been intensively used in assisting breeding to reduce the time taken by conventional breeding as well as helping introgression of specific traits. Baseline analysis of known markers is crucial in developing a genetic database on disease and pest resistance for local rice germplasm which does not yet exist. In this study seven local rice varieties, including the popular MR219 and MRQ 74 and MRQ 76 (newly developed aromatic rice varieties), together with a foreign variety, Intani-2, were screened for genetic markers related to pest and disease resistance. One hundred and twenty-two type-related markers (SSR, STS, InDel and Allele-specific) for genes resistant to bacterial leaf blight, blast and brown planthopper were screened using PCR amplification and validated by sequencing. It was found that each variety had its own pattern of resistance. Using allele-specific markers namely pBPH9, pTA248 and Pisbdom were found to be the most efficient way to screen for the targeted genes. Of the seven varieties, MR219 and MR232 were found to have the highest distribution of markers for resistance genes against pest and diseases studied..
Key words: Simple sequence repeat; resistance gene; Bph1; Magnaporthe grisea; MR 219; MR232; breeding; genetic database; MRQ 74; MRQ 76; bacterial leaf blight; brown planthopper; allele-specific markers;
1Sime Darby Technology Centre Sdn Bhd 1st Floor, Block B, UPM-MTDC Technology Centre III, Lebuh Silikon, Universiti Putra Malaysia, 43400, Serdang, Selangor.
lowland areas (Davierwala et al. 2001). MAS molecular breeding is important to develop resistant varieties. So far, thirty genes including Xa21, Xa2, Xa13, and Xa27 have been identified to be related to bacterial leaf blight resistance. Most established markers (e.g. RM122, RM13, and RM224) which specifically detect one or more BLB resistance genes are available online (<www.gramene. com>).
Rice blast is one of the most important diseases of rice crops worldwide. It is caused by the fungus, Magnaporthe grisea which can attack the aerial parts of the rice plant at any stage of growth (Babujee & Gnanamanickam 2000). Controlling rice blast by planting rice varieties that are resistant is both most practical and economical. Forty genes have been discovered to be related to blast resistance in rice. Some of the genes which can be detected by established markers (e.g. RG64) are Pi-2, Pi- 40, and Pi-ta. In this research, we studied the pest and disease genotypes as well as marker distribution for eight of the rice varieties. All eight were screened with one hundred and twenty two public domain markers related to resistance genes against brown plant hopper, blast and bacterial leaf blight. Study scopes include detecting gene presence using various types of markers, analysis, validation, and development of a basic genetic database for our local varieties.
MATERIALS AND METHODS
Seeds and Varieties
Most of the indica rice varieties showed higher expression level compared to japonica species, hence widely used as control varieties. In this study, we used indica varieties namely IR 36 that showed durable resistance towards blast,
Pi-ta gene and IR24 that resistance to blast Pi-20 gene. Both Nipponbare and CO39 were used as negative control as both are highly susceptible to Bph1 gene and blast, respectively. Besides, through MAS technology several genes had been successfully pyramided, bacterial blight resistance (Zhang 2007) and were also used as control, e.g. IRBB 61 (Xa4+xa5+Xa7), IRBB 54 (xa5+Xa21), IRBB 66 (Xa4+xa5+Xa7+xa13+Xa21). All the seeds of control varieties were provided by IRRI while seeds of the tested varieties MR219, MR220, MR211, MR232, MRQ76, MRQ74, and MRQ50 together with a foreign variety Intani-2 were provided by MARDI Genebank, Seberang Perai, Pulau Pinang.
Sampling and DNA Preparation
Seeds of all tested varieties including the controls were planted in a greenhouse. Three to four fresh young leaves were collected when the plants were fifteen to twenty one days old. DNA extraction and purification were conducted using the CTAB (hexadecyl trimethyl ammonium bromide)
method. DNA pellets were collected and dissolved using TE (Tris Cl and EDTA) buffer. The concentration and molecular weight of DNA were checked by spectrophotometer and agarose gel electrophoresis, respectively. Extracts were stored at –20ºC until further analysis.
Analysis of Samples
One hundred and twenty-two markers related to pest and diseases (BPH, BLB, and Blast) resistance were screened on the seven local varieties. The PCR component was prepared using 1X PCR buffer, 2.5 mM of MgCl2, 0.5 mM of both forward and reverse primers, 0.2 mM of dNTPs and 2U of Taq polymerase along with 100 ng/µl of genomic DNA. The PCR amplification programme consisted of an initial denaturation of 5 min at 94ºC followed by 35 cycles of the polymerization reaction, consisting of denaturation for 30 s at 94ºC, annealing for 30 s at 55ºC and an extension step for 2 minutes at 72ºC. A final extension was programmed for 5 min to 10 min at 72ºC for the various markers. The PCR products were resolved on 1.8%–2.0 % of agarose gels in 1X TAE buffer, stained with GelRed to detect the amplicons.
Sequencing and Data analysis
The PCR products was ligated and cloned into competent cell containing plasmid (pGEM-T Easy Vector from Promega Corporation, Madison) after which the plasmid was extracted and sequenced. Sequencing data were analyzed using NCBI’s BLAST (<http://blast.ncbi.nlm.nih. gov/Blast.cgi>) and GRAMENE BLAST (<http://www. gramene.org/multi/blastview>) for confirmation.
RESULTS AND DISCUSSION
Screening with Brown Planthopper Markers
Out of the twenty-one BPH resistance genes, eighteen have been mapped on specific regions of different chromosomes (Jena & Kim 2010). Chromosome 12 of rice is a very important chromosome because of the abundance of genes clustered along its short and long arms: Bph1, bph2, Bph9, Bph10, Bph18 (t) and Bph21(t) (Brar et al. 2008). A total
of thirty public domain markers including SSR (Jirapong
et al. 2007), RFLP, STS co-segregated, and CAPS markers (Murai et al. 2001), that are related to brown plant hopper resistance genes were screened for and validated on all seven local varieties tested. Out of the thirty markers screened, only twenty were amplifiable for these local varieties.
Korean varieties. The pBPH9 had been used in screening and from the result, MR219, MR211, MR220, and MR232 showed a resistant band of approximately 536 bp while a susceptible band was present at 773 bp for the other varieties tested including Nipponbare (susceptible to Bph1, control variety), (Figure 1A). Further analysis on MR232 and IR36 (control variety) found to be 95.34% similar with Oryza sativa japonica species, chromosome 12 with complete sequences at the AL935070 locus. The sequence length of MR232 and IR36 were detected at 535bp hence pBPH9 STS co-segregated marker was validated and it could be used in screening of local varieties.
The STS-marker, BpE18-3 yielded a polymorphic banding pattern when tested and only aromatic varieties, the MRQ76 and MRQ50 showed the expected size, approximately 536 bp (Figure 1B). BLAST analysis of the MRQ50 fragment of this marker showed a 91% similarity with Oryza sativa japonica species, chromosome 12, BAC OJ1112_F01 of variety Nipponbare of spp. Japonica and the complete sequence is located at the locus AL732381 with sequence length at 518 bp. The marker could be used for screening of the local rice even though it was developed based on the Japonica rice. The Bph1 gene was also mapped at a distance of 3.9cM from the said marker. Both pBPH9 and BpE18-3 markers tested here showed different banding patterns that might cause by various sources of donors and different pedigree background of each variety. The BpE18-3 band depends on the resistance source which in all the cultivars detected TKM6 as the resistance source (Kim & Sohn 2005) in comparing to pBPH9 marker that will only amplify a fragment in varieties harbouring the Bph1 gene from such sources as Mudgo, TKM6, and Samgangbyeo.
Bph1 and bph2 genes are the two common genes against the rice insect pest that had been initiated in almost all East Asia countries including Japan and Korea. A previous study found that bph2 gene might be allelic or closely linked to Bph1 (Sun et al. 2006). Hence, research has also concentrated on screening for the presence of bph2
genes. Associations in local varieties towards resistance and susceptibility of bph2 gene were identified using four
STS markers that were previously converted from AFLP markers, KPM1, KPM3, KPM4 and KPM8. Susceptible plants can be detected using the KPM1 marker at a single fragment of 341 bp while resistance-associated markers, KPM3, KPM4 and KPM8 produced single band at 116 bp, 300 bp, and 149 bp, respectively (Sharma et al. 2004). Our study found that only IR64 showed the same pattern of resistance as reported. Most of the Bph1 and bph2
resistance-associated markers were present in MR232 as shown in Table 1. This variety also produced a resistance band when screened with the pBPH9 marker hence it could be a strong evidence that MR232 possessed a resistant towards both gene Bph1 and bph2, said to be closely linked. Screening with Bacterial Leaf Blight Resistance Markers
As mentioned by Goto et al. (2009), more than thirty genes which confer resistance to various Xoo strains have been identified and are used for genetic improvement of rice for resistance to Xoo in Asia. Currently, seventeen bacterial leaf blight R-genes have been mapped on rice chromosomes and used for transferring and pyramiding in marker assisted selection (MAS). In particular, six R-genes, Xa1, xa5, xa13, Xa21, Xa26 and Xa27, were cloned by map-based
Figure 1. PCR amplification of STS-marker related to Bph1 gene in local varieties. A. pBPH9 co-segregated marker produced a 536 bp band for resistant varieties and a 773 bp of polymorphic band for susceptible varieties; B. BpE18-3
marker showed a resistant band at 536 bp in lanes 7 and 9 related to Bph1. Arrows indicate resistance to Bph1. Lane 1: 100 bp DNA ladder; Lanes 2–9: Local varieties tested; Other lanes: Control varieties.
cloning. Twenty-eight markers of SSR, STMS and gene/ allele specific (Iyer & Mc Couch 2004) related to bacterial leaf blight resistance were screened for via PCR, analyzed and validated by sequencing and sequence analysis. All of the local varieties were screened with two gene-specific markers, pTA248 and MP1+MP2. Each of the markers was developed for screening the presence of the bacterial leaf blight dominant genes, Xa21 and Xa4.
Amplification with the pTA248 marker, located at 0–1cM from Xa21 on chromosome 11 (Ramalingam et al. 2002) produced two band sizes, 1018 bp and ~900–950 bp. None of the seven varieties was found to produce a
1018 bp band similar to the control varieties of IRBB54 and IRBB66, while neither MR232 nor MRQ74 produced any bands at all (Figure 2A). Their sequences were found to have 100% similarity with the Oryza sativa linked
Xa21 gene. An analysis of MR219, MRQ76, MR220, MR211 and MRQ54 produced bands within the range of ~900–950 bp, and also showed that the sequences had 92%–97% similarity with the Oryza sativa linked Xa21 gene. Thus, pTA248 was validated as a gene specific marker for Xa21 gene in the screening of local varieties (Figures 3A and 3B). It could also be concluded that MR219, MRQ76, MR220, MR211 and MRQ50 might contain Xa21 gene.
Table 1. Distribution of BPH associated-markers namely KPM1 (341 bp), KPM3 (116bp), KPM4 (300 bp), and KPM8 (149 bp) in seven local varieties. Mudgo, IR64 IR50 and Taichung Native1 were used as control varieties. KPM3 (116 bp) marker was not amplifiable in
all cultivars.
Accession KPM1 KPM3 KPM4 KPM8
(S-associated) (R-associated) (R-associated) (R-associated)
MR 219 + NA – +
MR211 + NA – +
MR220 + NA + –
MR232 + NA + +
MRQ76 – NA – –
MRQ74 – NA – +
MRQ50 – NA – –
Mudgo + NA + –
IR64 + NA – +
IR50 + NA – +
Taichung Native 1 – NA – –
+: Resistant type variety, –: Susceptible type variety, NA: Not amplifiable.
Figure 2. PCR amplification of gene-specific markers for resistance genes Xa21 and Xa4 to bacteria leaf blight. A. pTA248 marker produced two band sizes, 1018 bp and ~900–950 bp for resistant and susceptible varieties to Xa21 gene. Lane 1: DNA ladder; Lanes 2–9: Local varieties tested; Other lanes: Control varieties. B. MP1+MP2 gene specific marker produced
an approximately 175–200 bp singular band for all varieties tested; Lanes 1–7: MR219, MRQ76, MR232, MR220, MR211, MRQ74, MRQ50; Lane 9: 100 bp DNA ladder. Arrows indicate resistance to Xa21 and Xa4.
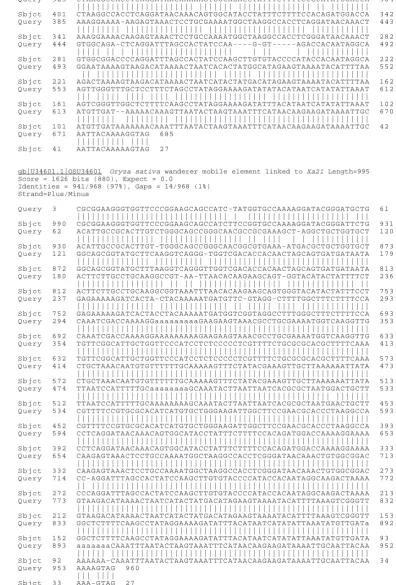
Figure 3. Sequence analysis of fragments amplified by pTA248, gene-specific marker using NCBI’s BLAST. A. Alignment and comparison of the MR219 fragment showed 92% similarity to Oryza sativa wanderer mobile element linked to Xa21 Length = 995 bp. B. Alignment and comparison of control variety, IRBB66 fragment showed 97% similarity to Oryza sativa
wanderer mobile element linked to Xa21 Length=995bp. A gb|U34601.1|OSU34601 Oryza sativa wanderer mobile element linked to Xa21, Length=995
Score = 492 bits (266), Expect = 1e-135 Identities = 341/375 (90%), Gaps = 14/375 (3%) Strand=Plus/Minus
Q u e r y 3 2 5 C T A A G G C C A C C T C A G G A T A A C A A A A A G T G G C A G A C C T A T T T C T T T T C C G C A T A T G G A C C A 3 8 4 | | | | | | | | | | | | | | | | | | | | | | | | | | | | | | | | | | | | | | | | | | | | | | | | | | | | | | | | S b j c t 4 0 1 C T A A G G C C A C C T C A G G A T A A C A A A C A G T G G C A T A C C T A T T T C T T T T C C A C A G A T G G A C C A 3 4 2 Q u e r y 3 8 5 A A A G G A A A A - A A G A G T A A A C T C C T G C G A A A A T G G C T A A G G C C A C C T C A G G A T A A C A A A C T 4 4 3 | | | | | | | | | | | | | | | | | | | | | | | | | | | | | | | | | | | | | | | | | | | | | | | | | | | | | | | | | S b j c t 3 4 1 A A A G G A A A A C A A G A G T A A A C T C C T G C C A A A A T G G C T A A G G C C A C C T C G G G A T A A C A A A C T 2 8 2 Q u e r y 4 4 4 G T G G C A G A - C T C A G G A T T T A G C C A C T A T C C A A - - - - G - G T - - - A G A C C A C A A T A G G C A 4 9 2 | | | | | | | | | | | | | | | | | | | | | | | | | | | | | | | | | | | | | | | | | | | | | | S b j c t 2 8 1 G T G G C G G A C C C C A G G A T T T A G C C A C T A T C C A A G C T T G T G T A C C C C A T A C C A C A A T A G G C A 2 2 2 Q u e r y 4 9 3 G G A A T A A A A G T A A G A C A T A A A A C T A A T C A C A C T A T G G C A T A G A A G T A A A A T A C A T T T T A A 5 5 2 | | | | | | | | | | | | | | | | | | | | | | | | | | | | | | | | | | | | | | | | | | | | | | | | | | | | | | | | S b j c t 2 2 1 A G A C T A A A A G T A A G A C A T A A A A C T A A T C A T A C T A T G A C A T A G A A G T A A A A T A C A T T T T A A 1 6 2 Q u e r y 5 5 3 A G T T G G G T T T G C T C C T T T C T A G C C T A T A G G A A A A G A T A T A T A C A T A A T C A T A T A T T A A A T 6 1 2 | | | | | | | | | | | | | | | | | | | | | | | | | | | | | | | | | | | | | | | | | | | | | | | | | | | | | | | S b j c t 1 6 1 A G T C G G G T T G G C T C T T T T C A A G C C T A T A G G A A A A G A T A T T T A C A T A A T C A T A T A T T A A A T 1 0 2 Q u e r y 6 1 3 A T G T T G A T - - A A A A A C A A A G T T A A T A C T A A G T A A A T T T C A T A A C A A G A A G A T A A A A T T G C 6 7 0 | | | | | | | | | | | | | | | | | | | | | | | | | | | | | | | | | | | | | | | | | | | | | | | | | | | | | | | | | S b j c t 1 0 1 A T G T T G A T A A A A A A A C A A A T T T A A T A C T A A G T A A A T T T C A T A A C A A G A A G A T A A A A T T G C 4 2 Q u e r y 6 7 1 A A T T A C A A A A G G T A G 6 8 5
| | | | | | | | | | | | | | S b j c t 4 1 A A T T A C A A A A A G T A G 2 7
B gb|U34601.1|OSU34601 Oryza sativa wanderer mobile element linked to Xa21 Length=995 Score = 1626 bits (880), Expect = 0.0
Identities = 941/968 (97%), Gaps = 14/968 (1%) Strand=Plus/Minus
Q u e r y 3 C G C G G A A G G G T G G T T C C C G G A A G C A G C C A T C - T A T G G T G C C A A A A G G A T A C G G G A T G C T G 6 1 | | | | | | | | | | | | | | | | | | | | | | | | | | | | | | | | | | | | | | | | | | | | | | | | | | | | | | | | S b j c t 9 9 0 C G C G G A A G G G T G G T T C C C G G A A G C A G C C A T C T T C C G G T G C C A A A A G G A T A C G G G A T T C T G 9 3 1 Q u e r y 6 2 A C A T T G C C G C A C T T G T C T G G G C A G C C G G G C A A C G C C G C G A A A G C T - A G G C T G C T G G T G C T 1 2 0 | | | | | | | | | | | | | | | | | | | | | | | | | | | | | | | | | | | | | | | | | | | | | | | | | | | | | S b j c t 9 3 0 A C A T T G C C G C A C T T G T - T G G G C A G C C G G G C A A C G G C G T G A A A - A T G A C G C T G C T G G T G C T 8 7 3 Q u e r y 1 2 1 G G C A G C G G T A T G C T T C A A G G T C A G G G - T G G T C G A C A C C A C A A C T A G C A G T G A T G A T A A T A 1 7 9 | | | | | | | | | | | | | | | | | | | | | | | | | | | | | | | | | | | | | | | | | | | | | | | | | | | | | | | | | | S b j c t 8 7 2 G G C A G C G G T A T G C T T T A A G G T C A G G G T T G G T C G A C A C C A C A A C T A G C A G T G A T G A T A A T A 8 1 3 Q u e r y 1 8 0 A C T T C T T G C C T G C A A G G C C G T - A A - T T A A C A C A A G A A G C A G T - G G T A C A T A C T A T T T T C T 2 3 6 | | | | | | | | | | | | | | | | | | | | | | | | | | | | | | | | | | | | | | | | | | | | | | | | | | | | | | | S b j c t 8 1 2 A C T T C T T G C C T G C A A G G C G G T A A A T T T A A C A C A A G A A G C A G T G G G T A C A T A C T A T T T C C T 7 5 3 Q u e r y 2 3 7 G A G A A A A A G A T C A C T A - C T A C A A A A A T G A T G T T C - G T A G G - C T T T T G G C T T T C T T T T C C A 2 9 3 | | | | | | | | | | | | | | | | | | | | | | | | | | | | | | | | | | | | | | | | | | | | | | | | | | | | | | | S b j c t 7 5 2 G A G A A A A A G A T C A C T A C C T A C A A A A A T G A T G G T C G G T A G G C C T T T G G G C T T T C T T T T C C A 6 9 3 Q u e r y 2 9 4 C A A A T C G A C C A A A A G G a a a a a a a a a G A A G A A G T A A A C G C C T G C G A A A A T G G T C A A G G T T G 3 5 3 | | | | | | | | | | | | | | | | | | | | | | | | | | | | | | | | | | | | | | | | | | | | | | | | | | | | | | | | | | | | S b j c t 6 9 2 C A A A T C G A C C A A A A G G A A A A A A A A A G A A G A A G T A A A C G C C T G C G A A A A T G G T C A A G G T T G 6 3 3 Q u e r y 3 5 4 T G T T C G G C A T T G C T G G T T C C C A T C C T C T C C C C C T C G T T T T C T G C G C G C A C G C T T T T C A A A 4 1 3 | | | | | | | | | | | | | | | | | | | | | | | | | | | | | | | | | | | | | | | | | | | | | | | | | | | | | | | | | | | | S b j c t 6 3 2 T G T T C G G C A T T G C T G G T T C C C A T C C T C T C C C C C T C G T T T T C T G C G C G C A C G C T T T T C A A A 5 7 3 Q u e r y 4 1 4 C T G C T A A A C A A T G T G T T T T T T G C A A A A A G T T T C T A T A C G A A A G T T G C T T A A A A A A T T A T A 4 7 3 | | | | | | | | | | | | | | | | | | | | | | | | | | | | | | | | | | | | | | | | | | | | | | | | | | | | | | | | | | | | S b j c t 5 7 2 C T G C T A A A C A A T G T G T T T T T T G C A A A A A G T T T C T A T A C G A A A G T T G C T T A A A A A A T T A T A 5 1 3 Q u e r y 4 7 4 T T A A T C C A T T T T T G C a a a a a a a a G C A A A T A C T T A A T T A A T C A C G C G C T A A T G G A C T G C T T 5 3 3 | | | | | | | | | | | | | | | | | | | | | | | | | | | | | | | | | | | | | | | | | | | | | | | | | | | | | | | | | | | S b j c t 5 1 2 T T A A T C C A T T T T T G C A A A A A A A A G C A A A T A C T T A A T T A A T C A C G C G C T A A T G A A C T G C T T 4 5 3 Q u e r y 5 3 4 C G T T T T C C G T G C G C A C A T C A T G T G C T G G G A A G A T T G G C T T C C G A A C G C A C C C T A A G G C C A 5 9 3 | | | | | | | | | | | | | | | | | | | | | | | | | | | | | | | | | | | | | | | | | | | | | | | | | | | | | | | | | | | | S b j c t 4 5 2 C G T T T T C C G T G C G C A C A T C A T G T G C T G G G A A G A T T G G C T T C C G A A C G C A C C C T A A G G C C A 3 9 3 Q u e r y 5 9 4 C C T C A G G A T A A C A A A C A G T G G C A T A C C T A T T T C T T T T C C A C A G A T G G A C C A A A A G G A A A A 6 5 3 | | | | | | | | | | | | | | | | | | | | | | | | | | | | | | | | | | | | | | | | | | | | | | | | | | | | | | | | | | | | S b j c t 3 9 2 C C T C A G G A T A A C A A A C A G T G G C A T A C C T A T T T C T T T T C C A C A G A T G G A C C A A A A G G A A A A 3 3 3 Q u e r y 6 5 4 C A A G A G T A A A C T C C T G C C A A A A T G G C T A A G G C C A C C T C G G G A T A A C A A A C T G T G G C G G A C 7 1 3 | | | | | | | | | | | | | | | | | | | | | | | | | | | | | | | | | | | | | | | | | | | | | | | | | | | | | | | | | | | | S b j c t 3 3 2 C A A G A G T A A A C T C C T G C C A A A A T G G C T A A G G C C A C C T C G G G A T A A C A A A C T G T G G C G G A C 2 7 3 Q u e r y 7 1 4 C C - A G G A T T T A G C C A C T A T C C A A G C T T G T G T A C C C C A T A C C A C A A T A G G C A A G A C T A A A A 7 7 2 | | | | | | | | | | | | | | | | | | | | | | | | | | | | | | | | | | | | | | | | | | | | | | | | | | | | | | | | | | | S b j c t 2 7 2 C C C A G G A T T T A G C C A C T A T C C A A G C T T G T G T A C C C C A T A C C A C A A T A G G C A A G A C T A A A A 2 1 3 Q u e r y 7 7 3 G T A A G A C A T A A A A C T A A T C A T A C T A T G A C A T A G A A G T A A A A T A C A T T T T A A A G T C G G G T T 8 3 2 | | | | | | | | | | | | | | | | | | | | | | | | | | | | | | | | | | | | | | | | | | | | | | | | | | | | | | | | | | | | S b j c t 2 1 2 G T A A G A C A T A A A A C T A A T C A T A C T A T G A C A T A G A A G T A A A A T A C A T T T T A A A G T C G G G T T 1 5 3 Q u e r y 8 3 3 G G C T C T T T T C A A G C C T A T A G G A A A A G A T A T T T A C A T A A T C A T A T A T T A A A T A T G T T G A T a 8 9 2 | | | | | | | | | | | | | | | | | | | | | | | | | | | | | | | | | | | | | | | | | | | | | | | | | | | | | | | | | | | | S b j c t 1 5 2 G G C T C T T T T C A A G C C T A T A G G A A A A G A T A T T T A C A T A A T C A T A T A T T A A A T A T G T T G A T A 9 3 Q u e r y 8 9 3 a a a a a a a C A A A T T T A A T A C T A A G T A A A T T T C A T A A C A A G A A G A T A A A A T T G C A A T T A C A A 9 5 2 | | | | | | | | | | | | | | | | | | | | | | | | | | | | | | | | | | | | | | | | | | | | | | | | | | | | | | | | | | | S b j c t 9 2 A A A A A A - C A A A T T T A A T A C T A A G T A A A T T T C A T A A C A A G A A G A T A A A A T T G C A A T T A C A A 3 4 Q u e r y 9 5 3 A A A A G T A G 9 6 0
Qi Ming et al. (2006) have noted that Xa4, one of the genes related to bacterial leaf blight, can confer resistance to several races of Xanthomonas. MP1+MP2 was cloned
and developed to screening for the presence of the Xa4 gene on chromosome 4; it is incompletely dominant and located 5.3cM from the Xa4. Screening with the marker, produced bright bands within the expected size (~120–175 bp) for all of the varieties tested (Figure 2B). All of the sequences showed high similarity, 92%–93% with the protein coding region of chromosome 4 where Xa4 is located. Thus, the marker MP1+MP2 was validated as a gene-specific primer for Xa4 in local varieties.
Screening with Blast Resistance Markers
More than seventy genes and three hundred and forty- seven quantitative trait loci (QTLs) have been detected to be related to blast resistance. Out of these, nine of the resistance genes (Pib, Pita, Pik-h, Pi9, Pi2, Piz-t, Pid2, Pi36 and Pi37) have been isolated and cloned using map-based cloning strategies (Koide et al. 2009). Many reports mention that the genes affecting blast resistance are co-localized on chromosomes 6, 11 and 12. On chromosome 6, fourteen genes have been mapped in the region near the centromere, with nine genes on chromosome 11 and 17 genes on chromosome 12.
Sixty-four markers were used to screen for blast resistance genes in all the varieties. Gene-specific markers, SSR as well as InDel markers of the desired resistance genes were validated on selected local varieties. Screening of the local varieties with InDel marker, TA3 showed that all of the varieties produced bright bands of the expected size 173 bp (Figure 4A). The results obtained indicated
that all of these varieties might contain Pi-ta/Pi-ta2. This InDel marker is located close to the gene on chromosome 12 (Hayashi et al. 2006). All of the sequences analyzed showed 100% similarity with the Pi-ta/Pi-ta2 cds region on chromosome 12. These lie across many different cultivars which have been analyzed. TA3, a SNP/InDel marker, is validated for screening for the presence of the Pi-ta/Pi-ta(2) gene.
The Pi-b gene which is reported as one of the blast dominant genes that can be screened with several markers such as RM166 and RM208 for SSR, or co-segregate markers, b2 as an InDel marker, and also with Pisbdom, a gene specific marker. Pisbdom was evaluated by Fjellstrom et al. (2004) as a gene-specific marker and is
located exactly at the Pi-b gene location on chromosome 2. Amplification of the Pisbdom markers on all seven local varieties showed that only MRQ74 and MRQ50 did not produce any bands at all. In contrast, the hybrid variety, Intani-2 and the other varieties, MR219, MRQ76, MR232, MR220 and MR211 produced bands which were not of the expected size (~365 bp) as reported to be present in Te-Qing variety. Intani-2 produced two bands, one at 365 bp while the other was slightly below 600 bp. Based on the sequences analysis, the local varieties did not show any similarities with the Pi-b gene sequences at all. However, analysis of the 365 bp fragment of Intani-2 showed an identical sequence with the Pi-b gene. It could be concluded that Pisbdom could be used as a gene specific marker for the Pi-b gene, and that only Intani-2 might contain the said gene.
A total of eighty-eight markers was successfully amplified and yielded reproducible results although
Figure 4. PCR amplification of blast related markers. A. TA3, InDel markers for the Pi-ta/Pi-ta2 gene showed all varieties produced bands at 173 bp. Lanes 1–8: MR219, MRQ76, MR232, MR220, MR211, MRQ74, MRQ50; Lane 10: 100 bp DNA ladder. B. Pisbdom, a gene-specific marker amplified a fragment of approximately 365 bp. Lane 1: 100 bp DNA ladder;
Lanes 2–6: MR219, Intani-2, MR211, MRQ74, MRQ50. Arrows indicate the expected band size.
some public domain markers were developed for specific background. The gene distribution in all varieties tested can be summarized as shown in Table 2 however only based on gene/allele-specific markers tested. Study provides basic information on local rice varieties and further works can be conducted to further characterize genes in depth to improve the elite lines.
CONCLUSION
Seven local varieties were successfully screened with one hundred and twenty-two type-related markers for brown planthopper, bacterial leaf blight and blast resistance. MR219 and MR232 were found to possess highest distribution of the resistance markers as compared with the other five varieties. On the other hand, MRQ76, MRQ74 and MRQ50 (high quality aromatic rice) that have been reported to be resistant to blast and bacteria blight were found to have fewer markers distributed compared to MR219 and MR232. Our work provided useful data of markers distribution in local rice varieties that could be utilized by plant breeders for the screening of disease and pests resistance. This utility of the markers would allow plant breeders to reduce the number of progeny that are needed to be experimentally tested by deploying molecular assisted selection approach. However a large population and different crosses are needed in order to further validate these markers, hence assisting in a breeding programme in order to shorten the time consumed by conventional selection.
ACKNOWLEDGEMENTS
This research was funded by Sime Darby Technology Centre Sdn Bhd (Research) and special acknowledgement is accorded to MARDI for providing the seeds.
Date of submission: February 2012 Date of acceptance: March 2013
REFERENCES
Altschul, SF, Gish, W, Miller, W, Myers, EW & Lipman, DJ 1990, 'Basic local alignment search tool', viewed 25 November 2011, <http://blast.ncbi.nlm.nih.gov/Blast.cgi>.
Babujee, L & Gnanamanickam, SS 2000, ‘Molecular tools for characterization of rice blast pathogen (Magnaporthe grisea) population and molecular marker-assisted breeding for disease resistance’, Current Science, vol. 78, pp. 248–257.
Brar, DS, Virk, PS, Jena, KK & Khush, GS 2009, Breeding for resistance to planthoppers in rice, International Rice Research Institute, Los Banos, The Philippines.
Cha, YC, Ji, H, Yun, DW, Ahn, BO, Lee, MC, Suh, SC, Lee, CS, Ahn, EK, Jeon, YH, Jin, ID, Sohn, JK, Koh, HJ & Eun, MY 2008, ‘Fine mapping of the Rice Bph1 Gene, which confers resistance to the brown planthopper (Nilaparvata lugens Stal), and development of STS markers for marker-assisted selection’, Molecular Cells, vol. 26, pp. 146–151.
Chakravarthi, BK & Naravaneni, R 2006, ‘SSR marker based DNA fingerprinting and diversity study in rice (Oryza sativa L)’, African Journal of Biotechnology, vol. 5, no. 9, pp. 684–688.
Davierwala, AP, Reddy, APK, Lagu, MD, Ranjekar, PK & Gupta, VS 2001, ‘Marker assisted selection of bacterial blight resistance genes in rice’, Biochemical Genetics, vol. 39, pp. 261–278.
Fjellstrom, R, Conaway-Bormans, CA, McClung, AM, Marhetti, MA, Shank, AR & Park, WD 2004, ‘Development of DNA markers suitable for marker assisted selection of three Pi genes conferring resistance to multiple Pyricularia grisea Pathotypes’, Crop Science, vol. 44, pp.1790–1798.
Goto, T, Matsumoto, T, Furuya, N, Tsuchiya, K & Yoshimura, A 2009, ‘Mapping of bacterial blight resistance gene Xa11 on rice chromosome 3’, Japan Agricultural Research Quarterly, vol. 43, no. 3, pp. 221–225.
Gowda, M, Venu, RC, Roopalakshmi, K, Sreerekha, MV & Kulkarni, RS 2003, ‘Advances in rice breeding, genetics and genomics’, Molecular Breeding, vol. 11, pp. 337–352.
Hayashi, K, Yoshida, H & Ashikawa, I 2006, ‘Development of PCR-based allele-specific and InDel marker sets for nine rice blast resistance genes’, Theoretical Applied Genetics, doi 10.1007/s00122-006-0290-6.
Table 2. Resistant gene’s distribution on local rice varieties, MR 219, MR220, MR211, MR232, MRQ76, MRQ74, MRQ50 and foreign
varieties, Intani-2 tested on gene/allele specific markers.
Rice Pest and Diseases
variety Variety Brown Planthopper Blast Bacteria Blight (BLB)
MR219 bph2 Pi-21, Pi-ta, Pi-ta2, Pi-km Xa4, xa21, Xa1
MR220 Pi-km Xa1, Xa11, Xa21
MR211 Pi-ta2 , Pi-km Xa21
Local varieties MR232 Bph1, bph2 Pi-b, Pi-ta, Pi-ta2, Pi-gm(t) Xa4, xa21
MRQ76 Bph 1, Bph13(t) Pi-ta Xa11, Xa21
MRQ74 Pi-ta
MRQ50 Bph1 Pi-ta2, Pi-km Xa1, Xa21
He, GC 2007 ‘Brown planthopper resistance genes in rices: from germplasm to breeding’, Molecular Plant Breeding, vol. 5, pp.175–176.
Iyer, AS & McCouch, SR 2004, ‘The rice bacterial blight resistance gene xa5 encodes a novel form of disease resistance’, Molecular Plant- Microbe Interactions, vol. 17, no. 12, pp. 1348–1354.
Jairin, J, Phengrat, K, Teangdeerith, S, Vanavichit, A & Toojinda, T 2007, ‘Mapping of a broad-spectrum brown planthopper resistance gene, Bph3, on rice chromosome 6’, Molecular Breeding, vol. 9, pp. 35–44.
Jaiswal, P, Ni, J, Yap, I, Ware, D, Spooner, W, Youens-Clark, K, Ren, L, Liang, C, Zhao, W, Ratnapu, K, Faga, B, Canaran, P, Fogleman, M, Hebbard, C, Avraham, S, Schmidt, S, Casstevens TM, Buckler, ES, Stein, L & McCouch, S 2006, 'Gramene database', viewed on 8 February 2012, <http:// www.gramene.org/multi/blastview>.
Jena, KK & Kim, SM 2010, 'Current status of brown planthopper (BPH) resistance and genetic', Rice, doi 10.1007.
Kim, SM & Sohn, JK 2005, ‘Identification of a rice gene (Bph1) conferring resistance to brown planthopper (Nilaparvata lugens Stal) using STS markers’, Mol. Cells, vol. 20, pp. 30–34.
Koide, Y, Kobayashi, N, Xu, D & Fukuta, Y 2009, ‘Resistance genes and selection DNA markers for blast disease in rice (Oryza sativa L.)’, Japan Agricultural Research Quarterly, vol. 43, no. 4, pp. 255–280.
Mackill, DJ 2007, ‘Molecular markers and marker-assisted selection in rice', in Genomics-assisted crop improvement’, eds RK Varshney & R Tuberosa, Genomics Applications in Crops. vol. 2, pp. 147–168.
Murai, H, Hashimoto, Z, Sharma, P, Shimizu, T, Murata, K, Takumi, S, Mori, N, Kawasaki, S & Nakamura, C 2001, ‘Construction of a high-resolution linkage map of a rice brown planthopper (Nilaparvata lugens Stal) resistance gene bph2’, Theoretical Applied Genetics, vol. 103, pp. 526–532.
Qi-ming, D, Shi-quan, W, Ai-ping, Z, Hong-yu, Z & Ping, L 2006, ‘Breeding rice restorer lines with high resistance to bacterial blight by using molecular marker-assisted selection’, Rice Science, vol. 13, no. 1, pp. 22–28.
Ramalingam, J, Basharat, HS & Zhang, G 2002, ‘STS and microsatellite marker-assisted selection for bacterial blight resistance and waxy genes in rice, Oryza sativa L’, Euphytica, vol. 127, pp. 255–260.
Sharma, PN, Torii, A, Takumi, S, Mori, N & Nakamura, C 2004, ‘Marker-assisted pyramiding of brown planthopper (Nilaparvata lugens Stal) resistance genes Bph1 and bph2 on rice chromosome 12’, Hereditas, vol. 140, pp. 61–69.
Sun, LH, Wang, CM, Su, CC, Liu, YQ, Zhai, HQ & Wan, JM 2006, ‘Mapping and marker-assisted selection of a brown planthopper resistance gene bph2 in rice (Oryza sativa L.)’, Acta Genetica Sinica, vol. 33, no. 8, pp. 717–723.
The construction industry is one of the most booming activities in the world especially in the developing countries where construction is considered as a continuous activity. Malaysia as one of the developing countries which faces rapid growth in industries which contributes to the Malaysian economy. The former second Finance Minister of Malaysia, enlightened this at a press conference. He mentioned that the Malaysian construction industry registered a growth of 1.1% in the first quarter of 2009 and improved to 2.8% in the second quarter of The Star (2009).
The Malaysian construction industry can generally be separated into two areas (Malaysia-German Chamber of Commerce 2010). The first area is general construction which comprises residential construction, non-residential construction and civil engineering construction. While the second area is special trade works which include activities of metal works, electrical, plumbing, sewerage and sanitary, refrigeration and air-conditioning, painting, carpentry, tiling and flooring, and glass.
It was estimated about 709 400 units of residential building will be constructed based on the 9th Malaysian Plan. The state of Selangor announced in 2005 that it embraced the highest percentage of this number which is 19.2%, followed by Johor (12.9%), Sarawak (9.4%) and Perak (8.2%). Presently, sustainable development
has become a worldwide issue of several countries. This concern is augmented by the inefficiencies of waste management including the waste generated from construction and demolition activities. Based on the research done by Hendriks and Pietersen (2000) showed that the construction industry generated about 35% of the industrial waste in the world.
In Malaysia, data on the current composition of construction waste flows from the source of generation, types of waste, intermediate and final disposal and the amount of waste reduced at source, reused or recycled on site or off-site composition of waste are not readily available (Begum
et al. 2006; Tang & Larsen 2004; Kofoworolo & Gheewala
2009). According to a previous study (Nasir et al. 1998), it
showed that the percentage of industrial and construction waste was placed in third ranking with 28.34% below the household waste and market and commercial waste.
Due to lack of markets for construction waste recycling in Malaysia, all construction wastes are disposed at landfills either legally or illegally except for metals, glass, plastic, paper and cardboards, since these materials could be transformed into various degrees of materials (Pereira 2007). As a result, there will be major problems in disposal activities when landfills are exhausted and also because of illegal dumping.
A Review on Materials Waste Quantification and
Management in Construction Activities
C.H. Asmawati1*, M.R. Ahmad Ruslan1, Y. Zulkiflee2 and M.N.N. Husna1
Nowadays, construction and demolition waste has become a major issue to environmental problems faced by many countries. This concern comes from the inefficiencies of waste management which includes the waste generated from construction and demolition activities. In Malaysia, there is a lack of database records on construction waste and this has affected proper management planning of the waste. As there is a lack of policy on construction waste management, control on construction waste disposal is very hazy and this has aggravated environmental problems and exhausted landfill usage and increased illegal dumping. This paper reviews the critical issues on construction waste management and also discusses several estimation models on construction waste generation from several countries. Based on the review, most of the countries faced problems regarding construction waste management and the models developed were considered as one of the methods which could be adopted for better management of construction wastes.
Key words: Construction waste; waste management; planning; quantification model; construction industry; models; estimation
1Institute of Infrastructure, Environmental Sustainable Management, Universiti Teknologi MARA, Shah Alam, Selangor, Malaysia 2Faculty of Civil Engineering, Universiti Teknologi MARA, Shah Alam, Selangor, Malaysia
This article is intended to obtain some findings on waste quantification from the various models developed which perhaps might not only contribute to the better waste management but also solve the problems arising from waste generated in Malaysia.
REVIEW ON CONSTRUCTION WASTE MANAGEMENT
The construction industry is one of the major activities affecting the environment and this has affected sustainable development which has become a hot issue discussed for several years (DETR 2000). Sustainable development is defined as activities that meet the needs that will deliver social progress, protect the environment, contribute to better resource use, economic growth and employment.
In many countries, the volume of construction waste is very little known and quantifying the waste is very hard because of the lack of record by construction companies on the qualitative and quantitative characteristics of the waste they generate (Begum et al. 2006). Some problems were
also found concerning solid waste management system in a developing country which includes low collection coverage and irregular collection services; crude open dumping and burning without air and water pollution control; the breeding of flies and vermin; and the handling and control of informal waste picking or scavenging activities (Ogawa 1996). These problems are caused by various factors classified as technical, financial, institutional, economic, and social constraints.
In Spain, the government has proposed a regulation on the production and management of construction and demolition waste. This new regulation required the project developer to include a construction and demolition (C&D ) management study in the construction projects and compels the contractor to design a C&D waste management plan for the construction site. Two important aspects of control obtained from the study and plan are waste quantities and treatment costs (Solis-Guzman et al. 2009).
In Thailand, the method for the management of construction waste involves manual collections left on the floor which are then cleared out from the site by main contractors or sub-contractors (Kofoworola & Gheewala 2009). Also a survey cited by Chanchorn (2002) revealed that 69% of the construction companies in Bangkok manage the construction waste themselves, while another 31% award this task to sub-contractors or other individuals (Kofoworola & Gheewala 2009).
The Chairman of CIDB Malaysia has stated that there are seven consequences of construction on the environment (Nazirah 2010). The effects are: it contributes about 40%
of global house gases (GHG); affects 70% of citys GHG; contributes to the loss of biodiversity ecosystem; occurs in hazard prone geographies; consumes 30% of world resources; deposits 40% of the waste to landfills; and consumes 12% of the world’s water (Nazirah 2010).
In Malaysia, 16 000 tonnes of solid waste are produced in the country every day (Yeang 2003) and there are about 230 landfills in Malaysia and it is estimated that there are also three times as many illegal dumps. From these quantities of landfills, 80% of them have been estimated to remain for a lifetime of only 2 years (Agumuthu 2001). Solid waste is managed by Local Authorities and on 6 September 1995, the Federal Cabinet (of Malaysia) decided that the responsibilities of the Local Authorities in these areas had to be privatized. As a precondition to total privatization, the Federal Cabinet again in 1998 decided that the privatization of solid waste management in the country to be conducted on a short-term basis. Solid waste management has been privatized from 48 local authorities to two concession companies e.g. Alam Flora at the central region of the country, and Southern Waste for the southern region (National Solid Waste Management Department 2010).
ESTIMATION MODELS OF WASTE GENERATION
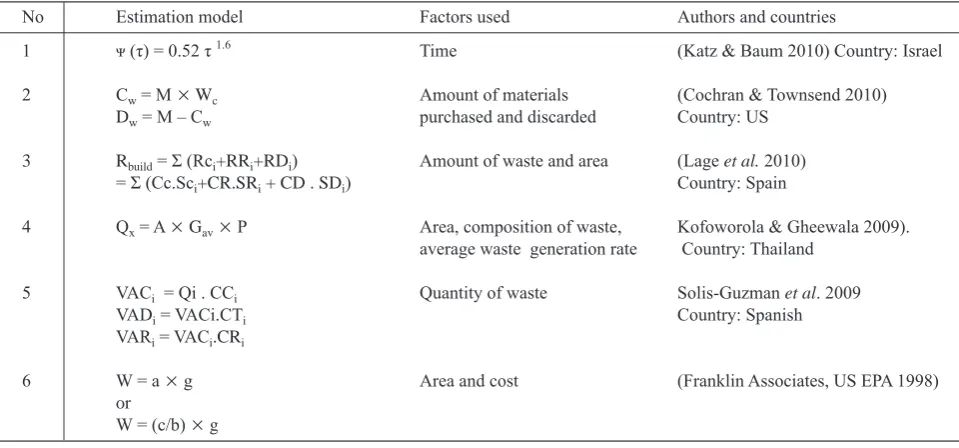
Models which have been developed previously were classified as in Table 1 and the details are discussed below.
A Novel Methodology to Estimate the Evolution of Construction Waste in Construction Sites
A methodology developed (Katz & Baum 2010) evaluated the accumulation of waste generated from construction activities in medium to large residential construction sites and from start to end of the project. By estimating the construction waste generation, it will help project managers to manage their sites, estimate the flow of outgoing materials of the site and cost estimation on waste management.
An empirical model developed is used to evaluate the amount of waste generated at different times, from start to end of the project construction. The model was validated by comparing the predicted with the collected value of waste (Katz & Baum 2010) which was about two-third of the amount of waste accumulated during the end finishing of construction activities. The quantity of waste increased towards the end of the project life, whilst the amount of recyclable material was found to be decreased due to the type of waste generated in this phase which is more on packaging. It could also be concluded that there was no correlation between the construction method and the amount of waste generated.
Estimating Construction and Demolition Debris Generation Using Materials Flow Analysis Approach
A study by Cochran and Townsernd (2010) presented an evaluation of materials waste flow analysis as an
approach for estimating construction and demolition debris generation and composition for a large region in the US. The major construction materials considered in this study were concrete, wood, metal, drywall and other gypsum products, bricks and other clay products, asphalt concrete and asphalt roofing materials. Data for materials used per year could be gathered from industry association and federal agencies. The equation produced was to predict the total amount of waste from construction and demolition without excluding the waste reused or recycled on or off the site.
Estimation of the Annual Production and Composition of C&D Debris in Galicia (Spain)
The first step towards the correct management of the construction and demolition debris is to determine the volume of the waste Martinez et al. 2010; and
Solis-Guzman et al. (2009) stated that the early estimation of
Table 1. Estimation models on construction waste.
No Estimation model Factors used Authors and countries
1 ᴪ (τ) = 0.52 τ 1.6 Time (Katz & Baum 2010) Country: Israel
2 Cw = M 3 Wc Amount of materials (Cochran & Townsend 2010)
Dw = M – Cw purchased and discarded Country: US
3 Rbuild = Ʃ (Rci+RRi+RDi) Amount of waste and area (Lage et al. 2010)
= Ʃ (Cc.Sci+CR.SRi + CD . SDi) Country: Spain
4 Qx = A 3 Gav3 P Area, composition of waste, Kofoworola & Gheewala 2009).
average waste generation rate Country: Thailand
5 VACi = Qi . CCi Quantity of waste Solis-Guzman et al. 2009
VADi = VACi.CTi Country: Spanish
VARi = VACi.CRi
6 W = a 3 g Area and cost (Franklin Associates, US EPA 1998)
or
W = (c/b) 3 g
1. ᴪ (τ) — Amount of waste at various point of time per m2; τ — Normalized time.
2. Cw — Materials discard during construction and installation phase of renovation (Mg); M — Amount materials purchased (Mg/ yr); Wc —Portion discard during construction (%); Dw — Demolition waste (Mg).
3. Rbuild is C&D waste generated in a year; Rci —Waste generated from new construction; RRi — Waste generated from renovation
activity; RDi — Waste generated from demolition activities; Sci , SRi , SDi — Total surface area of construction, renovation or
demolition activities; Cc , CR , CD — Quantity of waste generated per unit of surface in construction, renovation or demolition
activities.
4. Qx — Quantity of construction waste material, tons; A — Area of building construct, m2; G
av — Average waste generation rate;
P — Average composition of waste material %. 5. VACi — Apparent constructed volume in m
3/m2 for item i; VAD
i — Apparent Demolished Volume in m
3/m2 for item i; VAR i
— Apparent Wreckage Waste Volume in m3/m2 for item i; Qi — Quantity of the item i in its specific unit (m, m2
, m3, kg or
unity); CCi — Conversion ratio of the amount of item i in m
3/Qi specific unit.; CT
i — Coefficient of transformation of VAC in
VAD (dimensionless); CRi — Cefficient of transformation of VAC in VAR (dimensionless); CCi , CTi , CRi, — Estimated from
Andalusian Construction Costs Database (2008).
waste would be to generate and allow the calculation of the deposit that the building developer might have to pay to manage the waste and the control of the disposal of this waste.
Martinez Lage and co-researchers in 2010 showed the procedure to calculate construction waste production in a year in any region of Spain. The total waste generated in the year is determined by summing the waste generated from new construction, renovation and demolition activities. There are four assumptions made by the authors to calculate the building related C&D Debris, viz:
•
The number of construction, renovation and demolition works might be adjusted to a theoretical function over a time;•
The distribution of construction activities was assumed to be the same every year throughout the whole region;•
The surface area of construction, renovation and demolition project was also adjusted for a variable function over time; and•
The quantity of waste generated per unit surface area was assumed to be the same for each type of construction.The assumption made might cause a lack of accuracy in wastage estimation since the different wastes would be generated from difference construction activities such as residential, commercial, industrial, religious building, etc. Estimation of Construction Waste Generation and Management in Thailand
Kofoworola and Gheewala (2009) estimated the quantities of construction waste generated in Thailand from 2002 to 2005; it was carried out as an incentive for the development of an integrated waste management system and implementation of policies for managing construction waste in Thailand.
Due to a lack in qualitative and quantitative report of waste generated, all the data were collected from the National Statistics Organization of Thailand. The quantity of construction waste by material and construction type was obtained by using the equation developed as in Table 1. The same equation was also used to estimate the average quantity of the materials from the demolition of buildings and in determining waste materials generated from new constructions. The infrastructure building, maintenance and demolition activities were excluded due to the lack of data available for these activities. Data collected, indicated that approximately 12 kg of construction waste per capita in 2002 was generated and it increased to 18 kg/capita in 2003 and 22 kg/capita in 2003 and 2004, respectively. The amount of construction waste per capita calculated was considered as a part of the municipal solid waste in Thailand.
Two assumptions were made by HQ Air Force Centre for Environmental Excellence (2006) in order to evaluate the construction waste generation. They are:
(i) New residential building activities generated 21.38 kg/m2 of waste; and
(ii) New non-residential buildings generated 18.99 kg/m2 of waste.
In order to obtain the estimated amount of construction waste, the two assumptions stated were multiplied to the area of the construction project.
A Spanish Model for Quantification and Management of Construction Waste
The Alcores model discussed in this paper (Solis-Guzman 2009) was introduced since 2008 to estimate the volume of waste that was expected to be generated at building sites. The model was based on the principle described in the national construction and demolition waste plan 2001– 2006 and the concept of the model were tested in Seville which stated that the waste generated should be managed in a correct disposal manner by the concerned parties which produced the waste.
Construction waste was classified into three sources: demolished (due to demolition process); wreckage (due to losses, off-cuts and breakage of materials during work completion) and packaging waste (materials wrapping, cans etc.). The first step in developing this model was to classify the waste item based on the division of budget. This classification characterises the similar materials with the same measurement unit.
The quantity of each item was obtained from 100 surveyed projects selected from bill by following five main characteristics:
•
New construction or demolition projects•
From 1 to 10 floors, 1 or 2 basement levels and stores or offices at ground level•
Pile, reinforced concrete slab, reinforced concrete trench or pads of foundation•
Reinforced concrete or brick walls structure; and•
Inclined or horizontal ceiling.The construction volume of waste is calculated by multiplying the quantity of waste measured from the survey and the conversion ratio estimated from Andalusian Construction Costs Database and from expert team guidelines.
CONCLUSION
this industry. Hence, proper management of this waste is required in order to avoid the environmental effects such as illegal dumping, open burning, exhaustion of landfill areas and many more. Poor records of construction waste data is one of the issues; the amount of construction waste is hard to find in order to improve better waste management (Kaurmpanis et al. 2008).
Previous models developed to estimate construction waste was consider as one of the methods for better management of construction waste. This makes sense since the wastes from building materials was found to be far higher than the nominal figures assumed by the companies and furthermore, the amount of wastage was predicted based on the experience of the person involved (Formoso
et al. 1999).
Since, there is a lack of quantification and segregation of construction waste in Malaysia, some of the models could be referred to in quantifying the quantity of waste for better management of construction wastes. However, further study should be done to ensure that the models suit the conditions in Malaysia.
ACKNOWLEDGEMENT
This study was funded by the Fundamental Research Grant Scheme (FRGS). It was also carried out as part of a research project entitled “Model Development for Estimating Materials Waste Generated from Building Projects” as a fulfillment of the Master's desertation in Civil Engineering at the Faculty of Civil Engineering, University Technology MARA, Malaysia.
Date of submission: May 2011 Date of acceptance: March 2013
REFERENCES
13 November 2009, The Star (Malaysia), 'Construction industry to see 3.5% growth'.
Agumuthu, P 2001, Solid waste: principles and management, Universiti Malaya, Kuala Lumpur.
Begum, RA, Siwar, C, Pereira, JJ & Jaafar, AH 2006, 'A benefit-cost analysis on the economic feasibility of construction waste minimisation: the case of Malaysia', Resources, Conservation and Recycling, vol. 48, pp. 86–98.
Cochran, KM & Townsend, TG 2010, 'Estimating Construction and demolition debris generation using a materials flow analysis approach', Waste Management, vol. 30, no. 11, pp. 2247–2254.
Department of Environment, Transports and the Regions (DETR) 2000, Building a better quality of life — a strategy for more sustainable construction, London.
Formoso, CT, Isatto, EL & Hirota, EH 1999, 'Method for waste control in the building industry', in Proceedings IGLC-7, University of California, Berkeley, CA, USA.
Franklin Associates 1998, Characterization of building-related construction and demolition debris in United States, U.S. Environmnetal Protection Agency.
Hendriks, CF & Pietersen, HS 2000, Sustainable raw materials: construction and demolition waste, RILEM Publication, Cachan Cedex, France.
Katz, A & H Baum 2010, 'A novel methodology to estimate the evolution of construction waste in construction sites', Waste Management, vol. 31, pp. 91–100.
KLPos.com Malaysia 2007, 12.7 Juta dijangka tinggal di Selangor pada tahun 2020.
Kofoworola, OF & Gheewala, SH 2009, 'Estimation of construction waste generation and management in Thailand', Waste Management, vol. 29, pp. 731–738.
Kourmpanis, B, Papadopoulos, A, Moustakas, K, Stylianou, M, Haralambous, KJ & Loizidou, M 2008, 'Preliminary study for the management of the construction and demolition waste', Waste Management & Research, vol. 26, pp. 267–275.
Lage, IM, Abella, FM, Herrero, CV & JLP Ordonez 2010, ‘Estimation of the annual production and composition of C&D debris in Galacia (Spain), Waste Management, vol. 30, pp. 636–645.
Malaysia-German Chamber of Commerce 2010, Market watch Malaysia 2010: construction industry.
Nasir, MH, Rakmi, AR, Yusoff, MK & Sulaiman, WNA 1998, 'Issues and problems of solid waste management in Malaysia', in Proceeding on National Review on Environmental Quality Management in Malaysia: Towards the Next Two Decades.
National Solid Waste Management Department 2010, Overview of solid waste management in Malaysia.
Nazirah, ZA 2010, 'Sustainable construction in Malaysia — developers’ awareness', International Journal of Human and Social Science, vol. 5, no. 2, pp. 122–129.
Ogawa, H 1996, 'Sustainable solid waste management in developing countries', in 7th ISWA international Congress and Exhibition.
Pereira, JJ 2007, 'Waste Management in the construction industry-issues and challenges', in Managing construction waste in Malaysia, eds JJ Pereira, MD Jantan & G Sundaraj, Malaysia: Institute for Environment and Development (LESTARI).
Solis-Guzman, J, Marrero, M, Maria Victoria, M-D & Ramirez-de-Arellano, A 2009, 'A Spanish model for quantification and management of construction waste', Waste Management, vol. 29, pp. 2542–2548.
Tang, HH & Larsen, IB 2004, 'Managing construction waste — a Sarawak experience', DANIDA / Sarawak Government UEMS Project, Natural Resources and Environmental Board (NREB).