CFD Simulation and Optimization of Factors
Affecting the Performance of a Fluidized Bed Dryer
Nazghelichi, Tayyeb
Department of Agrotechnology, College of Abouraihan, University of Tehran, Pakdasht, I.R. IRAN
Jafari, Arezou*+
Department of Chemical Engineering, Tarbiat Modares University, Tehran, I.R. IRAN
Kianmehr, Mohammad Hossein
Department of Agrotechnology, College of Abouraihan, University of Tehran, Pakdasht, I.R. IRAN
Aghbashlo, Mortaza
Department of Agricultural Machinery Engineering, Faculty of Agriculture Engineering and Technology, University of Tehran, Karaj, I.R. IRAN
ABSTRACT:
C
omputational Fluid Dynamics (CFD) is a computational technology that enables researchers to study the dynamics of things that flow. By using CFD, it is possible to build a computational model that represents a system under study. It not only predicts fluid flow behavior, but also the transfer of heat, mass, phase change, chemical reaction, mechanical movement, and stress or deformation of related solid. In this study, hydrodynamics behavior of a laboratorial fluidized bed dryer containing carrot cubes as well as heat transfer in the dryer was simulated using CFD. In addition, to understand the energy utilization the system was optimized using the Taguchi technique. Simulations were planned based on L9 orthogonal array of Taguchi, and they were conducted at inlet air temperatures 50, 60 and 70 ºC, bed depths 3, 6 and 9 cm and carrot cube dimensions 4, 7 and 10 mm. Results show that cube size and bed depth have the maximum and minimum contribution on the energy utilization ratio, respectively. According to the results inlet air temperature 70°C, cube size 4mm and bed depth 9cm were obtained as optimum conditions. Finally, a verification test was performed to confirm the validity of the used statistical method.KEY WORDS:CFD simulation, Fluidized bed dryer, Optimization, Taguchi technique.
INTRODUCTION
Carrot (Daucuscarota L.) is one of the important vegetables grown throughout the world containing high amounts of sugar [1] and it is known for its nutrient
contents besides appreciable amounts of B1, B2, B6 and B12 vitamins and minerals [2]. Carrot is cooked, dried to be used in instant soups or meals or consumed as raw.
*To whom correspondence should be addressed. +E-mail:[email protected]
Carrots are the highest carotene containing foods which makes dried carrot slices an excellent candidate for developing an oil free snack food [1].
Drying of fruit and vegetables is a subject of considerable importance for their preservation and storage [2]. Dried fruits and vegetables have a longer shelf life, which makes it possible to use them in different products. In most industrial processes at least one drying step exists, which means the removal of relatively small amounts of water or other liquid from the solid material to reduce the content of residual liquid to an acceptable low value. Various methods of drying have been developed for solids, and each method has its own characteristics [3]. Considering the thermal efficiencies of the drying process, fluidized bed dryers are extensively used in particulate foods drying because they ensure high intensities of heat and mass transfer accompanied by high rates of drying. Fluidized-bed dryer has found many applications in chemical, metallurgical and pharmaceutical industries. They have also been investigated as a potential method for obtaining high quality dried foodstuffs, including fruit, vegetables and grain [4].
It has become apparent in recent years that energy resources, especially natural gas and oil, are limited [5]. In practical applications drying is a process that requires high energy input because of latent heat of water evaporation and relatively low energy efficiency of industrial dryers [6]. Energy consumption in drying ranges from a low value of under 5% for the chemical process industries to 35% for the papermaking operations. The major costs for dryers are in their operation rather than in their initial investment costs and thus new ideas in drying methods and dryer design are required to optimize energy consumption [5] as well as operating conditions.
In its most general meaning, optimization is the effort and process of making a decision, a design, or a system as perfect, effective, or functional as possible [7]. Process optimization has always been a noble objective of engineers entrusted with the responsibility for process development and improvement throughout the food industry [8]. There are some methods for optimization of food processes that each method has its own characteristics.
Taguchi techniques with analysis of variance (ANOVA) are statistical methods primarily developed by Genichi Taguchi to improve the quality of manufactured
goods. It is potentially beneficial for determining the most desirable design of products, best parameters combination for processes and optimization processes. In addition, experiment can be performed with the minimum replication using the orthogonal arrays [9]. Estimation of temperature amounts and its distribution inside the fluidized bed dryer is very important and necessary for calculation of energy and exergy efficiencies and thus for design objectives.
The complexity of the fluid dynamics problem makes it difficult or impossible to exactly solve for equations of an object in a flow [10]. Computational fluid dynamics is a branch of fluid mechanicsthat uses numerical methods and algorithms to solve and analyze problems that involve fluid flows. Computers are used to perform the calculations required to simulate the interaction of liquids and gases with surfaces defined by boundary conditions. CFD is a fast growing technology that can be useful to obtain shorter product-process development cycles, to optimize energy requirements, to optimize existing processes and to efficiently design new products and processes [11]. CFD models have been significantly enhanced and calculation speeds have greatly increased, so that CFD has been used to simulate hydrodynamics in complex flows such as two-phase flow in packed beds [10], fluidized beds [12], stirred tank reactors [13] or flash calculations [14].
Recently, some studies on the optimization of food processes were done [15-25]. However, less work has been done on the CFD simulation and optimization of fluidized bed drying parameters using Taguchi technique. In addition, effect of particle size and bed depth on energy utilization of fluidized bed drying of moist material such as fruits and vegetables is not understood well.
Therefore, in this research a fluidized bed dryer has been simulated using CFD techniques, and the focus of the work was on optimization of parameters that have effect on the system such as particle size, bed depth and drying air temperature using Taguchi technique.
EXPERIMENTAL SECTION
Experimental set-up
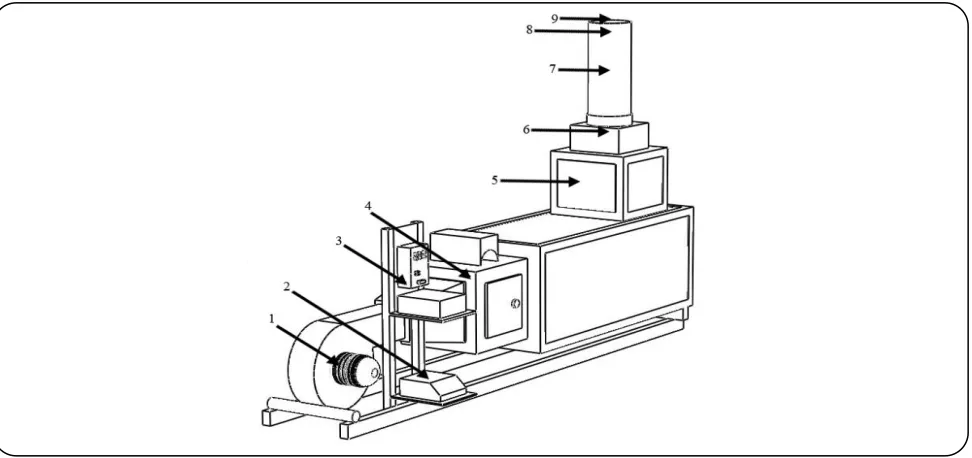
Fig. 1: Schematic view of the experimental equipment: blower (1); inverter (2); heaters control unit (3); heaters (4); chamber (5) thermocouple (6-8); fluidization cylindrical chamber (7) anemometer (9).
schematic view of experimental equipments. The Plexiglas cylindrical chamber has diameter 150 mm and height 300 mm. A centrifugal blower provided an air supply, drawn from ambient air. In order to supply the required airflow rate for fluidization of carrot cubes, the blower speed was changed by an inverter which operated directly on the blower motor. The dryer had an automatic temperature controller with an accuracy of ±1ºC. Air velocity was measured using an anemometer (PROVA AVM-07 TES, Co., Taipei, Taiwan) with an accuracy of ±0.05 m/s. Fresh carrots were obtained from a local market in Pakdasht, Iran and stored in a refrigerator at about 5 ºC. At the start of each experiment carrots were washed and cut into cubes manually, having dimensions of 4×4×4, 7×7×7 and 10×10×10 mm. The initial moisture content of the carrot was determined by drying of 50 g of sample in an oven at 105 ± 2 ºC. In this study the ambient temperature and environment air relative humidity were taken as, T∞ = 25°C and ϕ = 20%, respectively. The initial moisture content of the carrots was observed to be 89.3 ± 0.36% (kg water/ kg dry matter).
Simulated geometry
As the cylindrical drying chamber is the most important part, it has been simulated in this work. To save the computational time and cost, the symmetric cylinder was created as the drying chamber. In order to
generate the geometry and grid, commercial software, Gambit 2.3.16 was used.
Results are grid independent. A grid independency check has been performed, and the outlet air velocity magnitude at inlet air temperature 50°C, cube size 10 mm and bed depth 6 cm was considered to compare different grids. Results have been shown in Table 1. As the difference between numerical results in grid 2 and 3 is less than 0.1%, so to save cost and time grid 2 has been chosen for all tests.
THEORITICAL SECTION
Governing equations
The governing equations are as follow:
The equation for conservation of mass, or continuity equation, is:
( )
0 t∂ρ
+ ∇ ⋅ ρ ϑ =
∂ (1)
Conservation of momentum has been described by:
( )
(
)
p( )
gt ∂
ρϑ + ∇ ⋅ ρϑϑ = −∇ + ∇ ⋅ τ + ρ
∂ (2)
The stress tensor is given by:
(
T)
2 I3
Table 1: Air outlet velocity magnitude at different grids.
Grid 1 2 3
Number of elements 3×10⁴ 3×10⁵ 5.3×10⁵
Number of nodes 1.2×10⁴ 8.7×10⁴ 1.4×10⁵
Outlet velocity (m/s) 2.38 3.63 3.64
The second term on the right hand side shows the effect of volume dilation.
The energy equation is:
(
E)
(
(
E p)
)
t
∂ ρ + ∇ ⋅ ϑ ρ + =
∂ (4)
eff
eff j j j h
k T h J S
∇ ⋅ ∇ − + τ ⋅ ϑ +
keff is the effective conductivity (k+kt, where kt is the
turbulent thermal conductivity, defined according to the turbulence model being used). The first three terms on the right-hand side of the Eq. (4) represent energy transfer due to conduction, species diffusion, and viscous dissipation, respectively. Sh includes the heat of chemical reaction,
and any other defined volumetric heat sources. In Eq. (4):
2 p E h 2 ϑ = − +
ρ (5)
where the sensible enthalpy, h, for ideal gases is defined as:
j j j
h= Y h (6)
In Eq. (6), Yj is the mass fraction of species j and:
ref
T j T p, j
h = C dT (7)
where Tref , is 298.15° .
The species transport equation is:
Y t ∂ρ
+ ∇ ⋅
∂ = −∇ ⋅JW (8)
where Y is the water mass fraction and J , the water W
mass flux, defined as:
W eff
J = −ρD ∇Y (9)
where Deff is the water effective diffusivity.
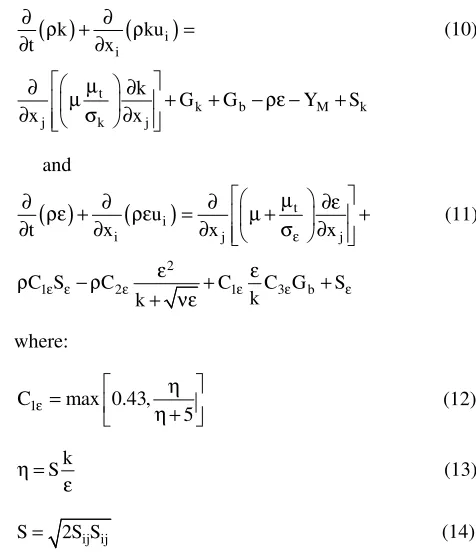
Turbulence Model
The realizable k-ε model has been chosen as the turbulence model. Transport equations for k and ε are:
( )
(
i)
i
k ku
t x
∂ ∂
ρ + ρ =
∂ ∂ (10)
t
k b M k
j k j
k
G G Y S
x x µ ∂ ∂ µ + + − ρε − + ∂ σ ∂ and
( )
(
)
ti
i j j
u
t x x ε x
µ
∂ ρε + ∂ ρε = ∂ µ + ∂ε +
∂ ∂ ∂ σ ∂ (11)
2
1 2 1 3 b
C S C C C G S
k k ε ε ε ε ε ε ε ε ρ − ρ + + + νε where: 1
C max 0.43, 5
ε
η =
η + (12)
k S η =
ε (13)
ij ij
S= 2S S (14)
In the above equations, Gk represents the generation
of turbulence kinetic energy due to the mean velocity gradients. Gb is the generation of turbulence kinetic
energy due to buoyancy. YM shows the contribution of
the fluctuating dilatation in compressible turbulence to the overall dissipation rate. σk , σε , C2ε and C1ε are constants and established to ensure that the model performs well for certain canonical flows. Constant values are represented in Table 2. Sk and Sε are source terms, and in the present work they were assumed zero.
The degree at which is affected by the buoyancy is determined by the constant C3ε:
3
Table 2: Constants in the turbulence model.
1.3 1
1.92 1.44
Table 3: The various parameters selected and their respective levels.
Factors Level 1 Level 2 Level 3
A: Bed depth 3cm 6cm 9cm
B: Cube size 4mm 7mm 10mm
C: Inlet air temperature 50°C 60°C 70°C
Energy Utilization
Thermodynamic analysis has appeared to be an essential tool for optimization and design of thermal systems. Energy utilization is the proportion of energy supplied to the fluidization chamber for drying of wet materials. Energy utilization ratio has been defined as the ratio of energy utilization to the useful energy given from heater [26]. Thus the energy utilization ratio is a proper dimensionless term and has been used as the objective function for optimization of the system.
Energy utilization can be calculated by applying the first law of thermodynamics [27]:
(
)
da dai dao
Eu=m h −h (16)
The mass flow rate of the air, mda, can be calculated
using the following equation [26, 28]:
da a a dc
m = ρ V A (17)
The enthalpy of drying air can be determined as follow [29]:
(
)
pda fg
hda=C T T− ∞ +h w (18)
The specific heat of inlet and outlet air, Cpda ,
was obtained by [29]:
pda
C =1.004 1.88w+ (19)
The below equation can be used to transform the relative humidity to humidity ratio of the air [26, 29-33]:
s s
P w 0.622
P P
ν ν
ϕ =
− (20)
Humidity ratio of outlet air is calculated by [31]:
dao dai da
DR
w w
m
= + (21)
The (DR) has been defined as:
t t t
W W
DR
t
+∆
− =
∆ (22)
The Energy Utilization Ratio (EUR) of drying chamber is calculated using the following equation [29]:
(
)
(
)
da dai dao da dai e
m h h
EUR
m h h
− =
− (23)
Numerical method
The computations were performed by commercial software, Fluent. The second order upwind discretization scheme was used to solve continuity, momentum, and energy equations. The pressure–velocity coupling has been obtained using SIMPLE algorithm. The initial temperature in the system was adjusted equal to ambient temperature 298 K. Boundary conditions of mass flow inlet and pressure outlet were applied for the bottom and top of the dryer, respectively. The side walls were insulated and no slip velocity was assumed. Turbulence predictions for the system were obtained using the realizable k-ε model.
Orthogonal array and simulation parameters
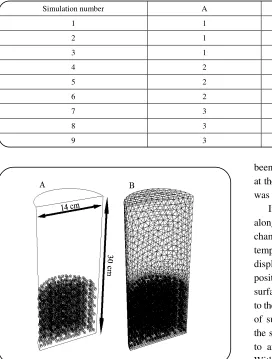
Table 4: Taguchi L9 orthogonal array design.
Simulation number A B C
1 1 1 1
2 1 2 2
3 1 3 3
4 2 1 2
5 2 2 3
6 2 3 1
7 3 1 3
8 3 2 1
9 3 3 2
Fig. 2: (a) Schematic of the geometry used in this study. Here, bed depth and cubic carrot size are 9cm and 4mm, respectively; (b) The generated grid by the size function.
RESULTS AND DISCUSSION
The schematic of the geometry and the grid used in simulations, have been illustrated in Fig. 2. As it can be seen in Fig. 2, the carrot cubes were randomly scattered in all over the specified height of bed. All Taguchi tests were performed and energy utilization ratio was calculated. The results have been displayed in Table 5.
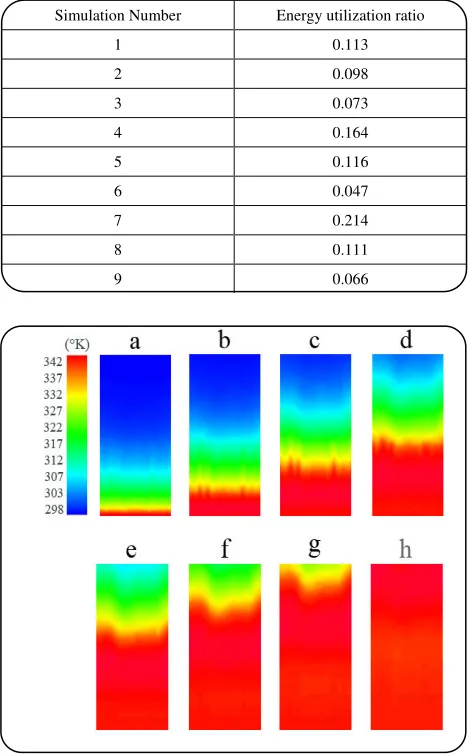
Temperature is the most important parameter that can be measured at every point inside the drying chamber for calculation of energy utilization at those points. Fig. 3 represents temperature contours of the drying chamber at different times. The hot drying air, crossing upward throughout the fluidization chamber, has lower amount of temperature toward the top of cylinder because of heat transfer from air to carrot cubes. All the simulations have
been conducted to reach the stable condition and thus at the end of the process, temperature of the entire cylinder was near the inlet air temperature.
In order to investigate the temperature distribution along the cylinder more accurately, the height of drying chamber has been divided to some layers (Fig. 4), and the temperature has been estimated in each layer. Fig. 5 displays variations of temperature versus time and surface position. As can be seen in Fig. 5, the temperature of first surface in the bottom of drying chamber was equal to the inlet air temperature in the first time step. Temperature of surfaces was decreased with increasing the height of the surfaces along the drying chamber and it became equal to ambient temperature at the top of drying chamber. With passing time, temperature of lower surfaces became equal to the inlet air temperature, and upper surfaces became warmer than the ambient temperature until the whole chamber reached the stable condition at the end of process.
Drying is a time-dependent simultaneous process of mass and heat transfer. Therefore, these transport phenomena were simulated simultaneously in this work. Fig. 6 represents the results of water diffusion inside the carrot cubes.
Table 5: Energy utilization ratio in Taguchi tests.
Simulation Number Energy utilization ratio
1 0.113
2 0.098
3 0.073
4 0.164
5 0.116
6 0.047
7 0.214
8 0.111
9 0.066
Fig. 3: Contour of total temperature in the case with bed depth 9cm, cube size 4mm and inlet air temperature 70°C at time steps: a) t=0.1s, b) t=0.2s, c) t=0.3s, d) t=0.4s, e) t=0.5s, f) t=0.6s, g) t=0.7s and h) t=0.8s.
Fig.4: Drying chamber divided to 5 layers by iso-surfaces.
move from the center of carrot toward its surface, therefore during the drying, water content near the carrot surface will increases. Volume fraction contours of water and its vectors obtained from numerical results, are in agreement with the natural process of drying.
With a low flow rate of the upward passed air through bed particles, a fixed bed will be the result. An increase in flow rate causes expanded bed particles and provides a minimal fluidized bed. In the carrot cubes with high initial moisture content, only the top layer of the bed is movable. The bottom layers remain expanded with negligible motion due to dominant cohesive forces exerted by wetted surfaces. In minimum fluidization condition, the pressure drop across the cubic carrot layer was reached the equivalent of the weight of particles in the bed divided by the area of the bed, in other words the frictional force between particles and air, counterbalanced the weight of the particles. As can be seen in Fig. 7 around a carrot cube in the fluidized bed, the boundary layer next to the upper surface of the carrot became thicker and then separated from the surface because of air viscosity. This separation of the boundary layer caused turbulent eddies within which energy was dissipated and which created an upward force on the particle known as form drag. The total force acting on the particle because of the air flow is then the sum of form drag and the viscous drag over the surface. Fig. 7 (a) shows the velocity vectors of air and viscous drag in the sides of a single carrot cube in the fluidized bed and the turbulent eddies in the top of the particle. Fig. 7 (b) shows the pressure contour. As it can be seen from the figure, there is a pressure drop across the single particle due to created eddies.
Results have been analyzed using Taguchi technique to rank factors that can affect the energy utilization ratio in a fluidized bed dryer. As Table 6 represents between factors listed in Table 3, bed depth and inlet air temperature have the maximum interaction. Cube size - inlet air temperature and bed depth - cube size are the other pairs that the interaction between them is significant.
Fig. 5: Variations of temperature versus time and surface position in bed depth 9cm, cube size 4mm and inlet air temperature 70°C.
Fig. 6: Volume fraction of water inside a carrot cube after (a) 0.01 s and (b) 0.07 s, (c) water vectors inside the carrot.
Fig. 7: (a) velocity vectors, and (b) contour of total pressure around a single carrot in the fluidized bed dryer.
Degree of freedom (DOF) for a factor is shown in second column of the ANOVA table and it is defined as:
DOF= −n 1 (24)
The sum of squares (S) in the third column of Table 7 for each factor is defined as:
(
)
2n
j t
j 1
S n m m
=
= ⋅ − (25)
The variance and percent of contribution of each factor is calculated as:
S Va
DOF
= (26)
N i 1
S Percent
S
DOF 100
DOF
=
=
× ×
(27)
The review of the ‘Percent’ column shows that the cube size factor contributed the highest percentage to the factor effects.
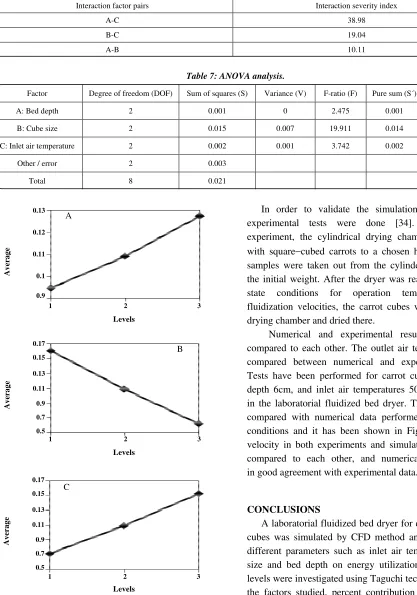
The averages of energy utilization ratio for all factors at each level were plotted in Fig. 8. From the highest value of average effects for each factor the best level can be determined. According to these figures level 3 of bed depth, level 1 of carrot cube size and level 3 of inlet air temperature can be obtained as the optimum condition.
The levels that cause maximum energy utilization ratio are listed in Table 8. Based on Taguchi technique the expected energy utilization ratio, which is the sum of the total contribution from all factors and the grand average value is 0.203. The different between the grand average value and the average effect of each factor correspond to its optimum level is contribution of each factor. The expected value should get when optimum conditions are applied.
The confirmation test is final and crucial step which is highly recommended by Taguchi to verify the conclusions [9]. In the stage of confirmation experiment, an extra simulation has been performed using the optimum conditions and obtained result were compared with the expected result at optimum condition (Table 8). The confidence interval of energy utilization ratio for this simulation was ±0.033 and it was within the 95% confidence level of the predicted optimal values. It means that prediction of Taguchi method is reliable.
Height of layers (cm)
0 7.5 15 22.5 30 343
338
333
328
323
318
313
308
303
298
T
em
p
er
a
tu
re
(
k
)
a b
c
Table 6 Interaction between factors.
Interaction factor pairs Interaction severity index
A-C 38.98
B-C 19.04
A-B 10.11
Table 7: ANOVA analysis.
Factor Degree of freedom (DOF) Sum of squares (S) Variance (V) F-ratio (F) Pure sum (S´) Percent P (%)
A: Bed depth 2 0.001 0 2.475 0.001 5.438
B: Cube size 2 0.015 0.007 19.911 0.014 69.707
C: Inlet air temperature 2 0.002 0.001 3.742 0.002 10.11
Other / error 2 0.003 14.745
Total 8 0.021 100
Fig.8: Average effects of factors for each level (A) Bed depth, (B) Cube size, and (C) Inlet air temperature.
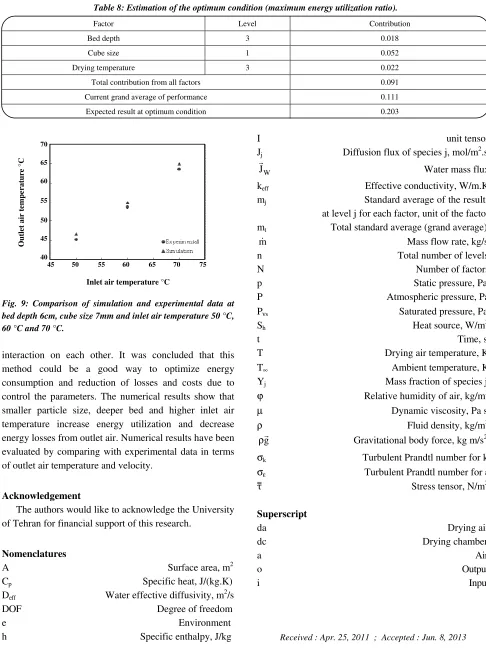
In order to validate the simulation results, three experimental tests were done [34]. Before each experiment, the cylindrical drying chamber was filled with square−cubed carrots to a chosen height and then samples were taken out from the cylinder to determine the initial weight. After the dryer was reached at steady state conditions for operation temperatures and fluidization velocities, the carrot cubes were put in the drying chamber and dried there.
Numerical and experimental results have been compared to each other. The outlet air temperature was compared between numerical and experimental data. Tests have been performed for carrot cubes 7mm, bed depth 6cm, and inlet air temperatures 50, 60 and 70°C in the laboratorial fluidized bed dryer. The results were compared with numerical data performed in the same conditions and it has been shown in Fig. 9. Outlet air velocity in both experiments and simulations were also compared to each other, and numerical results were in good agreement with experimental data.
CONCLUSIONS
A laboratorial fluidized bed dryer for drying of carrot cubes was simulated by CFD method and the effect of different parameters such as inlet air temperature, cube size and bed depth on energy utilization ratio at three levels were investigated using Taguchi technique. Among the factors studied, percent contribution of carrot cube size is more significant than other factors, and the pair bed depth-inlet air temperature has the maximum
Levels
1 2 3 0.13
0.12
0.11
0.1
0.9
A
v
er
a
g
e
Levels
1 2 3 0.17
0.15
0.13
0.11
0.9
0.7
0.5
A
v
er
a
g
e
1 2 3 0.17
0.15
0.13
0.11
0.9
0.7
0.5
A
v
er
a
g
e
Levels
A
B
Table 8: Estimation of the optimum condition (maximum energy utilization ratio).
Factor Level Contribution
Bed depth 3 0.018
Cube size 1 0.052
Drying temperature 3 0.022
Total contribution from all factors 0.091
Current grand average of performance 0.111
Expected result at optimum condition 0.203
Fig. 9: Comparison of simulation and experimental data at bed depth 6cm, cube size 7mm and inlet air temperature 50 °C, 60 °C and 70 °C.
interaction on each other. It was concluded that this method could be a good way to optimize energy consumption and reduction of losses and costs due to control the parameters. The numerical results show that smaller particle size, deeper bed and higher inlet air temperature increase energy utilization and decrease energy losses from outlet air. Numerical results have been evaluated by comparing with experimental data in terms of outlet air temperature and velocity.
Acknowledgement
The authors would like to acknowledge the University of Tehran for financial support of this research.
Nomenclatures
A Surface area, m2 Cp Specific heat, J/(kg.K)
Deff Water effective diffusivity, m2/s
DOF Degree of freedom e Environment h Specific enthalpy, J/kg
I unit tensor Jj Diffusion flux of species j, mol/m2.s
W
J Water mass flux
keff Effective conductivity, W/m.K
mj Standard average of the results
at level j for each factor, unit of the factor mt Total standard average (grand average)
m Mass flow rate, kg/s n Total number of levels N Number of factors p Static pressure, Pa P Atmospheric pressure, Pa Pνs Saturated pressure, Pa
Sh Heat source, W/m3
t Time, s T Drying air temperature, K T∞ Ambient temperature, K Yj Mass fraction of species j
ϕ Relative humidity of air, kg/m3
µ Dynamic viscosity, Pa s
ρ Fluid density, kg/m3 g
ρ Gravitational body force, kg m/s2
σk Turbulent Prandtl number for k
σε Turbulent Prandtl number for Stress tensor, N/m2
Superscript
da Drying air dc Drying chamber a Air o Output i Input
Received : Apr. 25, 2011 ; Accepted : Jun. 8, 2013 Inlet air temperature °C
45 50 55 60 65 70 75 70
65
60
55
50
45
40
O
u
tl
e
t
a
ir
t
em
p
e
r
a
tu
re
°
REFERENCES
[1] Sumnu G., Turabi E., Oztop M., Drying of Carrots in Microwave and Halogen Lamp Microwave Combination Ovens, Lebensmittel Wisst- Food Science and Technology, 38, p. 549 (2005).
[2] Kaya A., Aydın O., Demirtas C., Experimental and Theoretical Analysis of Drying Carrots, Desalination, 237, p. 285 (2009).
[3] Hatamipour M.S., Mowla D., Shrinkage of Carrots During Drying in an Inert Medium Fluidized Bed, Journal of Food Engineering, 55, p. 247 (2002). [4] Bialobrzewski I., Zielinska M., Mujumdar A.S.,
Markowski M., Heat and Mass Transfer During Drying of a Bed of Shrinking Particles Simulation for Carrot Cubes Dried in a Spout-Fluidized-Bed Drier, International Journal of Heat and Mass Transfer, 51, p. 4704 (2008).
[5] Mujumdar A.S., "Hand Book of Industrial Drying", 3rdEd, Marcel Dekker, New York (2006).
[6] Syahrul S., Hamdullahpur F., Dincer I., Exergy Analysis of Fluidized Bed Drying of Moist Particles, Exergy, an International Journal, 2, p. 87 (2002). [7] Tiza C., Liasakis G., "Extraction Optimization in
Food Engineering", Marcel Dekker, New York (2003).
[8] Simpson R., Almonacid S., López D., Abakarov A., Optimum Design and Operating Conditions of Multiple Effect Evaporators: Tomato Paste, Journal of Food Engineering, 89, p. 488 (2008).
[9] Taguchi G., Yokoyama Y., Wu Y., "Taguchi Methods/Design of Experiments", American Supplier Institute (ASI) Press, Tokyo, Japan (1993).
[10] Mousavi S.M., Jafari A., Chegini S., Turunen I., CFD Simulation of Mass Transfer and Flow Behaviour Around a Single Particle in Bioleaching Process, Process Biochemistry, 44, p. 696 (2009). [11] Jafari A., Zamankhan P., Mousavi S.M., Pietarinen K.,
Modeling and CFD Simulation of Flow Behavior and Dispersivity Through Randomly Packed Bed Reactors, Chemical Engineering Journal, 144, p. 476 (2008).
[12] Semnani Rahbar M., Alizadeh Dakhel A., Pressure Drop Prediction in Fluidized Bed Dryer of Sodium Perborate Using Computational Fluid Dynamics, Iran. J. Chem. Chem. Eng., 28 (2), p. 33 (2009).
[13] Gorji M., Bozorgmehry Bozzarjomehry R., Kazemeini M., CFD Modeling of Gas-Liquid Hydrodynamics in a Stirred Tank Reactor, Iran. J. Chem. Chem. Eng., 26 (2), p. 85 (2007).
[14] Irani M., Bozorgmehry Boozarjomehry R., Pishvaie S.M.R., Investigating the Effects of Mass Transfer and Mixture Non-Ideality on Multiphase Flow Hydrodynamics Using CFD Methods, Iran. J. Chem. Chem. Eng., 29 (1), p. 51 (2010).
[15] Alamprese C., Datei L., Semeraro Q., Optimization of Processing Parameters of a Ball Mill Refiner for Chocolate, Journal of Food Engineering, 83, p. 629 (2007). [16] Corzo O., Bracho N., Va´squez A., Pereira A.,
Optimization of a Thin Layer Drying Process for Coroba Slices, Journal of Food Engineering, 85, p. 372 (2008). [17] Erbay Z., Icier F., Optimization of Hot Air Drying of
Olive Leaves Using Response Surface, Journal of Food Engineering, 91 (4), p. 533 (2009).
[18] Hodali R., Bougard J., Integration of Desiccant Unit in Crops Solar Drying Installation: Optimization by Numerical Simulation, Energy Conversion and Management, 42, p. 1543 (2001).
[19] Oztop M.H., Sahin S., Sumnu G., Optimization of Microwave Frying of Potato Slices by Using Taguchi Technique, Journal of Food Engineering, 79, p. 83 (2007).
[20] SrinivasaRao P., Bal B., Goswami T.K., Modelling and Optimization of Drying Variables in Thin Layer Drying of Parboiled Paddy, Journal of Food Engineering, 78, p. 480 (2007).
[21] Souza J.S., Medeiros M.F.D., Magalha˜es M.M.A., Rodrigues S., Fernandes, F.A.N., Optimization of Osmotic Dehydration of Tomatoes in a Ternary System Followed by Air-Drying, Journal of Food Engineering, 83, p. 501 (2007).
[22] Tasirin S.M., Kamarudin S.K., Ghani J.A., Lee K.F., Optimization of Drying Parameters of Bird’s Eye Chilli in a Fluidized Bed Dryer, Journal of Food Engineering, 80, p. 695 (2007).
[23] Uysal N., Sumnu G., Sahin S., Optimization of Microwave-Infrared Roasting of Hazelnut, Journal of Food Engineering, 90 (2), p. 255 (2009).
[25] Zomorodian A., Zare D., Ghasemkhani H., Optimization and Evaluation of a Semi Continuous Solar Dryer for Cereals (Rice, etc), Desalination, 209, p. 129 (2007).
[26] Aghbashlo M., Kianmehr M.H., Arabhosseini A., Energy and Exergy Analyses of Thin Layer Drying of Potato Slices in a Semi-Industrial Continuous Band Dryer, Drying Technology, 26, p. 1501 (2008). [27] Syahrul S., Dincer I., Hamdullahpur F.,
Thermodynamic Modeling of Fluidized Bed Drying of Moist Particles, International Journal of Thermal Sciences, 42, p. 691 (2003).
[28] Ceylan I., Aktas M., Dogan H., Energy and Exergy Analysis of Timber Dryer Assisted Heat Pump, Applied Thermal Engineering, 27, p. 216 (2007). [29] Corzo O., Bracho N., Vasquez A., Pereira A.,
Energy and Exergy Analyses of Thin Layer Drying of Coroba Slices, Journal of Food Engineering, 86, p. 151 (2008).
[30] Topic R, Mathematical Model for Exergy Analysis of Drying Plants, Drying Technology, 13 (1-2), p. 437 (1995).
[31] Akpinar E.K., Energy and Exergy Analyses of Drying of Red Pepper Slices in Convective Type Dryer, International Journal of Heat and Mass Transfer, 31 (8), p. 1165 (2004).
[32] Akpinar E.K., Midilli A., Bicer Y., Energy and Exergy of Carrots Drying Process via Cyclone Type Dryer, Energy Conversion and Management, 46 (15/16), p. 2530 (2005).
[33] Akpinar E.K., Midilli A., Bicer Y., The First and Second Law Analyses of Thermodynamic of Pumpkin Drying Process, Journal of Food Engineering, 72 (4), p. 320 (2006).