MODELING INTERNET DIFFUSION IN DEVELOPING COUNTRIES
Scott McCoy
College of William & Mary, Williamsburg, VA Email: [email protected]
Hoon S Cha
Chung-Ang University, Seoul, Korea Email: [email protected]
Alexandra Durcikova University of Arizona, Tucson, AZ
Email: [email protected]
ABSTRACT
Despite the increasing importance of the Internet, there is little work that addresses the degree to which the models and theories of Internet diffusion in developed countries can be applied to Internet diffusion in developing countries. This paper presents the first attempt to address this issue through theory driven modeling of Internet diffusion. Consistent with previous research, our findings suggest that economic development and technology infrastructure are musts for Internet diffusion. Interestingly, users’ cognition and government policies can accelerate Internet diffusion only after a certain level of human rights has been reached in a developing country.
INTRODUCTION
Originally built as a research network of the U.S. government, the rapid diffusion of the Internet is now a universal phenomenon. In fact, the number of Internet users doubled between 2005 and 2010 and are fast approaching 2 billion worldwide (International Telecommunication Union, 2011). Much of the initial growth can be attributed to government funding that help Internet diffusion in educational institutions (Goodman et al., 1994). Now, the Internet has become part of everyday life for many people after its commercialization and rapid growth.
the diversity in the number of current Internet users for each country (e.g. 420 million users in China, and 98,000 users in Gabon (InternetWorldStats, 2011).
In developing countries with high GDP, the Internet may lead to improved economic productivity (Jussawalla & Lamberton, 1988), awareness of the world, and quality of life, reducing the gap between developing and developed countries. In contrast, comparatively poor countries with low GDP are still facing a variety of problems in connection to the Internet such as a lack of telecommunication infrastructure and extremely high access costs, making it difficult to catch up with the fast global growth of the Internet. Developing countries have been deregulating their telecommunications sectors, but perhaps not fast enough to stimulate Internet growth. As noted by Dutta & Roy (2003), developing countries need policies to promote the Internet like education, transportation, energy, and other services. A recent study in Kenya (Ochara, et al., 2008) found that although Internet penetration was making good progress in urban areas, rural areas lack the necessary infrastructure to support the Internet. These authors go onto discuss the critical role of the government in making sure the Internet is available to its citizens specifically with telecommunications policies that promote its growth.
In a recent study by Huang & Chen (2010), cultural, economic, and educational factors were found as the primary causes of the global digital divide across various Internet diffusion stages. A large scale Internet diffusion study (Andrés, et al., 2010) found that the degree of competition in the provision of the Internet contributes positively to its diffusion. Without immediate and appropriate support to developing countries, the rapid diffusion of the Internet in developed countries may widen the multidimensional gap, separating them from other nations, and exacerbating already significant practical problems (Wilson, 1999). Although the Internet and other information and communication technologies are fundamental to the socio-economic development of developing countries, the reality is that these countries are not in a position to exploit fully the potential of such technologies (Mbarika et al., 2002).
Consequently, it is essential to identify those factors that can help developing countries to overcome the digital divide. The goal of this research is to investigate a theoretical framework that can systematically identify the Internet diffusion process in order to help developing countries improve on those factors that are most likely to spur Internet diffusion. Therefore, our main research questions are:
Can we develop a global Internet diffusion model that can fit well in both developing countries and developed countries? If not, what are the major factors that make the Internet diffusion in developing countries different from developed countries? As illustrated by Dutta & Roy (2003), models are useful because they provide insight into the mechanics of growth for a wide range of constituents. But, “simple models that assume contagion effects as the basis for Internet diffusion are inadequate, due to the inability to recognize the social system into which the Internet is now diffusing” (Goodman, et al., 1998, p. 106). We have attempted to address these inadequacies in our research.
MODEL DEVELOPMENT
Lawson, Alcock, and Cooper, 2002; Pease and Rowe, 2005) and focused on electronic commerce (Okoli, Mbarika, and McCoy, 2010), a longer-term economic benefit of Internet diffusion. Internet diffusion has been explored as an organizational adoption and diffusion study with respect to a specific type of innovation. Most of earlier studies focused on general Internet diffusion patterns to show the rapid increase in Internet usage. On the other hand, because this approach has some limitations in explaining the complex aspects of Internet diffusion processes, it has been augmented with a number of contextual analyses, highlighting the multi-faceted factors embedded in the Internet diffusion process.
Internet Diffusion Pattern Modeling
Research in this area has focused on descriptive models of the diffusion patterns in terms of either pre-specified distribution functions or descriptive statistics, providing insights into mechanical aspects of the diffusion processes. Early Internet diffusion models focused on predicting the number of user by fitting a curve on the available data, either specific network data (Gurbaxani, 1990) or global data (Rai et al., 1998).
Later, researchers tried to model Internet diffusion in different countries (Dutta & Roy, 2003, Lin, 2002). These studies showed that the Internet hosts are growing fast world wide, but are not uniformly distributed especially between developing and developed countries. They emphasized the importance of possible economic and social problems followed by the imbalanced development between countries (Petrazzini & Kibati, 1999).
Contextual Analysis of Internet Diffusion Process
Internet diffusion pattern studies provide ample information regarding the overall picture of Internet diffusion; however, they tend to offer a relatively simple view to explain the complex aspects of the Internet diffusion process. Limitations of the Internet diffusion pattern studies motivated researchers to consider a wider range of factors that could possibly influence the diffusion process. For this purpose, a number of multifaceted contextual analyses have been conducted that incorporated indicators that represent the ‘supply’ and/or ‘demand’ side of Internet diffusion (Lee et al., 2003). The supply side of Internet diffusion can be represented by indicators of economic development, technology infrastructures, and the role of the government as they correspond to the necessary conditions for Internet diffusion. The demand side of Internet diffusion can be represented by socio-cultural factors, user’s perceptions, and user’s demand for the Internet. The demand side stands for an actual user’s interest in the Internet.
The contextual factor analysis provides a better understanding of Internet diffusion in both developed and developing countries. These factors are specific to each country and should be included in any model that tries to understand the global diffusion of the Internet. Drawing mostly on the research for developed countries, we propose that Internet diffusion is determined by five prevailing factors: economic factors, technology infrastructure, socio-cultural factors, user cognition and needs for the Internet, and government policies and regulations. To test the aforementioned proposition, a series of testable hypotheses are developed based on each of these factors.
Economic Factors
of capital, and the necessary resources such as government investment are more likely to be present in richer countries. More formally stated,
H1: The wealthier a country the higher the Internet penetration. Technology Infrastructure
The Internet must be readily available to expect its adoption. Thus, widespread diffusion of the Internet is associated with a country’s technology infrastructure (Beilock & Dimmitrova, 2003, Choudrie & Lee, 2002, Goodman et al., 1994, Lee et al., 2003). The number of existing phone lines and mobile phones (Mutula, 2002, Press, 1997, Zhao, 2002), broadband connections (Lee et al., 2003, Mutula, 2002), and bandwidth of the network (Goodman et al., 1994) are relevant infrastructures to access the Internet. Moreover, the lack of interregional infrastructures such as fiber optical backbones in developing countries make it difficult for them to communicate with their neighboring countries since the connections need to be routed through industrialized countries with higher costs (Petrazzini & Kibati, 1999). Therefore, we posit that:
H2: The better the telecommunication infrastructure in a country the higher the Internet penetration. Socio-cultural Factors
Socio-cultural factors represent the demand-side of Internet diffusion. Madon (2000) argues that the relationship between Internet diffusion and a country’s socio-economic development is interrelated. If a society encourages people to access and use new ideas and new ways of getting information form various sources they will be more likely to use the Internet (Beilock & Dimmitrova, 2003, Zhu and He, 2002). Other factors that describe the socio-cultural environment of a country were shown to be significant to Internet growth were education (Kiiski & Pohjola, 2002) and Human Development Index (HDI) (Press, 1997). Therefore:
H3: The higher a country’s human development the higher the Internet penetration. User Cognition and Needs for the Internet
An Internet user’s cognition and needs play an important role in the diffusion process. According to Zhu and He (2002), the diffusion process is affected by three cognitive factors: perceived characteristics of the Internet (e.g., relative advantage, compatibility, ease of use), perceived popularity of the Internet (e.g. the proportion of Internet users among relatives/friends/acquaintances), and perceived need for the Internet (e.g., need for news, personal information, entertainment). Use of the Internet empowers consumers by supplying almost zero search costs and perfect information about goods and services (Hamel &
Sampler, 1998). This empowerment is associated with China’s recent rapid growth of the Internet mainly because of wide popularity of e-commerce and online banking (Zhao, 2002). In addition, the spread of online gaming and video/audio streaming (Lee et al., 2003) and the number of people engaged in information related occupations (Madon, 2000) influence the perceived popularity of the Internet. Thus, we expect that:
Government Policies and Regulations
The role of the government and its policies were also recognized as critical factors in the evolution of the Internet (Kahn, 1994, Kraemer et al., 1992). For successful Internet usage in a nation, the government has to lead in building and maintaining national backbones (Goodman et al., 1994, Press, 1997), balance the development between rural and urban areas (Mutula, 2002, Zhao, 2002), and support organizations such as schools to access the Internet (Goodman et al., 1994, Press, 1997). Government has the ability to accelerate the interested parties to participate in developing the infrastructure of the Internet in a fair and equitable way (Kahn, 1994). Cost and pricing of the Internet services (Dutta & Roy, 2003, Kiiski & Pohjola, 2002), connection speed (Zhao, 2002), as well as the degree of competition of the Internet Service Providers (ISPs) have been documented as serious obstacles to the rapid diffusion of the Internet (Petrazzini & Kibati, 1999). Generally, in low-income countries, monopoly conditions are still the prevailing type of telecommunication industries (Petrazzini & Kibati, 1999). Hence, the lack of competitiveness is perhaps the biggest single factor responsible for the high costs to access the Internet. Lee (2003) observed that aggressive strategies and promotions between ISPs under competitive market structures promoted quicker Internet adoption in South Korea. The differences in the business environments and market characteristics between various countries are mainly decided by the government’s relevant regulations (Petrazzini & Kibati, 1999), creating great disparity in Internet diffusion between countries. Thus:
H5: Higher levels of government support lead to higher levels of Internet penetration. DATA AND VARIABLES
To test the above hypotheses, a total of 182 countries were studied. These countries were separated into three categories for comparison purposes. First, 52 developed countries were selected based on the list made by the UN (United Nations, 2004). A set of 130 developing countries were further divided into two categories using a median split of GDP. There were 65 (Group I) countries with GDP per capita higher than $1,201.5 and 65 (Group II) countries with GDP per capita lower than $1,201.5. The data were collected from the Worldbank, UN, Freedom House, and ITU. Appendix A provides details about the selected variables and data sources. This separation allowed us to control for economic differences between countries and explore in more detail the role of non-economic factors in global Internet diffusion.
Outcome variables
To measure the level of Internet diffusion for each country, the number of individual computers connected to the Internet per 10,000 inhabitants in 2003 was used. The reason why this variable was used in the model is that the number of hosts (i.e., the number of PCs that are connected to the Internet) is normalized by dividing it with each country’s population to reduce the exogenous effects of population size.
Explanatory variables
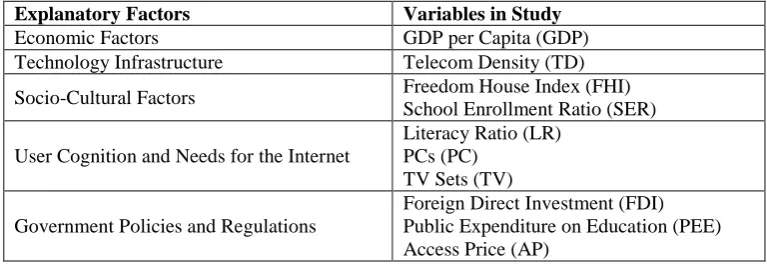
Explanatory Factors Variables in Study
Economic Factors GDP per Capita (GDP)
Technology Infrastructure Telecom Density (TD)
Socio-Cultural Factors Freedom House Index (FHI) School Enrollment Ratio (SER)
User Cognition and Needs for the Internet
Literacy Ratio (LR) PCs (PC)
TV Sets (TV)
Government Policies and Regulations
Foreign Direct Investment (FDI) Public Expenditure on Education (PEE) Access Price (AP)
Table 1: Mapping of Explanatory Factors and Variables
Following the work of other researchers (e.g., Beilock & Dimmitrova 2003; Lucas & Sylla 2003), GDP per capita was used to measure the economic wealth of the country. Teledensity was used as a proxy for technological infrastructure (Beilock & Dimmitrova, 2003, Lucas & Sylla, 2003, Mutula, 2002, Press, 1997, Zhao, 2002) and was calculated by summing up the number of main telephone subscribers and cellular phone subscribers as they represent modes of connecting to Internet. The important socio-cultural factors relevant to the Internet diffusion are educational environment (Kiiski et al., 2002) and the Freedom House Index (FHI). The educational environment was coded as a combined gross enrollment ratio for primary, secondary, and tertiary schools. FHI represents a broad range of political and personal freedoms enjoyed in reality, not in declared documents and policies (Beilock & Dimmitrova, 2003). An Internet user’s cognition and needs for the Internet is assumed to be related with a person’s eagerness to get the latest technology or tendency to get information from a communication media. Therefore, we used the number of TV sets in use per 1,000 people, and number of PCs (Zhao, 2002) in use per 1,000 people as a proxy for this variable. It is important to note that the number of PCs is different from number of hosts (i.e., an outcome variable) because PCs are not necessarily connected to the Internet. Moreover, literacy ratio, defined as the percentage of population aged of 15 years and over who can both read and write with understanding (UNESCO, 2004), was used as an additional proxy as without being literate one would not attempt to search for information on the Internet. It is important to define the difference between literacy ratio and school enrollment ratio. The school enrollment ratio takes into account only the school-age population. Therefore, in any country, there might be a significant proportion of adults that are not literate. This is especially true in developing countries where the literacy ratio is low. Finally, we used foreign direct investment (Zhao, 2002), public expenditure on education (Lee et al., 2003) as % of GDP, and access price as the sum of charges from ISPs and telephone usage (Aladwani, 2003, Petrazzini & Kibati, 1999, Zhao, 2002) to measure the government’s efforts to expedite the Internet diffusion, assuming that the lower access price will result in a more competitive market structure.
Regression Model
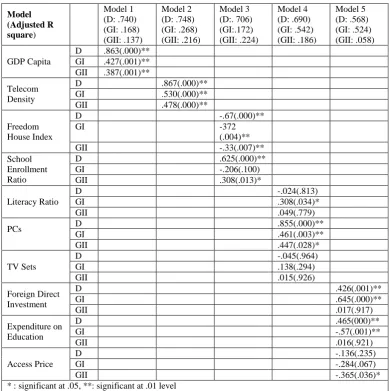
Regression models were developed and each hypothesis was tested separately for the three groups of countries (developed, developing Group I, and developing Group II). A series of five regression models were tested (for each group of countries) and the results are shown in Table 2.
Model 1: ln (number of Internet hosts) = 0 + 1 ln (GDP)
Model 2: ln (number of Internet hosts) = 0 + 1 ln (TD)
Model 4: ln (number of Internet hosts) = 0 + 1 (LR) + 2 ln (PC) + 3 ln (TV)
Model 5: ln (number of Internet hosts) = 0 + 1 ln (FDI) + 2 (PEE) + 3 ln (AP)
Table 2 shows the results. Within each group, no correlation exceeded the prescribed limit of 0.9 and none of the VIF factors exceeded the limit of 10 that would indicate serious multicollinearity (Hidebrant & Ott, 1995).
Model (Adjusted R square)
Model 1 (D: .740) (GI: .168) (GII: .137)
Model 2 (D: .748) (GI: .268) (GII: .216)
Model 3 (D:. 706) (GI:.172) (GII: .224)
Model 4 (D: .690) (GI: .542) (GII: .186)
Model 5 (D: .568) (GI: .524) (GII: .058)
GDP Capita
D .863(.000)**
GI .427(.001)**
GII .387(.001)**
Telecom Density
D .867(.000)**
GI .530(.000)**
GII .478(.000)**
Freedom House Index
D -.67(.000)**
GI -372
(.004)**
GII -.33(.007)**
School Enrollment Ratio
D .625(.000)**
GI -.206(.100)
GII .308(.013)*
Literacy Ratio
D -.024(.813)
GI .308(.034)*
GII .049(.779)
PCs D .855(.000)**
GI .461(.003)**
GII .447(.028)*
TV Sets
D -.045(.964)
GI .138(.294)
GII .015(.926)
Foreign Direct Investment
D .426(.001)**
GI .645(.000)**
GII .017(.917)
Expenditure on Education
D .465(000)**
GI -.57(.001)**
GII .016(.921)
Access Price
D -.136(.235)
GI -.284(.067)
GII -.365(.036)*
* : significant at .05, **: significant at .01 level
D stands for the developed countries, GI for Group I of the developing countries, GII for Group II of the developing countries
RESULTS
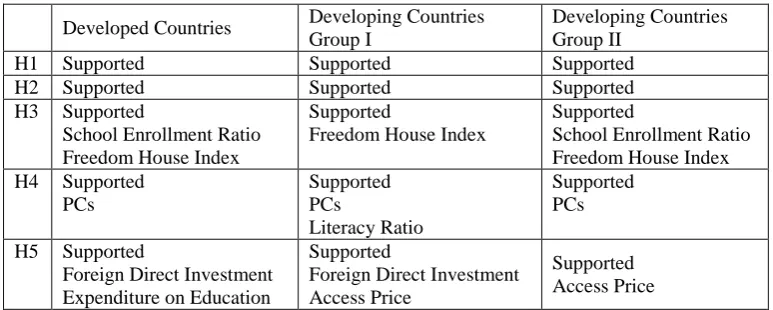
The goal of this paper was to investigate the degree to which models and theories of Internet diffusion in developed countries can be applied to developing countries. A diffusion model was represented by five hypotheses. The hypotheses were tested separately for three groups of countries, namely, developed countries, and developing countries Group I and Group II. The analysis of VIFs showed no problem with multicollinearity (VIF <2 for each variable in each regression) and the residuals followed the normal distribution.
Developed Countries Developing Countries Group I
Developing Countries Group II
H1 Supported Supported Supported
H2 Supported Supported Supported
H3 Supported
School Enrollment Ratio Freedom House Index
Supported
Freedom House Index
Supported
School Enrollment Ratio Freedom House Index H4 Supported
PCs
Supported PCs
Literacy Ratio
Supported PCs
H5 Supported
Foreign Direct Investment Expenditure on Education
Supported
Foreign Direct Investment Access Price
Supported Access Price
Table 3: Regression results for the Internet diffusion model
Every hypothesis was supported, although not every variable used in the regressions was significant. Also, the fit represented by R2adj of the overall model for different groups of countries was not at the
same level. One surprising result was that for Developing Countries Group I, the Expenditure on Education had a negative effect on Internet diffusion (see Table 3 for details). The detailed discussion of these findings is in the next section.
DISCUSSION
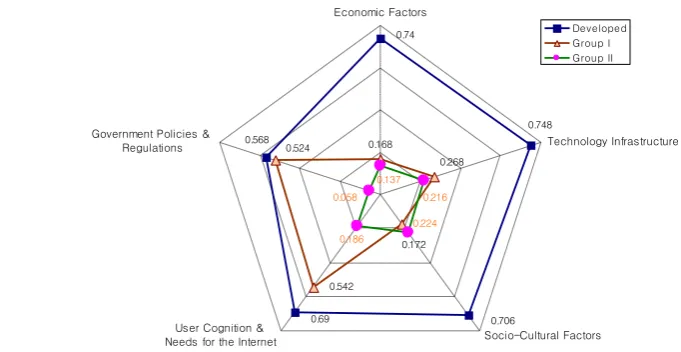
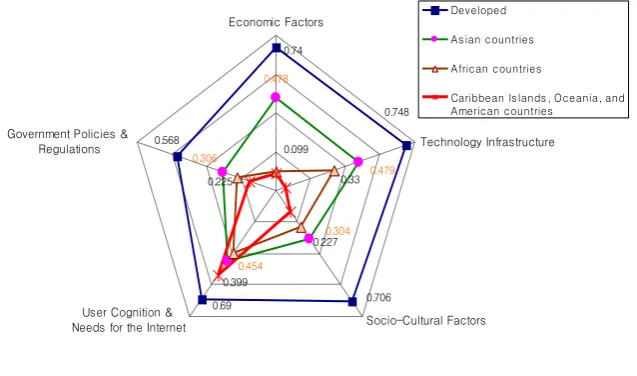
To get a better feel for what the regression analyses tell us, a radar graph was used. A radar graph allows us to plot several properties simultaneously (Figure 1). In our case, five different factors were hypothesized to influence the Internet diffusion and each factor is represented by an axis on the graph. The degree to which a factor affects the Internet diffusion is represented by adjusted R squared and a point on each of the axis is assigned to this value. Small values of adjusted R squared are near the center of the radar graph and large values are near the outer circumference. These points are then connected and color coded for different countries.
As the radar graph indicates, the five factors identified in our research are good predictors of Internet diffusion for developed countries. This is, however, not the case for developing countries. The most important predictors for Group I (GDP greater than $1200) are government policies and regulations and user cognitions and needs for the Internet. Internet diffusion for developing countries Group II cannot be satisfactorily explained by the factors investigated in this study.
While economic factors (H1), represented by GDP per capita, significantly affect Internet diffusion, the strength of this relationship is approximately six times stronger (R2adj = 0.74) for developed
Although GDP is most widely applied to explain the Internet diffusion (Hargittai, 1999, Kraemer et al., 1992) our results imply that economic factors alone do not explain Internet diffusion in developing countries and other factors need to be considered.
The next factor investigated was technology infrastructure (H2), which is represented by teledensity. While teledensity significantly affects Internet diffusion in developed countries (R2adj = .75), it is three
times less effective for developing countries (R2adj was 0.27 and 0.22). In addition, the importance of
economic factors and technology infrastructure are almost equally important for developed countries, the technology infrastructure is almost twice as important as economic factors for developing countries.
0.69 0.568
0.748 0.74
0.706 0.524
0.268 0.168
0.542
0.172
0.224 0.186
0.058 0.216
0.137 Economic Factors
Technology Infrastructure
Socio-Cultural Factors User Cognition &
Needs for the Internet Government Policies &
Regulations
Developed Group I Group II
Figure 1. Model Fit Comparison Radar Graph (R2adj)
Socio-cultural factors (H3) were represented by the Freedom House Index (FHI) and school enrollment ratio. FHI, the level of civil liberties in a country, is a significant predictor of Internet diffusion in all three groups of countries as this index represents the degree to which people within a society are able to access and use new ideas including search for information from various sources (Beilock & Dimmitrova, 2003). Our results do not support Kiiski et al. (2002) argument that education becomes important only for developing countries. To the contrary, school enrollment ratio was a significant predictor for developed countries (p-value = 0.000) and Group II developing countries (p-value = 0.013) but not for Group I countries (p-value = 0.100). Also, when looking at the overall fit, socio-cultural factors in developed countries (R2adj = 0.71) were three to four times as
important as they are in developing countries (R2adj was 0.17 and 0.22). One possible explanation for
User cognition and needs for the Internet (H4) was modeled via literacy ratio, number of PCs, and number of TV sets. Number of TV sets did not predict the diffusion of Internet neither for developed nor for developing countries. As hypothesized, the number of PCs strongly predicted the Internet diffusion in both developed (p-value = 0.000) and developing countries (p-value was 0.003 and 0.028), however, in developed countries the number of PCs was twice as important in predicting Internet diffusion as in developing countries. Moreover, the literacy ratio was significant for Group I that represents the wealthier countries (p-value = 0.03). While in developed countries the infrastructure for the Internet already exists and therefore most of the population that owns a PC is connected to the Internet; in developing countries, owning a PC does not necessarily mean that one can also connect to the Internet. This argument can also be supported by the significant difference in R2adj between Group I (0.54) and Group II (0.19).
The last factor investigated is government policies and regulations (H5). It was represented by foreign direct investment, public expenditures on education, and Internet access price. Access price had a very weak effect on Group II even though it’s the only significant predictor of Internet diffusion for this group of countries (R2adj = 0.06). Group I was affected by access price; however, the other two
factors play a more important role in Internet diffusion. Overall, it seems that other items within this factor decrease the importance of access price. Public expenditure on education as percent of GDP and foreign direct investment were both significant for developed countries (R2adj =0.57) and
developing countries Group I (R2adj =0.52) but not for Group II. Foreign investment, most of the time,
comes from multinational corporation that decide to open subsidiaries. The Internet represents an effective way in the management of such a network of organizations located in different countries (Icasati-Johanson & Fleck, 2003). This indicates that the presence of foreign investment can lead to Internet diffusion.
Interestingly, foreign investment was not significant for developing countries Group II. Further analysis showed that the average foreign investment for Group II (1,092 M $) was the smallest out of the three groups; Group I (1,612 M $) and developed countries (9,915 M $). Clearly, developed countries have stable economies and it is attractive to invest in these countries (Robison & Crenshaw, 2002, Zhao, 2002). The difference between Group I and Group II does not seem to be significant when looking at the average value. However, the distribution of foreign investment shows that 60% of all foreign investments for Group II is less then 100 M$; while for Group I 60% of foreign investments is greater than 100 M$. Therefore, for foreign investments to have a significant effect on Internet diffusion, the majority of investments have to be above a threshold value. What that exact threshold value is should be a focus of future research.
In conclusion, there is a significant difference between the model fit for developed and developing countries that suggests that a broader spectrum of factors need to be taken into consideration when trying to understand and support the expansion of the Internet in developing countries.
IMPLICATIONS AND FUTURE RESEARCH
The results of this study have several interesting implications for both researchers and practitioners focused on Internet diffusion in developing countries. There seems to be a clear difference in Group I and Group II. The leading factors for Internet diffusion in Group I are user cognition and need for Internet, government policies and regulations, and technology infrastructure. In Group II, the leading factors are technology infrastructure and socio-cultural factors. The importance of technology infrastructure is not surprising and it was suggested by several researchers in previous studies. The importance of socio-cultural environment for Group II suggests that Internet diffusion is suppressed because these countries struggle with basic human rights (e.g., high FHI values and low school enrollment ratio). Once a country reaches a certain level of human rights and economic development (GDP greater than $1200), as those in Group I developing countries, user cognitions and government policies become important. The most interesting finding in Group I relates to foreign direct investment. In order to spur Internet diffusion the amount of foreign direct investment has to reach a certain threshold value. The actual number should be the focus of future research.
0.478
0.227
0.706 0.74
0.748
0.568
0.69
0.479 0.306
0.454
0.304
0.399 0.099
0.33 0.225
Economic Factors
Technology Infrastructure
Socio-Cultural Factors User Cognition &
Needs for the Internet Government Policies &
Regulations
Developed
As ian countries
African countries
Caribbean Is lands , Oceania, and American countries
Figure 2. Model Fit Comparison Radar Graph (R2adj)
the argument that socio-cultural factors should not be omitted when studying Internet diffusion in developing countries.
From a methodological perspective, this research is subject to the anticipated limitations of modeling research. This research employs a cross-sectional methodology at the country level and this does not allow us to account for longitudinal effects of the factors investigated. Furthermore, the digital divide can be observed not only at the country level but also at a regional level within each country. Our level of analysis does not allow us to control for this type of granularity and we refer the reader to the work of Wolcott et al. (2001) who investigated digital divide at a more granular level. While we attempted to include all of the most appropriate variables there is a possibility that we failed to include some important variables. Because our model is theory driven and we checked a variety of possible data sources, the likelihood of omitting essential variables was reduced. One of the variables that would be a good indicator of culture is Hofstede’s cultural dimensions (Hofstede, 2003). Since only 68 countries are surveyed on Hofstede’s cultural dimensions and we focused on 181 countries, these variables could not be included in our analysis.
Another important variable that we were unable to track specifically is mobile phones. At the end of 2010, the developing world had 73% of the total worldwide mobile subscriptions (International Telecommunication Union, 2011). In recent years, smart phones have become an increasingly popular medium of accessing the Internet. A recent study on mobile Internet diffusion (Akiyoshi & Ono, 2008) argues that lower startup costs and accessibility of mobile phones relative to personal computers could be an alternative for users in overcoming unequal access to ICTs. Making the mobile Internet easy to use, compatible with users' lifestyles (Yong & Hongxiu, 2010), and secure (Goodman & Harris, 2010) will promote the use of technology. A recent paper focused on the cross-country diffusion of personal computers and the Internet found that the diffusion of one is complimented by the diffusion of the other (Dewan, Ganley, and Kraemer, 2010). Interestingly, these authors found that the impact of personal computers on Internet diffusion was substantially stronger in developing countries compared to developed ones. These authors argue that their results suggest that these codiffusive effects are a significant driver of the narrowing of the digital divide. Looking towards mobile phones and their explosive growth in developing countries, one could argue that the use of mobile smart phones could help narrow the digital divide, as well. Future research should look at this.
CONCLUSION
The above findings suggest that the factors affecting the Internet diffusion in developed countries do not provide a good fit for modeling Internet diffusion in developing countries. This result implies that Internet diffusion is a complex social phenomenon and more specific qualitative factors in developing countries which were not captured in the current model may exist. Therefore, regarding future research on this topic, an important next question includes how to develop a new Internet diffusion model for developing countries that can explain more than the existing model.
REFERENCES
Akiyoshi, M. and Ono, H. (2008) “The Diffusion of Mobile Internet in Japan”, Information Society, 24 (5) 292-303.
Aladwani, A. M. (2003) "Key Internet characteristics and e-commerce issues in Arab countries." Information Technology, (16) 1.
Andrés, L., Cuberes, D., Diouf, M., and Serebrisky, T. (2010) “The Diffusion of the Internet: A cross-country analysis,” Telecommunications Policy, 34 (5/6) 323-340.
Beilock, R. and Dimmitrova, D.V. (2003) "An exploratory model of inter-country Internet diffusion,” Telecommunications Policy, 27, 237-252.
Choudrie, J. and Lee, H. (2002) "Broadband development in South Korea: Institutional and Cultural factors," European Journal of Information Systems, 13,103-114.
Dewan, S., Ganley, D., and Kraemer, K. (2010) “Complementarities in the Diffusion of Personal Computers and the Internet: Implications for the Global Digital Divide,” Information Systems Research, 21 (4) 925-940.
Dutta, A. and R. Roy (2003) "Anticipating Internet Diffusion," Communications of the ACM, 46 (2) 66-71.
Fukuyama, F. (1999) The Great Disruption: Human Nature and the Reconstitution of Social Order. New York: Free Press.
Gibbs, J., Kraemer K. L., and Dedrick, J. (2003) "Environment and policy factors shaping global e-commerce diffusion: A cross-country comparison," The Information Society, 19 (1) 5-18. Goodman, S. and Harris, A. (2010) “The Coming African Tsunami of Information Insecurity,”
Communications of the ACM, 53 (12) 24-27.
Goodman, S., Burkhart, G., Foster, W., Press, L., Tan, Z., and Woodard, J. (1998) “The Global Diffusion of the Internet Project: An Initial Inductive Study,” SAIC, Farifax, VA.
Goodman, S. E., Press, L. I., Ruth S. R., and Rutkowski, A. M. (1994) "The Global Diffustion of the Internet: Patterns and Problems," Communications of the ACM, 37 (8) 27-31.
Gurbaxani, V. (1990) "Diffusion in computing networks: The case of BITNET," Communications of the ACM, 33 (12) 65-75.
Hamel, G. and Sampler J. (1998) The E-corporation; More than just Web-based, it’s building a new industrial order. Fortune, 52-63.
Hargittai, E. (1999) "Weaving the Western web: explaining differences in Internet connectivity among OECD countries," Telecommunications Policy, 23, 701-718.
Hidebrand, D, Ott R. L (1998) Statistical Thinking for Managers, South-Western College Pub, 4th edition.
Hofstede, G. (2003) Culture's Consequences: Comparing Values, Behaviors, Institutions and Organizations Across Nations, 2 edition, SAGE Publications, Beverly Hills.
Huang, C. and Chen, H. (2010) “Global Digital Divide: A Dynamic Analysis Based on the Bass Model,” Journal of Public Policy and Marketing, 29 (2) 248-264.
Icasati-Johanson, B. and Fleck, S. J. (2003) Impact of E-Business Supply Chain Technology on Interorganizational Relationships: Stories From the Front Line. Sixteenth Bled Electronic Commerce Conference, Slovenia, Bled.
International Telecommunication Union, http://www.itu.int, last accessed May 11, 2011. InternetWorldStats, http://www.internetworldstats.com/, last accessed May 11, 2011.
Jussawalla, M. and Lamberton D. M. (1988) The Cost of Thinking: Information Economies of Ten Pacific Countries, Ablex Publishing Corp., Norwood, NJ.
Kahn, R. E. (1994) "The Role of Government in the Evolution of the Internet," Communications of the ACM, 37 (8) 15-19.
Kiiski, S. and Pohjola M. (2002) "Cross-country diffusion of the Internet,” Information Economics and Policy, 14 (2) 297-310.
Kraemer, K. L., Gurvaxani, V. and King J. L. (1992) "Economic development, government policy, and the diffusion of computing in Asia Pacific countries," Public Administration Review, 52 (2) 146-156.
Lawson, R., Alcock, C., and Cooper, J. (2002) “Diffusion of Electronic Commerce in Small and Medium Enterprises,” Australasian Journal of Information Systems, 9 (2), 123-134.
Lee, H., O'Keefe R. M., and Yun, K. (2003) "The growth of broadband and electronic commerce in South Korea: Contributing factors," 19 (1) 81-93.
Lin, J. (2002) A Comparison of Internet Diffusion Patterns in China and U.S. -- A preliminary study of longitudinal demographics of Internet population. IAMCR 2002 Conference, Spain, Barcelona.
Lucas, H. C. and Sylla, R. (2003) "The global impact of the Internet: Widening the Economic Gap Between Wealthy and Poor Nations. Prometheus, 21 (1).
Madon, S. (2000) "The Internet and socio-economic development: exploring the interaction," Information Technology & People, 13 (2) 85-101.
Mbarika, V., Raymond, J. and Byrd, T. A. (2002) "Growth of Teledensity in Least Developed Countries," Journal of Global Information Management 10 (2).
McCoy, S., Everard, A., and Jones, B., (2005) “An Examination of the Technology Acceptance Model in Uruguay and the US: A Focus on Culture,” Journal of Global Information Technology Management, Vol. 8, No. 2, pp. 27-45.
McCoy, S. and Mbarika, V., (2005) “Global Diffusion of the Internet VII - Teledensity Growth Strategies for Latin America: The Case of Colombia and Ecuador,” Communications of the Association for Information Systems, Vol. 16, pp. 26-56.
Mutula, S. M. (2002) "Current developments in the Internet industry in Botswana,” The Electronic Library, 20 (6) 504-511.
Okoli, C., Mbarika, V., and McCoy, S. (2010) “Expert Assessments of E-Business in Latin America and Sub-Saharan Africa: A Theoretical Model of National Infrastructure,” European Journal of Information Systems, Vol. 10, pp 5-20.
Ochara, N, Van Belle, J., and Brown, I. (2008) “Global Diffusion of the Internet XIII: Internet Diffusion in Kenya and Its Determinants – A Longitudinal Analyis,” Communications of the AIS, Vol. 2008 (23) 124-150.
Pal, A., Mbarika, V., Cobb-Payton, F., Datta, P., and McCoy, S. (2005), “Telemedicine Diffusion in a Developing Country: The Case of India,” IEEE Transactions on Information Technology in Biomedicine, Vol. 9, No. 1, pp. 59-65.
Petrazzini, B. and Kibati M. (1999) "The Internet in Developing Countries," Communications of the ACM, 42 (6) 31-36.
Press, L. (1997) "Tracking the global diffusion of the Internet," Communications of the ACM, 40 (11). Rai, A., Ravichandran, T. and Samaddar, S. (1998) "How to Anticipate the Internet’s Global
Diffusion," Communications of the ACM, 41 (1) 97-106.
Robison, K. K. and Crenshaw E. M. (2002) "Post-industrial transformations and cyber-space: a cross-national analysis of Internet development," Social Science Research, 31 (3) 334-363.
Rogers, E. M. (1995) Diffusion of Innovations, in Diffusion of Innovation, The Free Press, New York.
UNESCO (2004) I. F. S., Literacy and Non Formal Education Sector, 밚literacy rate, all adults.
United Nations, F.A.A.O. (2004) "Country Specification."
Van Akkeren, J. and Cavaye, A. (1999) “Confusion with Diffusion? Unravelling IS Difussion and Innovation Literature with a Focus on SME’s,” Australasian Journal of Information Systems, 7 (1), 60-67.
Wilson, E. (1999) "Meeting the Challenges of Internet Inequality," On The Internet, 5 (6) 26-30.
Wolcott, P., Press, L., McHenry, W., Goodman S., et al. (2001) "A Framework for Assessing the Global Diffusion of the Internet," Journal of the Association for Information Systems, 2 (6) 1-40.
Yong, L. and Hongxiu, L., (2010) “Mobile Internet Diffusion in China: An Empirical Study,” Industrial Management & Data Systems, 110 (3) 309-324.
Zhao, H. (2002) "Rapid Internet Development in China: A Discussion of Opportunites and Constraints on Future Growth," Thunderbird International Business Review, 44 (1) 119-138. Zhu, J. J. H. and He, Z. (2002) "Perceived Characteristics, perceived needs, and perceived popularity.
APPENDIX
Details about the source of the data set
List of countries
Developing Countries: Group I (64)
Developing Countries: Group II (65)
Developed Countries (52)
Angola, Bangladesh, Benin, Bhutan, Bolivia, Burkina Faso, Burundi, Cote d'Ivoire, Cambodia, Cameroon, Central African, Chad, Comoros, Congo, D.R. Congo, Djibouti, Ecuador, Eritrea, Ethiopia, Gambia, Ghana, Guinea, Guinea-Bissau, Guyana, Haiti, Honduras, India, Indonesia, Kenya, Lao P.D.R., Lesotho, Madagascar, Malawi, Mali, Mauritania, Mongolia,
Mozambique, Myanmar, Nepal, Nicaragua, Niger, Nigeria, Pakistan, Palestine, Papua New Guine, Paraguay, Philippines, Rwanda, S. Tom & Princ, Senegal, Sierra Leone, Solomon Islands, Sri Lanka, Sudan, Swaziland, Tanzania, Togo, Uganda, Vanuatu, Viet Nam, Yemen, Zambia, Zimbabwe
Algeria, Antigua & Barbu, Argentina, Bahamas, Bahrain, Barbados, Belize, Botswana, Brazil, Brunei Darussalam, Cape Verde, Chile, Colombia, Costa Rica, Cuba, Cyprus, Dominica, Dominican Rep., Egypt, El Salvador, Equatorial Guin, Fiji, French Polynesia, Gabon, Grenada, Guatemala, Iran (I.R.), Jamaica, Jordan, Korea (Rep.), Kuwait,
Lebanon, Libya, Macao, China, Malaysia, Maldives, Marshall Island, Mauritius, Mexico, Morocco, Namibia, New Caledonia, Oman, Panama, Peru, Samoa, Saudi Arabia, Seychelles, Singapore, St. Kitts and N, St. Lucia, St. Vincent, Suriname, Syria, Taiwan, China, TFYR Macedonia, Thailand, Tonga, Trinidad & Toba, Tunisia, Turkey, United Arab Emi, Uruguay, Venezuela
Definition of variables and data sources
Variable Definition Measurement Year Source
Internet Hosts
Individual computers connected to the Internet
Per 10,000 people 2003
ITU (Internet host data: Network Wizards, RIPE).
GDP Gross domestic
product Per capita 2002 Worldbank (2004)
Telecom Density
Sum of main telephone subscribers and cellular phone subscribers
Per 100 people 2002-2003 ITU World Telecommunications Indicators Database (2003) Freedom House Index
Civil liberties on a scale of 1 to 7. 1 represents the most free and 7
represents the least free.
Scale (1-7) 2004
Freedom House (2004) (Freedom in The World 2003-2004: The Democracy Gap)
Enrollment Ratio
Combined gross enrollment ratio for primary, secondary and tertiary schools
Ratio 2001-02 School year UNDP Human Development Report (2003) Literacy Ratio
Percentage of the population aged 15 years and over who can both read and write.
Ratio 2004
UNESCO, Institute for Statistics, Literacy and Non Formal Education Sector (2004)
PCs
Self-contained computers designed to be used by a single individual
Per 1,000 people 2002 ITU World
Telecommunications Indicators Database (2003)
TV Sets Television sets in
use Per 1,000 people 2002
Foreign Direct Investment
Net inflows of foreign investment to acquire a lasting management interest.
current US dollar 2004 Worldbank (2004)
Expenditure on Education
Public expenditure
on Education % of GDP /100 2002
UNESCO Institute for Statistics estimates
Access Price
Sum of ISP and telephone usage charges
Per 20 hours 2003
ITU World
Scattered diagram Comparison
Developing Countries: Group I
Developing Countries: Group II
Developed Countries
7.00 8.00 9.00 10.00 LN_GDP -6.00 -4.00 -2.00 0.00 2.00 4.00 6.00 8.00 LN_Hos ts
4.00 4.50 5.00 5.50 6.00 6.50 7.00 LN_GDP -4.00 -2.00 0.00 2.00 4.00 LN_Hos ts
5.00 6.00 7.00 8.00 9.00 10.00 11.00 LN_GDP -2.50 0.00 2.50 5.00 7.50 10.00 LN_ Hos ts
2.00 3.00 4.00 5.00 LN_Tel -6.00 -4.00 -2.00 0.00 2.00 4.00 6.00 8.00 LN _Ho st s
-2.00 -1.00 0.00 1.00 2.00 3.00 4.00 LN_Tel -4.00 -2.00 0.00 2.00 4.00 LN _Ho st s
1.00 2.00 3.00 4.00 5.00 LN_Tel -2.50 0.00 2.50 5.00 7.50 10.00 LN _Ho st s
-2.00 0.00 2.00 4.00 6.00 LN_PCs -6.00 -4.00 -2.00 0.00 2.00 4.00 6.00 8.00 LN_H osts
-3.00 -2.00 -1.00 0.00 1.00 2.00 3.00 LN_PCs -4.00 -2.00 0.00 2.00 LN_H osts
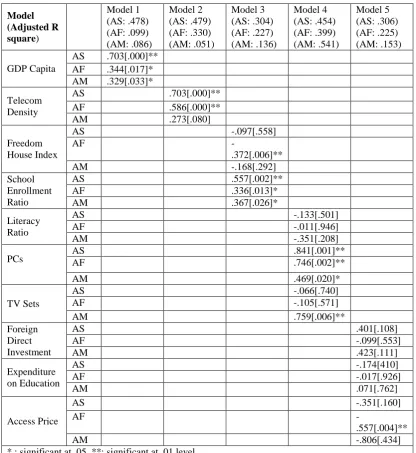
Table 5: Regression results for the Internet diffusion model (Region based)
Model (Adjusted R square)
Model 1 (AS: .478) (AF: .099) (AM: .086)
Model 2 (AS: .479) (AF: .330) (AM: .051)
Model 3 (AS: .304) (AF: .227) (AM: .136)
Model 4 (AS: .454) (AF: .399) (AM: .541)
Model 5 (AS: .306) (AF: .225) (AM: .153)
GDP Capita
AS .703[.000]** AF .344[.017]* AM .329[.033]*
Telecom Density
AS .703[.000]**
AF .586[.000]**
AM .273[.080]
Freedom House Index
AS -.097[.558]
AF
-.372[.006]**
AM -.168[.292]
School Enrollment Ratio
AS .557[.002]**
AF .336[.013]*
AM .367[.026]*
Literacy Ratio
AS -.133[.501]
AF -.011[.946]
AM -.351[.208]
PCs AS AF .841[.001]** .746[.002]**
AM .469[.020]*
TV Sets
AS -.066[.740]
AF -.105[.571]
AM .759[.006]**
Foreign Direct Investment
AS .401[.108]
AF -.099[.553]
AM .423[.111]
Expenditure on Education
AS -.174[410]
AF -.017[.926]
AM .071[.762]
Access Price
AS -.351[.160]
AF
-.557[.004]**
AM -.806[.434]
* : significant at .05, **: significant at .01 level