* To whom all correspondence should be addressed.
Application of Principal Components Analysis
Results in Visual Network Analysis
Andrey Sergeevich Denisenko and Grigory Olegovich Krylov
1National Research Nuclear University MEPhI (Moscow Engineering Physics Institute), 115409, Russia, Moscow, Kashirskoe highway, 31.
2Doctor of Physical and Mathematical Sciences, Financial University under the Government of the Russian Federation, 125993, Russia, Moscow, Leningradsky prospekt, 49.
DOI: http://dx.doi.org/10.13005/bbra/1704
(Received: 10 February 2015; accepted: 19 March 2015)
The paper deals with the application of principal components analysis in a roleof a preprocessor of the source data and its role in visual network analysis process. Such kind of PCA application provides highlighting the most valuable objects in the source selection. By the example of analyzing financial data of companies of certain industry in order to measure their activity level authors show that principal components analysis could be used as a preprocessor for further analysis. As a result of the research, they show the integration and visualization of the integral scores in the process of visual network analysis and their role in simplifying the large data processing.
Key words: Principal component analysis, Visual network analysis, Financial flows
The quantitative approach to analysis is the integral part of the economic and legal framework effectiveness assessment. Ranking of objects (for example, business entities) according to character and intensity of their financial activity allows to conduct the relevant monitoring and to analyze this effectiveness in dynamics.
One of the objectives set for the purposes of this analysis was to obtain the quantitative characteristics of companies of certain industry in some region of Russia.
The database that contain the financial transactions reports was used as the initial data source. On its basis, the dataset of statistical values characterizing the fishing industry companies’ financial transactions, as well as ones
conducted by their managers and shareholders, was obtained.
Each object (legal entity participating in the fishing industry or affiliated natural person) was described with a set of characteristics (features) – the vector’s components:
X = (X1, X2, …, Xn), Xi = (xi(1), xi(2),…,xi(p))T...(1) The vector of analyzed features (characteristics) xi(1), xi(2),…,xi(p), related to the i -object.
As the mathematics does not allow making comparison between vectors, scalarization of the vectors was required. The problem was solved with the dimensionality reduction from x(1),
x(2),…,x(p) z‘(1), z‘(2),…,z‘(p), where p‘<<p. There is
a wide spectrum of the dimensionality reduction algorithms. Although this approach does not allow to obtain the ideally precise assessment, the quality of results is sufficient for correct interpretations, due to:
correlated features;
a) Inconclusive features, that has weak variation among objects of the sample; b) Possibility of aggregation, i.e. simple or
weighted summation over some features.
METHOD
Basic well-known method of dimensionality reduction is expert estimations (expert methods). The main disadvantage of this method is that the implementation is not based on statistical information about the objects, but on the use of expert attitude to analyzed characteristic. Experts could be politicized or make their assessments on personal motives that affect the objectivity of the results, so that their qualification and objectivity significantly affect the result.
Other set of methods is multidimensional scaling. This is a set of methods. If we are given information about the difference or similarity between objects from the set, methods of multidimensional scaling provide assigning a vector of quantitative indicators for each object; the dimension of the original feature space is defined in advance. Placing analyzed objects in this space should be made in the way, where the mutual differences in structure or similarity between them measured by the auxiliary coordinates assigned to them, at least would differ from that set, depending on the particular functional quality. Multidimensional scaling should be applied if matrixes contain data of pairwise distances between objects, or their order relations. In this case, the researcher works with a matrix n × n, if it contains characteristics of pairwise proximity of objects, or p × p, if it contains the characteristics of pairwise proximity of features:
=(y), i, j = 1,2…m, m=n or m=p, ...(2) where the quantities ij are interpreted either as the distance between the objects (features) i and j, either as grades that give ordering of these distances. The main idea of multidimensional scaling is based on “placement” of objects (features) in a p’-dimensional space (p’ <<min (p,
n)). In other words, the objects should be placed in such space OZ(1),…,OZ(p’), that providesthe least
distortion of original geometry of the set of objects
defined by a (1) or (2) for some criteria for the average “degree of compression» (Z) of mutual pairwise distances.
Another suitable methods are method of extremal grouping of features and method of correlational galaxies (pleiades).Method of extremal grouping involves dividing characteristics of the original set of indicators into predetermined number of p’ groups Si, …, Sp’, so that features that belong to the same group are strong correlated, while the correlation between features that belong to different groups is weak. At the same time there is a replacement of each (i-) of strongly correlated auxiliary baseline indicator z (i), which is in close correlation with the characteristics of the group. Method of correlation galaxies, as well as the method of extremal grouping is designed to identify groups of such features - “ galaxies”, in which the correlation between parameters of one group (internal galaxy communication) is strong enough, and the relationship between the parameters of different groups (inter-galaxy communication) – is relatively weak. According to certain rules on the correlation matrix, connections between features could be visualized as a graph, which contains subgraphs. Elements (features) that correspond to each of the subgraphs, form a galaxy.
Some other tools that could be used under certain conditions are regression tools or distance weighted discrimination. Their application is described in19, 11.
Methods of factor analysis are based on idea, that structure of connections between p features x(1), x(2), …, x(p) could be explained by the fact, that features depend (linearly or somehow else) on less number of factors, that are not measured in obvious way (latent or “hidden” factors), f(1), f(2), … , f(p’) (p’ < p). Such factors are called common factors.
Normally, factors are orthogonal in the most models. In common situation, it is impossible to establish unique (determined) values of analyzed features x(j) by respective values of common factors
f(1), f(2), … , f(p’): it is assumed that each feature
depends on some specific (for it) residual component u(j) , that is the reason of statistical nature of connection between x(j)and f(1), f(2), … ,
f(p’) [3].
source features x(1), x(2), …, x(p)in the following way: the behavior of each feature statistically depends on the same set of factors f(1), f(2), … , f(p’)
−µ = . + = 1,2, … ,
=1
,
Where qi,v – loading of common factor f (v) to source feature x(j), u(j) – residual specific
component, E[f (v)] = 0, E[u(j)] = 0, D[f (v)] = 1, N f(1),
f(2), … , f(p’), u(1), u(2), … , u(p)pairwise orthogonal [4].
Principal components method (PCA)
In the majority of tasks on multidimensional observations processing and, in particular, in classification tasks, the researcher is interested in certain features that has the highest changeability (variance). On the other hand, while describing a status of an object it is not required to use some source (original) features that were got as a result of an experiment. For example, while buying clothes, normally it is enough to know only two parameters of human’s body (size, height), that are derived by a range of measures of the body. To define the statement of the problem mathematically, PCA could be defined through linear orthogonal transformations of the source features
) (
) (
)
( 1 (1) (1) ( ) ( )
)
( p p
jp j
j X c x c x
z
p
j j p
c 1 2 , , 2 , 1 , 1 k j p k j c c p k
j
1 , , 2 , 1 , , 0 I’(Z)-measure of self-descriptiveness, p 1 j p' 1 i )) ( ( j i p x z X Z I D D '
Overall,PCA is a combination of linear orthogonal transformations
The aim of the method is to reduce the dimensionality of multivariate data whilst preserving as much of the relevant information as possible. It is a form of unsupervised learning in that it relies entirely on the input data itself without reference to the corresponding target data.
First principal component z(1)(X) of a
system of features % =(x(1), x(2), …, x(p))’ is their normalized and centered linear combination, that along with all other normalized and centered linear combinations of features x(1), x(2), …, x(p)has the greatest dispersion. Next k- principal component
(k = 2, ..., @) of analyzed system of features X is their normalized and centered linear combination, that is not correlated to k –1 previous principal components and among all other normalized and centered and not correlated to previous k-1 principal components of linear combinations of x(1),
x(2), …, x(p)has the greatest dispersion. Principal
components could be used for solving the following types of tasks of data analysis: 1) simplification, reducing of dimensionality
of analyzed model, statistical research of dependencies or classification in order to simplify the interpretation of statistical conclusions.
2) visualization of source (original) multidimensional data, that could be got as a projection of first three principal components.
3) preliminary orthogonalization of predictors in tasks of regression equations construction, as a method of eliminating multicollinearity.
4) compression of the size of statistical information.
Detailed description of the philosophy of PCA and its algorithm is discussed in [2,3, 9, 11, 12, 14, 15, 16, 17, 20].
Geometric interpretation of PCA could be described as moving to new coordinate system, where principal components are its axis. The graph below illustrates a simple case (fig. 1).
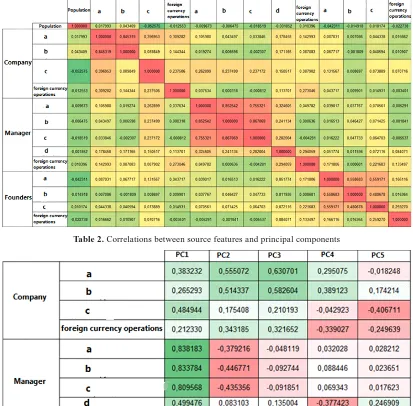
In the process of the PCA the major role is being played by the interpretation of results (interpretation of selected principal components). According to the definition if PCA, both covariance matrix and correlation matrix could be used to measure the degree of relations between source variables. In this paper authors used correlation matrix. Correlation matrix of source features is presented below (tab. 1).
There is a strong correlation between features that describe manager’s financial activity. Dispersions of 5 first principal components and correlations of source features and principal components (tab. 2) are synthesized as a result of PCA analysis of correlation matrix.
Table 1. Correlation between source variables
Table 2. Correlations between source features and principal components
RESULTS
Interpretation of selected principal components The technical questions of PCA calculation, some questions, related to variable
selection,eigenvalues and eigenvectors, particularly methods of calculation, advantages and disadvantages,discussed1, 4, 7, 10.
criteria). They describe more than 73% of entire variance in data. Problem of interpretation of principal components described in5, 8, 18.
According to the matrix of factor loadings the following preliminary conclusions could be made:
The 1st principal component is bi-polar. It
is positively correlated with all variables which describe business-activity. It is strongly correlated with variables that describe manager’s activity (0.5-0.84). Weak negative correlation is observed with the variable that describes the population of the region where company is registered. The less is the population of the region, the higher is the level of business-activity that occurs the company or its affiliates per capita.
The 2nd principal component is also
bi-polar. It is positively correlated with variables that describes co-founders activity and wire transfers to the company. However it has negative correlation with variables that describe manager’s activity. We can assume that this principal component can be viewed as the character of activity allocation. The more financially active are the company and company’s co-founders, the less active is the company’s head. Within the scope of the research we can guess it as a kind of business-activity “conservation” law.
The 3rd principal component is quite
similar to the previous one. It is negatively correlated with manager’s and co-founders’ business-activity variables, and positively with
company’s variables. Therefore the higher is component rate the more active is the company and the less – manager and co-founders.
The 4th principal component is bi-polar. It
describes foreign currency financial flows of all of participants – company, manager, co-founders. It is negatively correlated with foreign currency’s financial flow. Moreover, the component is also correlated with cash flow. That is reasonable since a huge part of financial operations with foreign currency are operations of conversion.
The 5th principal component is positively
correlated with population of region where company is registered.
Summarizing the interpretations of the selected principal components, we can assume that the 1st component is the most relevant one in our
case and it can be considered as a measure of business-activity of industry unit (company, manager, co-founders). Its contribution to the entire variance in data is more than 23%. The 1st principal
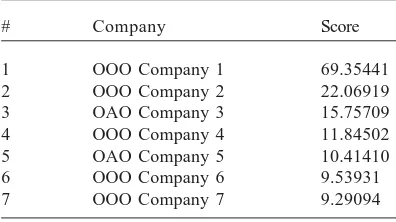
Table 3. Score matrix (1st principal component)
# Company Score
1 OOO Company 1 69.35441
2 OOO Company 2 22.06919
3 OAO Company 3 15.75709
4 OOO Company 4 11.84502
5 OAO Company 5 10.41410
6 OOO Company 6 9.53931
7 OOO Company 7 9.29094
Fig. 3. PCA results application in visual network analysis
component is the sought-for internal factor that describes exactly the piece of variance which is responsible for business-activity, considering the effect per capita.
Synthesis of integral scores of company’s business activity using the 1st principal component
Each principal component gives some new common description to all objects of a source (original) set. Each component is a function of characteristics of analyzed objects.
Normally researcher is interested in object’s characteristics connected to one or few principal components. So, it is interesting to get the value of certain principal component for every object for the purposes of ranking and classifying objects of the set.
Review the model of PCA and get the
equality
nr r jr j
a
f
y
1for j- feature:
yj=aj1f1+aj2f2+...+ajnfn;
Express values of principal component by values of features. For r- component [1]: .
)
...
(
1
2 2 1
1r r nr n
r
a
y
a
y
a
y
f
He above formula provides getting the integral scores of business activity of each company in industry using the 1st principal
component.
Identification of companies, which have the greatest business activity
1st principal component describes
changing of the level of business activity. The higher is the score, the higher level of activity has the company.
Identification of companies which have the greatest level of activity is presented below. Due to M[ f (v)] = 0, estimation of confidence
interval for the average of distribution µ could be found by formula:
µ± . √ = 0,00 ±0,069.
The range between confidence interval (-0.069 – (-0.069) contains about 90% of all companies. These companies has the least activity level, hence, about 10% of companies have the greatest business activity level.
Application of results
Interesting examples of PCA application discussed in13. Noticeable, that there is no
information available about application of PCA results in the visual network analysis.
One of the most efficient ways to understand data is its visualization. The new direction in data analysis is visual network analysis. Network analysis is the study of relations among a set of actors.Network theory is sympathetic with systems theory and complexity theory. Recent advances in technology make it possible to quickly compute the necessary relationships and provide a visual interface to complex relational datasets with a host of benefits to the user.
Practice knows a lot of visual network analysis application: social networks, marketplaces, antifraud, anti-money laundering, etc. User can uncover hidden relationships just by looking at the networks, use some integrated visual tools to understand how two datasets relate to each other, however, sometimes it is a problem to make use of several source set transformations, in order to understand the relations between objects better. The problem exists due to the lack of sufficient computing resources to handle large datasets. It is often a problem while analyzing financial flows data among hundreds and thousands of companies. If we are looking on financial transactions between
companies of certain industry, we can artificially bound the network at some arbitrary boundary, such as region, legal entity type, etc. Yet we let the network get too large because we cannot process the data. Now we showed how principal components analysis could be used to process large data arrays and use this data in order to highlight the target objects.
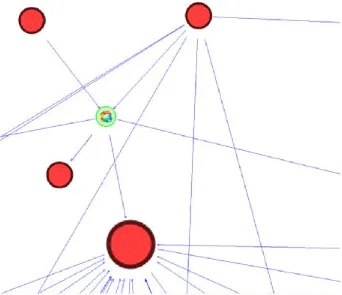
Economic relations between companies of the analyzed industry could be visualized as an indirect graph.Companies are divided into clusters, depending on their specialization in the industry. The most active companies marked with the red color on the scheme below (fig. 3).
The results of PCA on the scheme of object-level analysis are presented on the image below (fig. 4).Some kind of PCA application also may help identify centralities in the complex schemes.
This could be an advantage in the process of visual network analysis on the industry situation: analyst has no need to analyze the activity manually – they are already marked on the scheme and he can see their partners and other context information.
Overall, the process of industrial analysis could be substantially easier due to such preliminary processing (preprocessing) of data with the principal components analysis.
A clear benefit to the user are the massive time savings for interpretation of relational data. Highlighted objects can represent the situation and provide much easier perception of visualized arrays of data.
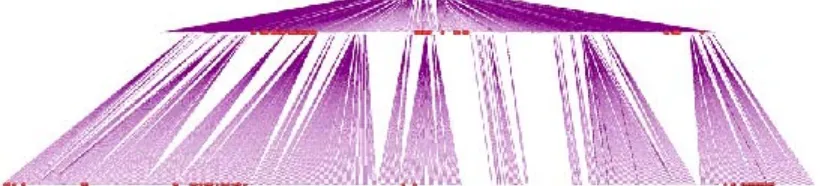
Application of the PCA results allowed to discover the role and position of companies in the visualization of beneficial owners network (fig. 5). The image below demonstrates how easily we can see the objects of our interest on the scheme while doing visual network analysis. It provides automatic identification of objects, which have critical value of some type of characteristic.
CONCLUSION
In this paper we discovered that PCA could be applied as a useful preprocessor tool, since the most active companies could was marked red on the scheme that makes its analysis easier.
In this paper we investigated PCA
application to the data of financial flows of companies of a certain industry.The results of PCA allowed to select principal component for getting scores of business activity level of companies. Furthermore, there were identified the most active companies in the industry. We analyzed the nature of their distribution and explored that the number of companies in the group depends on the integral score and could be asymptotically approximated by lognormal function. Finally, data of financial flows, aggregated by the regions was analyzed by PCA,therefore, integral scores of the regional activity were synthesized.
The example of principal components analysis application in economic and financial tasks demonstrates its efficiency in playing the role of a preprocessor in the process of network visual analysis (graphs, social network analysis, etc). Possible way to simplify the analysis of large heterogeneous data is to identify and present the analyzed characteristic, that is not observed naturally,through the source variables using the dimensionality reduction methods and highlight the objects that has the highest integral scores of the analyzed characteristic. Further researches could be conducted to explore any clusters in identified objects or recognition of patterns in relations between objects. Perhaps, interesting results could be obtained using the sparse PCA (a sort of modification of classic method) to financial data for more precise interpretation of source variables6.
REFERENCES
1. Dubrov A.M. Data processing with the principal
components analysis.–M.: Statistics, 1978; 130.
2. Dubrov A.M., Mhitarian V.S., Troshin L.I.
Multidimensional statistic methods, M.:
Finance and statistics, 1998.
3. Andrukowich P.F. a. o. Abstract painting as a
specific – Generale – Language. A Stat. Appr. To the problem//Metron XXIX 1971; N 1–2.
4. Okamoto M., Kanazawa M. Minimization of
Eigenvalues of a matrix and Optimality of principal components // Ann. Math. Statist.– 1968; 39: N 3.
5. Rao C. R. The use and interpretation of principal
components analysis in applied research, //
Sankhya, A 1964; 26(4): P.329-358.
component analysis. J. Comput. Graph. Statist., 2006; 15: 265-286
7. H. Zou, T. Hastie. Regularization and variable
selection via the elastic net. J. Roy. Statist. Soc. Ser. B, 2005; 67: 301–320
8. J. Cadima, I.T. Jolliffe. Loadings and correlations in the interpretation of principal components.
J. Appl. Statist., 1995; 22: 203–214.
9. C. Eckart, G. Young. The approximation of one
matrix by another of lower rank. Psychometrika, 1936; 1: 211-218.
10. J. Fan, R. Li. Variable selection via nonconcave penalized likelihood and its oracle properties. J.
Amer. Statist. Assoc., 2001; 96: 1348–1360. 11. I. Frank, J. Friedman. A statistical view of some
chemometrics regression tools. Technometrics, 1993; 35: 109–135
12. K.R. Gabriel, S. Zamir. Lower rank
approximation of matrices by least squares with any choice of weights. Technometrics, 1979; 21: 489–498.
13. J. Jeffers. Two case studies in the application of principal component. Appl. Statist., 1967; 16:
225-236.
14. I.T. Jolliffe. Rotation of principal components:
choice of normalization constraints. J. Appl.
Statist., 1995; 22: 29-35.
15. I.T. Jolliffe. Principal Component Analysis.
(second ed.)Springer, New York 2002.
16. I.T. Jolliffe, N.T. Trendafilov, M. Uddin. A
modified principal component technique based on the LASSO. J. Comput. Graph. Statist., 2003;
12: 531-547.
17. I.T. Jolliffe, M. Uddin. The simplified component technique: an alternative to rotated principal components. J. Comput. Graph. Statist., 2000;
9: 689-710
18. Y. Liu, Y. Wu, Variable selection via a combination of the L0 and L1 penalties, J. Comput. Graph.
Statist., 2007, accepted for publication.
19. J.S. Marron, M. Todd, J. Ahn, Distance weighted
discrimination, J. Amer. Statist. Assoc.,
tentatively accepted for publication, 2005.
20. S. Vines. Simple principal components. Appl.