www.ijaera.org 2015, IJAERA - All Rights Reserved 221
Multi Response Optimization of Machining
Responses in Turning Process of AISI D2 Tool
Steel using WPM Approach
Parvinder Singh1*, A. S. Channi2
1M. Tech. Scholar, Department of Mechanical Engineering, Yamuna Institute of Engineering &
Technology, Yamuna Nagar, Haryana, INDIA, E-mail Id: [email protected]*
2Assistant Professor, Department of Mechanical Engineering, Yamuna Institute of Engineering &
Technology, Yamuna Nagar, Haryana, INDIA, E-mail Id: [email protected]
Abstract: AISI D2 tool steel material is a highly demanding material which covers a broad range of industrial applications. In this research article, turning operation performed on AISI D2 tool steel by employing Taguchi’s DOE approach in form of L9 orthogonal array in order to design the experiments. The various process responses such as; thrust force, surface roughness, and material removal rate have been analyzed by using Analysis of Variance. Different process variables investigated are; spindle speed, feed rate, and depth of cut. Multi response optimization has also been attempted to optimize the considered process responses simultaneously using weighted product method. Feed rate and depth of cut have been observed to be most significant for considered process characteristics.
Keywords: Feed rate; Material removal rate; Spindle speed; Taguchi; Turning operation
I. INTRODUCTION
Turning is the removal of metal from the outer diameter of a rotating cylindrical work piece. Turning is used to reduce the diameter of the work piece, usually to a specified dimension, and to produce a smooth finish on the metal. Often the work piece will be turned so that adjacent sections have different diameters.
The optimization of process parameters for turning EN24 steel bars, using spindle speed, depth of cut and feed rate as controlled factors and feed force as response variable through the Taguchi approach were reported [1]. An experimental investigation were conducted using steel work piece, spindle speed, work piece length and cutting tool material control parameters and surface roughness as response parameter [2]. Results show that the effect of spindle speed on the surface roughness is most significant, the effect of cutting tool material is less significant and especially, small work piece length result in better surface roughness. An attempt is made to review the optimizing machining parameters in turning process reported an optimal setting of process parameters [3]. Various conventional techniques employed for optimization include geometric programming, geometric plus liner programming, goal programming, dynamic programming etc. The latest technique for optimization includes fuzzy logic, scatter search technique, genetic algorithm, and Taguchi technique and response surface methodology.
www.ijaera.org 2015, IJAERA - All Rights Reserved 222
characteristics of machining parameters with the consideration of surface furnishing and tool life. in this study we fine that cutting speed is most influencing parameters.
Experimental investigation has also been carried out for turning process of AISI O1 tool steel [5]. Results reported WSN method of multi response optimization provided with best optimum solution to the problem investigated. Number of investigators have been explored the utility of multi attribute decision making approaches for the purpose of process optimization in broad range of engineering applications [6-11, 12].
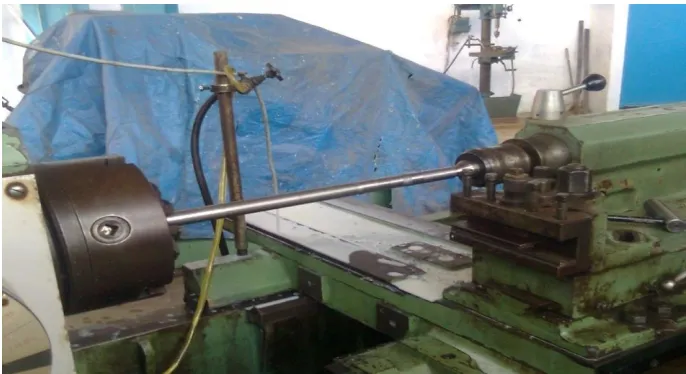
Figure 1: Process of turning operation.
II. EXPERIMENTATION
Hindustan machine tool (HMT) lathe machine was used for this experimentation. The size and the shape of work piece were selected based on the availability from the supplier. Also the work piece was design was finalized keeping in the view the capabilities of the lathe machine to ensure the better performance in machining the work piece.
www.ijaera.org 2015, IJAERA - All Rights Reserved 223
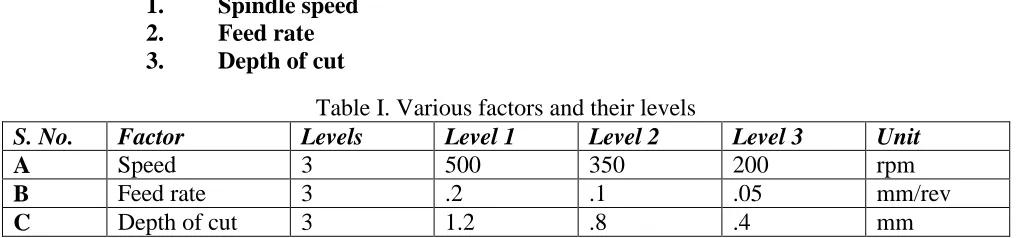
The following parameters were selected for the study based on the availability of these parameters.
1. Spindle speed 2. Feed rate 3. Depth of cut
Table I. Various factors and their levels
S. No. Factor Levels Level 1 Level 2 Level 3 Unit
A Speed 3 500 350 200 rpm
B Feed rate 3 .2 .1 .05 mm/rev
C Depth of cut 3 1.2 .8 .4 mm
Taguchi’s L9 orthogonal array has been used for designing the experimentation. The whole experimentation replicated twice and the mean value of responses has been provided here.
Table II. Control log for experiment
Experiment no. Spindle speed (A) Feed rate (B) Depth of cut (C)
1 500 0.2 1.2
2 500 0.1 0.8
3 500 0.05 0.4
4 350 0.2 0.8
5 350 0.1 0.4
6 350 0.05 1.2
7 200 0.2 0.4
8 200 0.1 1.2
9 200 0.05 0.8
www.ijaera.org 2015, IJAERA - All Rights Reserved 224
Table III. Response variables & their units
S. No.
Response name Unit Response type
1 Thrust force Kg. Continuous
2 Surface roughness µm. Continuous
3 MRR mm3/ sec. Continuous
The material removal rate (MRR) in the turning operation is the volume of material removed per unit time
MRR = 𝜋 (𝐷𝑜−𝐷𝑖)𝐿
4𝑇 (1)
Where; Do = Original Dia in mm; Di = Final dia in mm; L = length of work piece in mm; T = Time in
second.
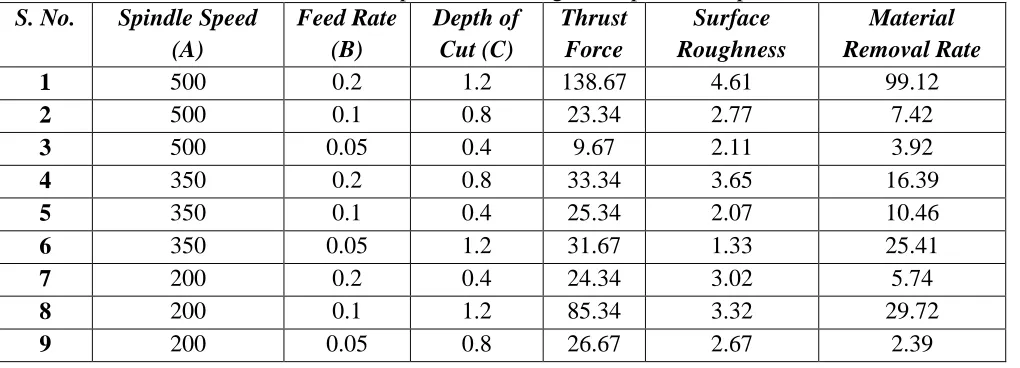
Table IV. L9 OA Experimental Design with process responses S. No. Spindle Speed
(A)
Feed Rate (B)
Depth of Cut (C)
Thrust Force
Surface Roughness
Material Removal Rate
1 500 0.2 1.2 138.67 4.61 99.12
2 500 0.1 0.8 23.34 2.77 7.42
3 500 0.05 0.4 9.67 2.11 3.92
4 350 0.2 0.8 33.34 3.65 16.39
5 350 0.1 0.4 25.34 2.07 10.46
6 350 0.05 1.2 31.67 1.33 25.41
7 200 0.2 0.4 24.34 3.02 5.74
8 200 0.1 1.2 85.34 3.32 29.72
9 200 0.05 0.8 26.67 2.67 2.39
III. MULTI-RESPONSE OPTIMIZATION USING WPM (WEIGHTED PRODUCT
METHOD)
In this method, the combined index of an alternative is calculated. The major steps are as follows;
The determination of the objective and identification of relevant evaluation attributes.
Perform the normalization of the raw data. The attributes can be beneficial or non-beneficial. The normalized values expression for the case of higher-is-better (i.e. beneficial attribute) is given as;
mab=(mab)K/(mab)L
(2)where (mab)K is the measure of the attribute for the K-th alternative, and (mab)L is the measure of the
attribute for the L-th alternative that has the highest measure of the attribute out of all alternative considered and for the case of lower-is-better (i.e. non-beneficial attribute) it is given as;
www.ijaera.org 2015, IJAERA - All Rights Reserved 225 Step 3: The overall or composite performance score of an alternative can be express as;
p
Pa = ∏ [(mab)normal]
wy(4)
b=1
Table V. Normalized matrix for each process response
S. No. Spindle Speed (A)
Feed Rate (B)
Depth of Cut (C)
Thrust Force
Surface Roughness
Material Removal
Rate
1 500 0.2 1.2 0.069734 0.288503 1
2 500 0.1 0.8 0.41431 0.480144 0.074859
3 500 0.05 0.4 1 0.630332 0.039548
4 350 0.2 0.8 0.290042 0.364384 0.165355
5 350 0.1 0.4 0.38161 0.642512 0.105529
6 350 0.05 1.2 0.305336 1 0.256356
7 200 0.2 0.4 0.397288 0.440397 0.05791
8 200 0.1 1.2 0.113311 0.400602 0.299839
9 200 0.05 0.8 0.36258 0.498127 0.024112
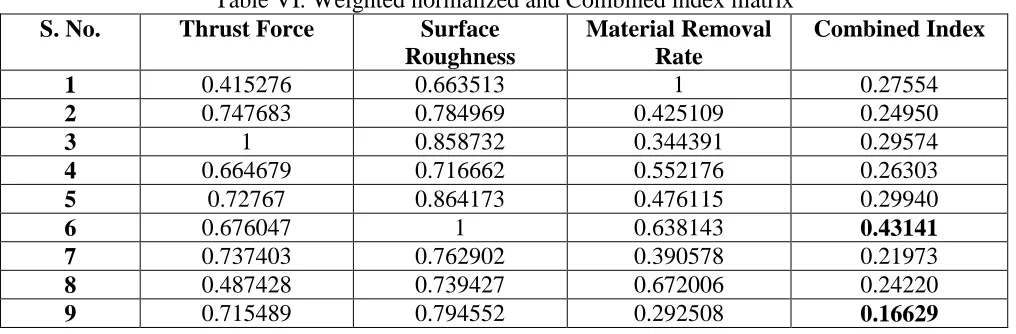
The weights have been decided as 0.33 for all the process characteristics such as; thrust force (TF), surface roughness (SR), and material removal rate (MRR).
Table VI. Weighted normalized and Combined index matrix
S. No. Thrust Force Surface
Roughness
Material Removal Rate
Combined Index
1 0.415276 0.663513 1 0.27554
2 0.747683 0.784969 0.425109 0.24950
3 1 0.858732 0.344391 0.29574
4 0.664679 0.716662 0.552176 0.26303
5 0.72767 0.864173 0.476115 0.29940
6 0.676047 1 0.638143 0.43141
7 0.737403 0.762902 0.390578 0.21973
8 0.487428 0.739427 0.672006 0.24220
9 0.715489 0.794552 0.292508 0.16629
The optimized parametric setting for WPM combined index (higher is better) is; A2 B2 C1 and
ANOVA analysis is also presented above.
IV. RESULTS & DISCUSSION
www.ijaera.org 2015, IJAERA - All Rights Reserved 226
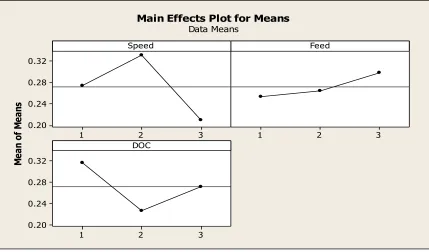
In multi-response optimization for turning process of AISI D2 tool steel, A2 B2 C1 observed as optimal parametric setting of process variables. This suggests that; Spindle speed of 350 rpm, feed rate of 0.1 mm/rev., and depth of cut of 1.2 mm provided with optimum solution to the present investigated problem when consider all the process responses of interests simultaneously.
The mean effect plots and ANOVA analysis have been represented below.
3 2
1 0.32
0.28
0.24
0.20
3 2
1
3 2
1 0.32
0.28
0.24
0.20
Speed
M
ea
n
of
M
ea
ns
Feed
DOC
Main Effects Plot for Means Data Means
Figure 3:Mean effects plot for WPM combined index.
Table VII. ANOVAresults for WPM combined index
Source DF Seq SS Adj SS Adj MS F P %contribution
Speed 2 0.022301 0.022301 0.011151 5.16 0.162
Feed 2 0.003313 0.003313 0.001656 0.77 0.566
DOC 2 0.012181 0.012181 0.006090 2.82 0.262
Error 2 0.004324 0.004324 0.002162
Total 8 0.042119
www.ijaera.org 2015, IJAERA - All Rights Reserved 227
V. CONCLUSIONS
Present study used weighted product method for the multi response optimization in turning process of AISI D2 tool steel. Following conclusions can be made from present experimentation based research work;
1. Taguchi’s L9 orthogonal array enables the proper combination of process variables to be used in
experimentation in a most effective manner.
2. Analysis of Variance of process responses provides the significance of considered parameters and results revealed that depth of cut and feed rate effects the process mostly.
3. In multi-response optimization for turning process of AISI D2 tool steel, A2 B2 C1 observed as optimal parametric setting of process variables. This suggests that; Spindle speed of 350 rpm, feed rate of 0.1 mm/rev., and depth of cut of 1.2 mm provided with optimum solution to the present investigated problem when consider all the process responses of interests simultaneously.
VI. REFERENCES
[1] H. Singh and P. Kumar (2006). Optimizing feed force for turned parts through the Taguchi technique. Sadhana, vol. 31, No. 6, pp. 671-681.
[2] T. Ozel, T. Hsu, and Z. Erol (2005). Effects of cutting edge geometry, work piece hardness, feed rate and cutting speed on surface roughness and force in the finishing turning of hardened of AISI H13 steel. International Journal of Advance Manufacturing Technology, vol. 25, pp.262-269.
[3] A. Aggarwal and Hari Singh (2005). Optimization of machining techniques - A retrospective and Literature review. Sadhana, vol. 30(6), pp. 699-711.
[4] S. Ghos, B. Murugan, and B. mandal (2009). An approach for process parameter optimization of hard machining while machining the hardened steel. Journal of Scientific and Industrial Research, vol. 68, pp. 491-504.
[5] R. Kataria and J. Kumar (2014). A comparison of the different multiple response optimization techniques for turning operation of AISI O1 tool steel. Journal of Engineering Research, vol. 2 (4), pp. 161-184.
[6] R. P. Singh, J. Kumar, R. Kataria, and S. Singhal (2015). Investigation of the machinability of commercially pure titanium in ultrasonic machining using graph theory and matrix method. Journal of Engineering Research. Article accepted & In-press for publication.
[7] P. Sharma, R. K. Phanden, and V. Baser (2012). Analysis for site selection based on factors rating. International journal of emerging trends in engineering and development, vol. 6(2), pp. 616-622.
[8] R. Singh, S. Singhal, and P. Sharma (2016). Application of AHP in the Analysis of Flexible Manufacturing System. Journal of industrial and intelligent information, vol. 4(1), pp. 15-20.
[9] M. Sharma, R. K. Phanden, and P. Sharma (2015). Comparative evaluation of facility layout alternatives based on material handling cost. International journal for technological research in engineering, vol. 7(2), pp. 748-751.
[10] P. Sharma, R. P. Singh, and S. Singhal (2013). A review of meta-heuristic approaches to solve facility layout problem. International journal of emerging research in management & technology, vol. 2(10), pp. 29-33.
[11] P. Sharma, R. K. Phanden, and S. Singhal (2013). A Comparative Analysis of Facility Layout Design and Optimization Techniques. Proceedings of the 2nd national conference on Advancement in the Era of Multi Disciplinary Systems.