INTERNATIONAL RESEARCH JOURNAL OF PHARMACY
www.irjponline.com
ISSN 2230 – 8407
Research Article
THE EFFECT OF MICROENCAPSULATION OF UREA USING POLYSTYRENE-POLYCAPROLACTONE
BIOBLEND POLYMER ON ITS IN-VITRO RELEASE EFFICIENCY
Muslim Suardi
1, Elfi Sahlan Ben
1, Netty Suharti
1, Muhammad GhufranYuldi
1, Ria Hummam Pramiba
1,
Rika Sari Lalfari
2,
Asiska Permata Dewi
3, and Akmal Djamaan
1,4 1Faculty of Pharmacy, University of Andalas, Padang, Indonesia
2
Department of Chemistry, Faculty of Science, University of Andalas, Padang, Indonesia
3
Department of Pharmacy, Faculty of Medicine and Public Health, University of Abdurrab, Pekanbaru, Indonesia
4Laboratory of Biotechnology Biotan Sumatra, University of Andalas, Padang, Indonesia
*Corresponding Author Email: [email protected]
Article Received on: 17/09/18 Approved for publication: 29/11/18
DOI: 10.7897/2230-8407.0912294
ABSTRACT
Urea,a nitrogen fertilizer,is needed by plants, but its absorption is still in-optimal caused by very fast dissolved. It can cause also negative effects on the environment. This study aimed was to examine the effect of several ratios of polystyrene (PS)-polycaprolactone (PCL) bioblend polymers coating urea on the release efficiency of urea microcapsules. The microcapsules were produced in 3 formulas by varying the amount of PS:PCL in Formula F1, F2, and F3 at the ratio of 85:15, 90:10, and 95:5%, respectively. Urea particle size used was at a range of 1-10µm. Coating ordinary urea by microencapsulation technique using PS-PCL bioblend can produce the slower release of urea compared to ordinary urea but only lasts up to 45 minutes due to initial burst effect or fast release at the beginning of dissolution. The highest release efficiency of urea from coated urea was from Formula F2 (68.47%)and the lowest one was from Formula F3 (61.83%).
Keywords: urea, microencapsulation, polystyrene, polycaprolactone, release.
INTRODUCTION
Nitrogen is one of the elements most needed by plants. Among many nitrogen fertilizers available in the market, urea is the most widely used fertilizer because of its high nitrogen content (46%) and its relatively low cost1. In term of an economical aspect, urea
with chemical formula CO(NH2)2, is one of the most important
nitrogen fertilizers and most commercially available2.
Unfortunately, the use of ordinary urea fertilizer is ineffective because of excessive nitrogen loss in the soil. The low efficiency of urea fertilizer has large negative impacts, such as increased erosion, reduced soil fertility, and decreased groundwater quality. An alternative that can be done to overcome the problem is the manufacturing of slow-release urea fertilizer.
Several investigations had been done related to using of PS a coating polymer of slow-release urea fertilizer2,3,4. PS prevents
the fast dissolution of urea in water also decreases pore formation on the surface of the coating. However, because of the low compatibility of PS, it is needed to be combined with other polymers5,6.
The use of PS and PCL in the manufacture of coated urea showed a decrease in the release rate of urea from the microcapsules to optimize nitrogen absorption by plant. It caused by controlling of urea released at suitable time and amount needed by plant, and
maintain the presence of nitrogen in the soil. The dose of slow release fertilizersis smaller than the conventional methods4.
MATERIALS AND METHODS
Equipment and Materials
Equipment used were Fourier Transform Infrared Spectrophotometer (Perkin Elmer FT-IR Spectrophotometer Frontier), UV-Vis Spectrophotometer (Shimadzu UV-1700), Scanning Electron Microscope (JEOL, Japan), Analytical scales (Shimadzu AUX 220, Japan), Magnetic Stirrer Heating (IKA, Germany), and glassware usual used in the laboratory.
Materials used wereurea (PT. Pupuk Sriwijaya, Indonesia), polystyrene (waste), Polycapro-lactone (Aldrick Chemical) Ehrlich reagent (Indo Reagen). Span 80, Liquid Paraffin, chloroform, n-hexane were purchased from PT. Brataco, Indonesia.
Formula
Table 1: Formulation of Urea Microcapsules using PS-PCL as a matrix
No Materials F0 F1 F2 F3
1 Urea (mg) - 500 500 500
2 Bioblend Polymers (mg) 750 750 750 750
PS : PCL (mg) 500:250 637.5:112.5 675:75 712.5:37.5
3 Chloroform (mL) 20 20 20 20
4 Span 80 (mL) 1 1 1 1
5 Liquid Paraffin(mL) 100 100 100 100
Producing of Urea Microcapsules
Polycaprolactone and polystyrene were dissolved in chloroform in an Erlenmeyer flask and added with urea.The mixture was added slowly to the dispersion of Span 80 in liquid paraffin and stirred at a speed of 1500 revolutions per minute until all of the chloroform evaporated. The microcapsules formed were collected by decantation process and washed out with n-hexane until free from paraffin and Span 80, then filtered and dried at room temperature for 24 hours.
4. Characterization of Microcapsules
a. IR Spectroscopy Analysis
The IR spectra of dried microcapsules wereobserved using a Fourier Transform Infrared (FTIR) spectrophotometer at a range of wave number of 400-4000 cm-1.
b. Particle Size Distribution
Analysis of particle size distribution was carried out by Image-J software using the images captured by Scanning Electron Microscope. The threshold wasselected at a set-up magnification. 300 particles number were observed.
c. Determination of Urea Loaded in Microcapsules
The maximum absorbance wavelength of urea was determined using 0.5% b/v of its solution. One mL of Erlich solution was added to the urea solution. The maximum absorption wavelength was estimated using a UV-Vis spectrophotometer. A series of working standard solutions at the concentration of 0.2, 0.25, 0.3, 0.35, 0.4% b/v. Standard solution was added with 1 mL of Erlich reagent. The absorbance of the solution was measured at the maximum wavelength of urea using a UV-Vis spectrophotometer.
50 mg of dried microcapsules weighed accurately wasplaced in a 25 mL volumetric flask and added with distilled water until the boundary mark, shaken, and added with Erlich reagent. The absorbances of sample solutions were measured at the maximum absorption wavelength of urea sample solutions using a UV-Vis spectrophotometer (n=3) 5.
d. Determination of Loading, Encapsulation Efficiency, and MicrocapsulesYields
The percentage of the active substance coated could be computed from the active substance content in the microcapsules produced by the following equation5.
% Loading = (Weight of active substance in microcapsules/microcapsule weight) x 100%
The percentage of microcapsules yielded was calculated using the formula below:
% Yield = (Microcapsules Weight)/(Initial weight of active substance+polymer amount)x100%
Entrapment Efficiency = (Amount of active substance measured)/(The amount of theoretically active substance)x100%
e. Scanning Electron Microscope Characterization
The sample was placed in an aluminum holder sample at a thickness of 10nm. Samples were observed for various magnification of SEM (Scanning electron microscopy) devices. The voltage and current were set up at 15 kV and 12 mA, respectively.
f. Release Test of urea Microcapsule produced
25 mL of distilled water was filled into a container flask of 25 mL. The ordinary and the coated urea atstated amount of microcapsules equivalent to 100 mg of urea were placed into the container. At the predeterminant time of 10, 20, 30, 45, 60, 120, 240 and 360 minutes after the treatment, 5 mL sample solutions were withdrawn. At each sampling, the solution in the container was replaced with the fresh medium at the same temperature and volume. The absorbances of sample solutions were measured by a UV-Vis spectrophotometer at the maximum absorption wavelength (n=3)5.
RESULTS AND DISCUSSIONS
IR Spectroscopy Analysis is shown in Figure 1 and 2. It was observed that no new groups occur detected from IR spectra of raw materials, urea, and polymers used as a bioblend matrix.
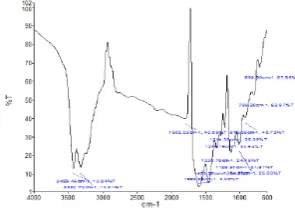
Figure 1: IR Spectra of ordinary urea
The ordinary urea and polymers used were compatible 5. The
spectra of raw materials can be seen in Figures 1. The IR spectra of urea showed the NH functional groups were seen at wave numbers of 3362.60 and 3321.37 cm−1, for C = O groups can be
seen on wave number of 1802.03 𝑐𝑚−1 and for CN groups it
appears at a wave number of1165.90 𝑐𝑚−1. Compared with the
literature, the N-H group will appear at the wave numbers of 3000-3700 cm−1, the C = O group appears at the wave numbers
1640-1820 𝑐𝑚-1 while the C-N group was reported appear at the
wave number 900-1300 𝑐𝑚−1. The IR spectra of urea raw
Figure 2: IR Spectra of Bioblend Polymers and Urea Microcapsules (A = Bioblend Polymers, B= Formula F1, C = Formula F2, and D = Formula F3)
The ordinary urea and polymers used were compatible 5. The
spectra of raw materials can be seen in Figures 1 and 2. The IR spectra of urea showed the NH functional groups were seen at wave numbers of 3362.60 and 3321.37 cm−1, for C = O groups
can be seen on wave number of 1802.03 𝑐𝑚−1 and for CN groups
it appears at a wave number of1165.90 𝑐𝑚−1. Compared with the
literature, the N-H group will appear at the wave numbers of 3000-3700 cm−1, the C = O group appears at the wave numbers
1640-1820 𝑐𝑚-1 while the C-N group was reported appear at the
wave number 900-1300 𝑐𝑚−1. The IR spectra of urea raw
materials compared to the literature showed that the urea used to fulfill the requirements.
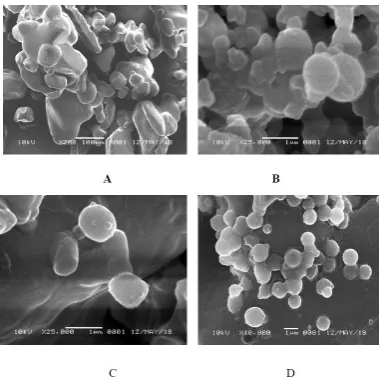
Observing the shape and surface morphology of microcapsules was performed using a Scanning Electron Microscope7. The SEM
analysis was carried out on microcapsules placebo and urea coated microcapsules at different magnifications of 100, 200, and 7000 times. At a magnification of 7.000 times, the shape and surface morphology of microcapsules appear more clearly. Based on the results of analysis on The placebo microcapsules were an irregular spherical in shape and a rough surface (Figures 3A). Whereas in urea coated microcapsules was more spherical in shape with a rough surface. From the picture can be seen that microcapsules form an aggregate. There were inappropriate drying process occur in several microcapsules. to the surface of microcapsules7 The rough surface of microcapsules was caused
by the presence of ordinary urea attached.
Figure 3: Surface morphology of urea microcapsules observed using Scanning Electron Microscope (SEM) (A= F0 (Ordinary urea) B=F1, C=F2, D=F3)
The same condition was also found in the study of the effects of plasma oxygen therapy on the release of polycaprolactone microcapsules containing tocopherol using Span 80 surfactant. The surface of the microcapsules were coarse and form
aggregates8,9. In addition, in the previous study found the
Table 2: Particle Size Distribution of Coated Urea Microcapsules Particles Size Range (µm) Frequency of Particles Size Distribution (%)
Formula F1 Formula F2 Formula F3
1-10 68.33 80.33 88
11-20 25 17 9.67
21-30 5.33 2 1.67
31-40 0.67 0.33 0.67
41-50 0.33 0.33 0
51-60 0.33 0 0
The particle size distribution of microcapsules were lies between 0-50 µm (Table 2). The highest particle size range in Formula F1 was in the range of 0-10 µm with a percent frequency of 68.33%. Formula F2 and Formula F3 were also not much different range formula F2 and F3, at the frequency of 80.33 and 88%,
respectively. The average diameter of the microcapsules producedwere 9.80, 8.34, and 6.76 µm, respectively. The particle size obtained to fulfill the requirements stated in the literature that the size of the microcapsules produced by the solvent evaporation emulsification method is between 5-5000 µm10-11.
Table 3: Determination of Recovery, Content, Loading and Urea Coating Efficiency in Microcapsules Microcapsules
Formula Recovery (%) Average of Content (mg) Loading (%) Coating Efficiency (%)
F1 79.6 % 42.54 42.54 65.88
F2 67.2% 37.08 37.08 83.44
F3 93.6% 36.91 36.91 83.88
The weight of urea microcapsules FormulasF1, F2, and F3 were 1.995, 0.84, and 1.17 g, respectively. While the percentage of recovery were 79.6, 67.2, and 93.6%, respectively (Table 3). Results showed that the percent recovery of the three formulas was not reach 100%. It can be occurred due to the loss of material during the process such as some particles stuck to the Erlenmeyer wall flask and in pipettes. Imperfect emulsification process also may affect the inappropriate coating and washed process with n-hexane12.
The content of urea in microcapsules can be seen in Table 3. The average urea levels on Formula F1, F2, and F3 were 42.54, 37.08, and 36.91 mg, respectively. The coating efficiency in Formulas F1,F2, and F3 were 65.88, 83.44 and 83.88, respectively. These results indicate that encapsulation efficiency was not appropriate. This was maybe caused by incompletely encapsulated urea during the microcapsules formation process. The non-encapsulated urea will stick to the outer wall of the microcapsule and will be carried along duringthe washing process using liquid paraffin and n-hexane12.
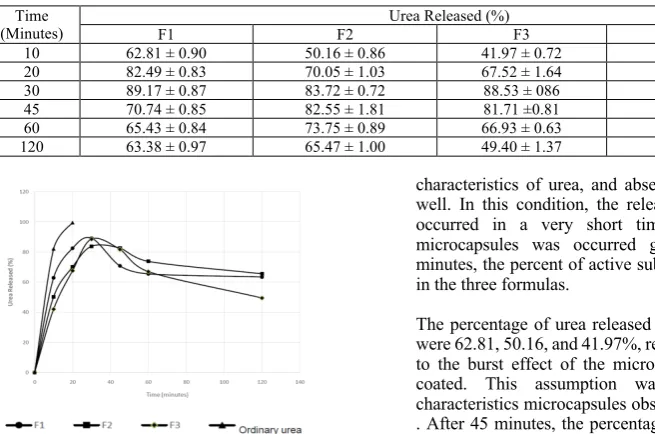
Table 4: The Released of Urea from Ordinary and Coated Urea Time
(Minutes) F1 F2 Urea Released (%) F3 Ordinary Urea
10 62.81 ± 0.90 50.16 ± 0.86 41.97 ± 0.72 82.48 ± 1.36 20 82.49 ± 0.83 70.05 ± 1.03 67.52 ± 1.64 99.19 ± 0.31
30 89.17 ± 0.87 83.72 ± 0.72 88.53 ± 086 -
45 70.74 ± 0.85 82.55 ± 1.81 81.71 ±0.81 -
60 65.43 ± 0.84 73.75 ± 0.89 66.93 ± 0.63 -
120 63.38 ± 0.97 65.47 ± 1.00 49.40 ± 1.37 -
Figure 5: The profile of urea released from ordinary and coated urea
The percentage release and the release efficiency of urea from urea coated microcapsules using polystyrene-polycaprolactone as coatings materials can be seen in Tables 4 and 5. Results showed that there was a great difference in the release of urea from urea coated microcapsules compare to the release of ordinary urea. 99% of urea had been released from the ordinary urea in only
characteristics of urea, and absence of the polymer coating as well. In this condition, the released of urea in distilled water occurred in a very short time. While from urea coated microcapsules was occurred gradually. However, after 10 minutes, the percent of active substance released was quite high in the three formulas.
The percentage of urea released from Formulas F1, F2, and F3 were 62.81, 50.16, and 41.97%, respectively. It can be caused due to the burst effect of the microcapsules that are not perfectly coated. This assumption was in accordance with the characteristics microcapsules observed by the SEM evaluation7,8
. After 45 minutes, the percentages released of urea from all of the formulas were decreased. These were caused by an initial burst effect, where the burst phase followed by a continuous slow phase.
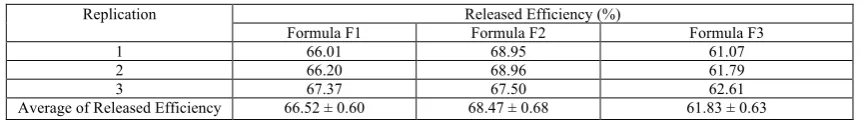
Table 5: Release Efficiency of Urea from Its Coated Microcapsules
Replication Released Efficiency (%)
Formula F1 Formula F2 Formula F3
1 66.01 68.95 61.07
2 66.20 68.96 61.79
3 67.37 67.50 62.61
Average of Released Efficiency 66.52 ± 0.60 68.47 ± 0.68 61.83 ± 0.63
It has been reported that the initial burst effect in the release profile is mainly due to (a) when substance solubility is high, (b) the dose of charge in the large polymeric matrix and (c) the lack of concentrations of the critical polymer. In addition, when the polymer concentration is low, the hydrated polymer matrix will be highly porous which leads to rapid diffusion of the active substance from the polymer matrix3,13.
CONCLUSION
Examination of the physical and chemical characteristics of urea microcapsules showed that the solvent evaporation coating technique had suitability for slow urea production because it affected the morphology and minimized the release profile of urea compared to ordinary urea. The release of urea microcapsules was less efficient because in the 45 minutes there was a decrease in the release rate. This was due to a burst effect, a rapid release occurred in the early step. The efficiency of urea release from the three urea microcapsules formulas used, where the highest release efficiency was in Formula F2 (68.47%) and the lowest release efficiency in Formula F3(61.63 %).
AKNOWLEDGMENT
The authors would like to say special thanks to The Rector of Andalas University for his support this research under Professor Research Grant Project, Andalas University, Fiscal Year 2018, with Contract Number: 29/UN.16.17/PP.RGB/LPPM/2018 (ELFI SAHLAN BEN).
REFERENCES
1. Ni B, Liu M, Lu S. Multifunctional slow-release urea fertilizer from ethylcellulose and superabsorbent coated formulations. Chem. Eng. J. 2009; 155(3): 892–898. 2. Ben E S, Suardi M, Suharti N, Kastianingsih D P, Lalfari R
S, Djamaan A. Application of microcapsule technology on urea coating formulation using polystyrene/ polycaprolactone bioblend polymer matrix and its effectiveness in planta on
Allium porrum L, Int. J. Pharm. Res. Allied Sci, 2018; 7(3):
183-188.
3. Muslim S, Salman, Fitriani, Suharti N, Erizal Z, Febriyenti, Aldi Y, Akmal D. Use of bioblend polystyrene/Starch for coating urea granules as slow release fertilizer. J. Chem.
Pharm. Res, 2015; 7(11):478-484.
4. Ben E S, Suardi M, Suhartri N, Djamaan A, Formulation of urea microcapsules using polystyrene and poly(3-hydroxybutyrate) bioblends by solvent evaporation method.
Der Pharma Chemica, 2016; 8(14):223-229.
5. Djamaan A, Monica R, Asiska P D, Suardi M, Ben E S, Erizal Z. The use of biopolymer of poly(3-hydroxybutyrate) as matrix of urea slow release fertilizer. J. Chem. Pharm. Res, 2015; 7(7):558-563.
6. Suharti N, Salman, Suardi M, Dwisari D, Febriyenti, Idris, Akmal D. Coating of urea granules for slow release fertilizer using bioblendpolystyrene/polycaprolactone Res. J. Pharm.
Biol. Chem. Sci, 2016; 7(1):1691-1699
7. Djamaan A, Suardi M, Mayerni R, Dewi B, Putri N R, Merwanta S, Rasyadi Y, Sati I S, Lalfari R S, Ben ES. Use of bioblend polystyrene-poly(3-hydroxybutyrate) as the coating material of the NPK slow release fertilizer, Int. Res. J Pharm, 2018; 9(10): 73-79.
8. Suardi M, Ben E S, Suharti N, Septiana K, Kastianingsih D P, Lalfari R L, Sati I S, Djamaan A, Formulation of urea microcapsules by using polystyrene-polycaprolactone, Int.
Res. J Pharm, 2018; 9(11): 1-6.
9. Park S J, Kim K S. Effect of oxygen plasma treatment on the release behaviors of poly (ɛ-caprolactone) microcapsules containing tocopherol. Colloids and Surfaces B:
Biointerfaces, 2005; 43(3): 138-142.
10.Venkatesan P, Muralidharan C, Manavalan R, Valliappan K. Selection of better method for the preparation of microspheres by applying analytic hierarchy process. J.
Pharm. Sci. Res, 2009: 1(3).
11.Dehghan, S., Aboofazeli, R., Avadi, M., &Khaksar, R. Formulation optimization of nifedipine containing microspheres using factorial design. African J.
Pharm.Pharmacol.2010; 4(6); 346-354.
12.Zheng T. Superabsorbent hydrogel as carriers for the controlled release of urea. Experiments and a mathematical model describing the release rate. 2009; 5(3): 231-238. 13.Benita S. Microencapsulation, methods and industrial
applications. 2016; New York Marcel Dekker, Inc.
Cite this article as:
Muslim Suardi et al. The effect of microencapsulation of urea using polystyrene-polycaprolactone bioblend polymer on its in-vitro release efficiency. Int. Res. J. Pharm. 2018;9(12):64-68 http://dx.doi.org/10.7897/2230-8407.0912294
Source of support: The Rector of Andalas University, Conflict of interest: None Declared