Type of the Paper: Article.
1
Methods for analyzing surface texture effects of
2
volcanoes with Plinian and subplinian eruptions
3
types: Cases of study Lascar (23° 22' S) and Chaiten (42
4
° 50' S), Chile.
5
Luis Fernández 1, Gabriel Álvarez 2 and Renato Salinas 3
6
1 Dpto. de Ingeniería en Geomensura y Geomática, Universidad de Antofagasta; [email protected]
7
2 Dpto. de Ingeniería en Geomensura y Geomática, Universidad de Antofagasta; [email protected]
8
3 Dpto. de Mecánica, Universidad de Santiago de Chile; [email protected]
9
Abstract: This paper presents a new methodology that provides the analysis of surface texture
10
changes in areas adjacent to the volcano and its impact product of volcanic activity. To do this,
11
algorithms from digital image processing such as the co-occurrence matrix and the wavelet
12
transform are used. These methods are working on images taken by the Landsat satellite platform
13
sensor 5 TM and Landsat 7 ETM + sensor, and implemented with the purpose of evaluating
14
superficial changes that can warn of surface movements of the volcano. The results were evaluated
15
by similarity metrics for grayscale images, and validated in two different scenarios that have the
16
same type of eruption, but differ, essentially, in climate and vegetation. Finally, the proposed
17
algorithm is presented, setting the parameters and constraints for implementation and use.
18
Keywords: subplinian eruption, co-occurrence matrix, wavelet transform, similarity metrics.
19
20
1. Introduction
21
In the process of a volcano eruption in general, it is possible to appreciate some spatial
22
deformation of the volcano, also, depending on the type of eruption it is possible to measure the
23
effects of the eruption on the surface [1]. Studies have been conducted to evidence of multi
24
deformations pre-eruptive disorders, post-eruptive and assess the impact of the eruption [2]. The
25
methods can be grouped into two: On one side, the direct methods, which are inclinometry, leveling,
26
check, distance using the impedance, etc. On the other side, we have the distance methods, by which
27
measurements can be performed through a remote sensor. In this group, there is a huge range of
28
devices, including laser ranging, photogrammetry, radiometry, GPS, etc.
29
It has been documented in the literature about surface deformations using satellite images [3, 4].
30
As for images captured by passive sensors, Landsat have been used primarily for the study of
31
thermal anomalies [5, 6, 7], morphologic classification [8], evolution of the volcanic dome [9, 10],
32
among others.
33
Because of the deformation of the surface of the Earth, one can hope detecting these changes
34
with a remote sensor; however, remote sensors depending on your bandwidth and radiometric
35
resolution are not able to detect these changes on the surface or, in other words, the change of the
36
terrain texture [11]. Specifically, in the range of visible wavelengths some shape changes do not alter
37
the colour field, in this case the changes go unnoticed, on the other hand, in the range of radar
38
wavelength it is impossible to detect changes in form altering the earth's surface that are parallel to
39
the line of flight of the satellite platform (azimuthal direction).
40
41
The texture theme discussed in the literature distinguishes four methods, mainly: statistical,
42
geometric or structural, based on models and based on transforms or signal processing [12, 13, 14,
43
15, 16].
44
Because of these methodologies, a number of products obtained need to be validated, it is
45
necessary to establish measures that allow a comparison sizing the existence of changes. In the case
46
of grayscale representations, it is common to use similarity metrics [17], correspondence regions [18]
47
or disparity maps [19].
48
1.1. Hypothesis
49
Volcanic eruptions have shaped the surface of the Earth from its early origin. Movement of
50
magma through the volcanic edifice characterizes these processes. This process can occur with
51
deformation of the surrounding surface or it may be overlooked from the geomorphological point of
52
view, however, the impact on the surface of the Earth of volcanic ash, Pyroclastic flows and
53
morphological deformations, depending on the scale, may become evident and measurable by
54
sensors deployed in satellite platforms in almost all ranges of the electromagnetic spectrum.
55
Algorithms such as co-occurrence matrix, wavelet transform, Sobel operator and growth regions
56
have been successful to classify satellite images for their texture. Therefore, if there are changes in
57
the texture of the surface of the Earth in a volcanic eruption process, they should be classifiable and
58
measurable to a scale consistent with the resolution of the sensor. Using Landsat satellite images
59
with algorithms validated in the literature for seeking changes in the texture of the surface of the
60
Earth can prove useful for solving this problem.
61
62
2. Materials and Methods
63
2.1. Study area
64
This study builds on two very different scenarios from the geographical point of view, but they
65
have in common the type of eruption. The first scenario, identified as test sector, is the Lascar
66
volcano located in northern Chile about 70 km SE of San Pedro de Atacama, in the second region of
67
Antofagasta [1]. The second scenario, identified as validation sector, corresponds to Chaiten volcano
68
in southern Chile located about 10 km to the east of the Gulf Corcovado [20] in the region of Los
69
Lagos.
70
According to its shape, the first corresponds to a volcano of mixed type composed of two
71
irregular cones and truncated [1], while the second is a caldera type volcano composed of a complex
72
of domes of rhyolite [20].
73
Regarding the eruptive activity of these volcanoes, Lascar presents a constant activity especially
74
in the period 1989 - 2001, with the eruption of major importance which occurred in April 1993,
75
corresponding to an eruption of subplinian type generating an eruptive column up 25 km high [1].
76
Whereas the volcano Chaiten has no constant activity, such that the first historical eruption occurred
77
in May 2008 [21], characterized as subplinian type generating an eruptive column up to 19 km high
78
[22].
79
The images used for the implementation and development of this work were obtained from the
80
image bank of the National Institute of Special Investigations (INPE), Brazil. From the products
81
available, images captured by the satellite Landsat 5 TM sensor for the test area, and satellite images
82
Landsat 7 ETM + sensor for the validation sector were used, which have a temporary coverage that
83
covers pre period and post events. Checkpoints and radiometric correction were performed
84
according to the methodology proposed by [23], thereby achieving a common radiometric scale and
85
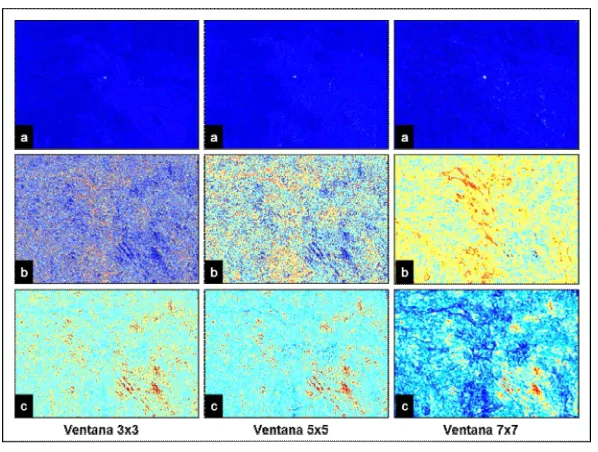
its conversion to radiance and thus obtaining a common basis for comparison.
86
2.2. Development
87
In our research, we plan and develop two scenarios, both in order to test our hypothesis. In
88
particular, we need a strategy to demonstrate a change of background texture to an eruptive event.
89
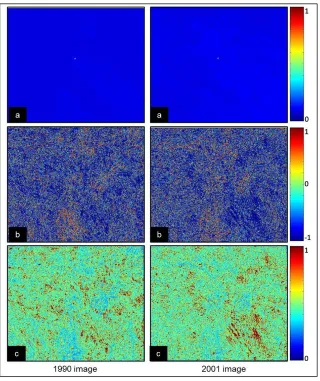
This process is especially complex when trying to classify a soil obviously created by volcanic
90
activity in its recent geological past with an activity past volcanic immediately as in the case of
91
Lascar (1993), in the Atacama desert of northern Chile. The second scenario is the event of the
Chaitén volcano (2008). These scenarios are essentially characterized by their differences in climate
93
and vegetation.94
2.2.1. Methodology95
The methodology used, contemplates using the Karhunen-Loeve transform to obtain a set of
96
images called principal components to choose the ones that present better contrast. This technique is
97
widely used in the literature [1, 24], to reduce the number of bands having high correlation, such as
98
the TM and ETM + sensor [25, 26].
99
The covariance matrix [24] was used to obtain the main components. As for the choice of the
100
component selected, although the greater variability of information occurs in the first three principal
101
components, in our study we used the third component.
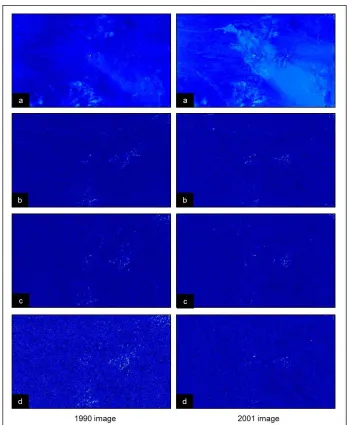
102
2.2.2. Study rationale
103
The texture on a satellite image is understood as the spatial distribution of gray tones and their
104
statistics such as uniformity, density, roughness, regularity, linearity, direction, frequency and phase
105
[27], thickness and intensity [11, 28]. In short, what is sought is to capture these qualities in order to
106
characterize the texture analytically, to mathematically model these spatial interactions [29]. The
107
characterization has been grouped into four methods which are statistical, geometric or structural,
108
based on models and based on transforms or signal processing [12, 13, 14, 15, 16].
109
In our work, with the purpose of demonstrating change in texture, two methodologies are
110
implemented: statistical methods and signal processing. Regarding the first, co-occurrence matrix is
111
used. The second method uses wavelet transform, which has a number of characteristics that lead to
112
its use as are its ability to locate spectral characteristics of a signal in time or space [13], can vary the
113
spatial resolution and representing textures of various natures [16].
114
The matrix of co-occurrence represents changes in the distribution of intensities or gray levels of
115
an image and whose elements indicate the frequency with which two gray levels, say i and j are
116
given in the image taking pixels in pairs and separated by a distance d according to a given
117
orientation θ [16].
118
(1)
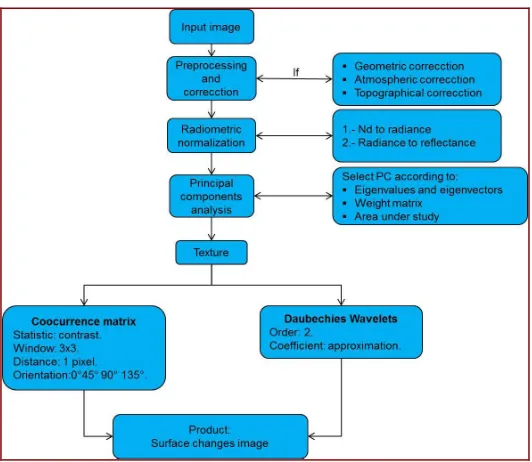
119
Where Pi, j is the number of times an event occurs, divided by the total number of possible
120
events, then obtaining a probability matrix; from this it is possible to extract certain statistics that
121
model the texture [11].
122
For texture estimation in a satellite image, using these statistics requires the determination of a
123
sliding window in which the matrix of co-occurrence is obtained, therefore the respective descriptor
124
whose value represents the entire window, is assigned to pixel corresponding image textures. In
125
determining the size of the window there are no specific rules, but there exist some considerations:
126
1. A large window involve considering information about contiguous pixels belonging to
127
another class that interfere in the calculation, while in a small window do not exist sufficient
128
information to show the entire pattern of the texture element [16] .
129
2. The choice of window size is based on the image resolution, the minimum unit size mapping,
130
properties or characteristics of the classification and the nature of the object of study [30].
131
3. From studies using the co-occurrence matrix, most used windows have been 3x3, 5x5, 7x7,
132
11x11, 21x21, and even 65x65.
133
The wavelet is defined as an oscillatory function of small size, which has both spatial and
134
frequency localization simultaneously [31].
135
(2)
136
Where s is the scaling factor and u is the translation factor [32].
To apply the Discrete Wavelet Transform (DWT) on images, the most common form uses filter
138
banks, highpass and lowpass [32]. These filters are applied to the rows and then the columns, in each
139
step, a subsampling is performed by a factor of two, (data is halved), then turning the first level of
140
transformation (scaling), breaking the image into a series of sub-images of low frequency and a set of
141
high-frequency detail.
142
143
3. Results
144
To obtain preliminary textural products using different methodologies, the following
145
conditions were considered:
146
1. Co-occurrence matrix: window size of 3x3 pixels to obtain the co-occurrence matrix, with a
147
distance one between pixels. As to the orientation, the orientation of 135 ° is used, being coincident
148
with the orientation in which pyroclastic flows were deposited, derived from the main events of the
149
Lascar volcano, these being northeast and mainly southeast.
150
2. Discrete Wavelet Transform: in the absence of standardization regarding the use of wavelet
151
families to obtain textures, we choose to implement Daubechies wavelet of order 2.
152
The products obtained are presented graphically using Matlab colormap.
153
154
155
156
Figure 1. Lascar Volcano, co-occurrence matrix.
157
a) Contrast, b) Correlation, c) Energy.
158
162
Figure 2. Lascar Volcano, Daubechies wavelet coefficients of order 2
163
a) Approximation, b) Horizontal, c) Vertical, d) Diagonal.
164
165
166
4. Discussion
167
Co-occurrence matrix: to check the influence that the window size has regarding the results
168
obtained, the sizes of 3x3, 5x5 and 7x7 were analyzed. Figure 3 shows that increasing the window
169
size, co-occurrence images are obtained with a coarse texture, highlighting in the case of 7x7 the
170
correlation statistics and energy, which define the contour of the reservoir lavas of the northwest
171
slope with respect to the center of the volcano, not so the contrast statistic, which has a fairly regular
172
intensity. The smaller window sizes, 3x3 and 5x5, have more homogeneous textures with little
173
definition of bodies or covers; in particular highlighting the contrast statistic, which highlight the
174
areas defined as change mainly in the 3x3 window.
175
Focusing the analysis on the statistical test, it is possible to observe from the color bar of Figure
176
1, that the concentration value is predominantly at the bottom of it, which shows that the differences
177
between the central pixel and its neighbours in the matrix have no great difference, corresponding to
178
a high number of digital levels of similar value. Statistically, the above is reflected in the
179
co-occurrence matrix where the diagonal closest values will indicate a low-contrast image, while that
180
in a contrasted image there will be a greater number of non-zero elements outside of it.
182
Figure 3. Results for different window sizes. 2001 image.
183
a) Contrast b) Correlation, c) Energy.
184
185
Wavelet Transform: good results have been obtained using the Coiflet wavelet for the
186
classification of agricultural landscapes by texture [33]; in experimental work using the Vistex data
187
base using the Symlet wavelet [34]. In the texture classification of high-resolution images using
188
wavelet Daubechies, Coiflet, Symlet, Battle-Lemarie, Shannon and Meyer [35]; using the Haar
189
wavelet for urban classification by texture [36] and other using Haar wavelets, Coiflet, Daubachies
190
using the album of Brodatz [37], or the topographic analysis strato-volcanos using Meyer wavelet
191
[38]. In the absence of standardization regarding the use of wavelet families to obtain textures, we
192
chose to implement the wavelet of Daubechies. Firstly, because it has a compact support, i.e. its
193
domain is limited and defined in a closed interval, and there is therefore a number of coefficients
194
and wavelet defined [39, 40]. It is orthogonal, allowing a reconstruction image like the original, in
195
the absence of redundant information [39, 41]. Finally, it does not have an analytic expression; its
196
implementation is performed using digital filters [39, 41].
197
For finding the coefficients of Daubechies wavelet of order 2, shown in Figure 2, low pass
198
filtering was used to rows and columns. As for coefficients of horizontal, vertical and diagonal detail
199
corresponding to high frequencies, they do not provide nuances of interest when it comes to finding
200
superficial defects.
201
Change detection aims to detect and account for the transformations occurring in a specific area
202
at a particular time basis for it in determining correspondences or differences. To carry out these
203
metrics, a pattern is set; this pattern is composed of the pixel you want to find its equal and its
204
neighbors in a 3x3-size environment.
205
Evaluation: By implementing similarity metrics with an orientation of zero degrees and zero
206
offset pixels, it is possible to account for the existing surface changes in the period 1990 - 2001. The
207
1990 image is set as a reference and the 2001 image as the similarity search area.
210
Figure 4. Results for similarity metric.
211
a) Contrast, b) Approximation coefficients.
212
213
214
Applying the normalized cross-correlation (NCC) to contrast images and approximation
215
images (Figure 4), we appreciate a marked tendency to the maximum value, according to the color
216
bar, which indicates that there is a great similarity between the standard image and that of search.
217
As for the sum of absolute differences (SAD), it is understood that there is a greater correspondence
218
in those sectors where the sum of the difference is minimal. Figure 4 shows that for contrast statistics
219
values are obtained close to the minimum value, while for the approximation coefficient, the values
220
are positioned in the middle of the color table, presenting an image with good definition of change
221
areas, therefore superficial defects are easy to observe. The sum of squared differences (SSD) metric
222
means that there is similarity between the reference image and search image when the value
223
obtained of the squared differences is zero. As in the SAD, the products derived from this metric for
224
contrast statistics concentrate on the minimum value. Not so for the approach coefficient presented
225
by the existence of light colors changes. It is understood that the difference between the SAD and the
226
SSD is that the latter gives greater weight to regions with large differences. The results obtained by
227
these metrics depend largely on the window size used to capture differences. A small window (3x3)
228
may not be large enough to capture the variability from one image to another, while a window too
229
large (7x7) is sensitive to the variability of different coverages, giving little definition to the edges.
230
4.1. Proposed algorithm
231
The following methodology is proposed, taking into consideration the theoretical aspects
232
discussed in this study and the results obtained, corresponding to a combination of techniques such
233
that, given a set of input images, we detect surface changes.
235
Figure 5. Flowchart for our proposed change detection method.
236
237
4.1.1. Parameterization of the algorithm
238
It will be understood as parameterization of the algorithm, the establishment of conditions and
239
restrictions, both the data required as the routines implemented in order to obtain reliable products.
240
1. Regarding the subject of study. In the particular case of this work, the general objective is to
241
detect surface changes derived from eruptive events in a particular period, therefore, this
242
methodology is recommended for studies of volcanic eruptions of Plinian, Vulcan and / or
243
estrombolian types, whose products are mainly solid or pyroclastic material.
244
2. With respect to the input images. The input images must have equivalent characteristics in
245
terms of its resolutions. They must be pre-treated to eliminate or reduce any anomalies, as long as
246
these treatments do not cause great alteration of the information.
247
Being images with different temporality, is recommended a standardized way to achieve a
248
common radiometric scale, for that, the images should be treated by converting digital levels to
249
radiance and then to reflectivity.
250
The next step is the orthogonal linear transformation, to synthesize information and reduce any
251
possible correlation between bands. This requires getting the principal components. Analysis of
252
these components determine the most appropriate for the study.
253
3. Regarding the techniques for obtaining texture
254
For obtaining products that account for surface changes the co-occurrence matrix and discrete
255
wavelet transform are proposed.
256
Of the statistics that can be obtained from the co-occurrence matrix, contrast is suggested,
257
although others that could also be implemented. This statistic does show the texture of the areas
258
identified as superficial change.
259
From the results it appears that a window size of 3x3 is ideal to avoid a contamination effect,
260
however, if the images used have a high geometric resolution, it is pertinent an analysis of the effect
261
of any larger window size. Regarding the separation between pixels a distance of one is the
262
recommended value, and in terms of orientation, it is preferable a preliminary analysis of the study
263
area in order to detect the preferred direction in which the various volcanic products are deposited.
264
Of the existing wavelet families, it is suggested using wavelet Daubechies of order 2, higher
265
orders involve a reduction in the size of the image due to subsampling or decimation process. From
266
the coefficients obtained, the approximation is delivering a unique product for this study.
267
4.1.2. Validation of the methodology
By way of validating the proposed methodology, results are shown below:
269
1. The most important eruptive events of the Lascar volcano for the interval 1990-2001,
270
occurred between 1990-1993, 1994-1995 and 2000-2001.
271
2. Chaiten volcano eruptive event occurred on May 2, 2008.
272
273
First test, Lascar volcano
274
Table 1. Lascar volcano main specs.
275
Location Latitude: 23°21'55.66"S
Longitude: 67°44'3.93"O
Average height 5592 m.a.s.l.
Shape Volcano composed of mixed type.
Type of eruption Volcanic eruptions, strombolian activity and Plinian eruptions.
Activity Seismic activity, underground noises, ejection of pyroclastic explosions, eruptive column.
Source: SERNAGEOMIN (Chile).
276
277
Table 2. Technical specs of texture. periods 1990-1993, 1994-1995 and 2000-2001.
278
Image Landsat 5 TM
Principal component N° 3.
279
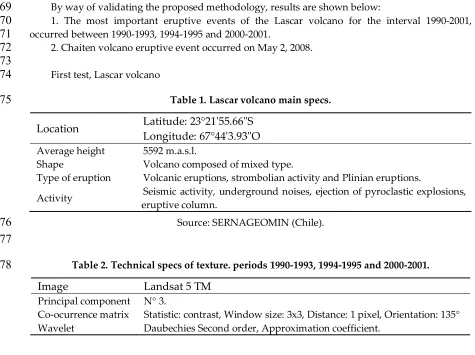
Figure 6. Detection of superficial changes, period 1990-1993
280
a) Principal component, b) Co-occurrence matrix, c) Wavelet.
281
283
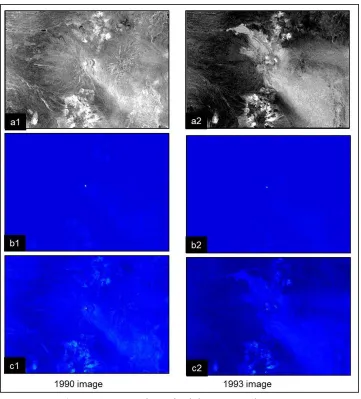
Figure 7. Detection of superficial changes, period 1994-1995.
284
a) Principal component, b) Co-occurrence matrix, c) Wavelet.
285
287
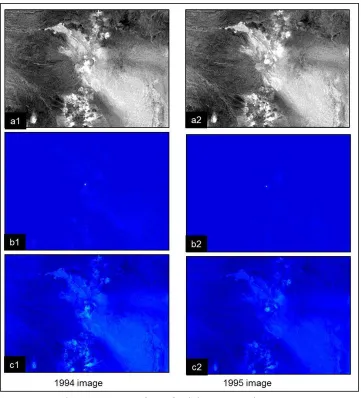
Figure 8. Detection of superficial changes, period 2000-2001.
288
a) Principal component, b) Co-occurrence matrix, c) Wavelet.
289
290
Second Test: Chaiten volcano
291
Table 3. Chaiten volcano main specs.
292
Location Latitude:42° 50' 8.51" S
Longitude:72° 39' 2.01" O
Average height 950 m.a.s.l
Shape Volcano type caldera
Type of eruption Subplinian.
Activity Seismic activity, pyroclastics ejection, explosion, eruption column, lava dome, lahars.
Source: SERNAGEOMIN (Chile).
293
294
295
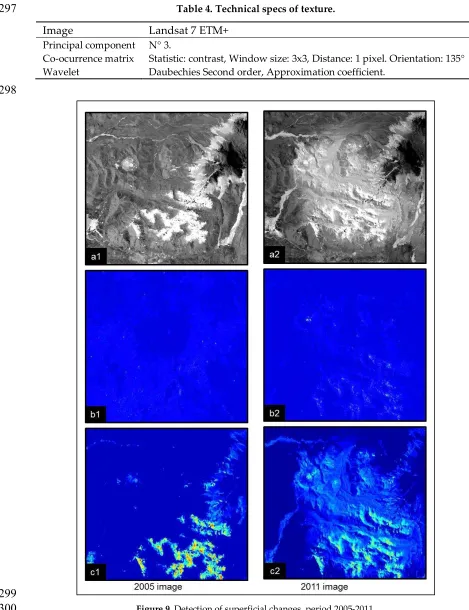
Table 4. Technical specs of texture.
297
Image Landsat 7 ETM+
Principal component N° 3.
Co-ocurrence matrix Statistic: contrast, Window size: 3x3, Distance: 1 pixel. Orientation: 135° Wavelet Daubechies Second order, Approximation coefficient.
298
299
Figure 9. Detection of superficial changes, period 2005-2011.
300
a) Principal component, b) Co-occurrence matrix, c) Wavelet.
301
302
5. Conclusions
303
As it has been established, change detection aims to detect and account for the changes in a
304
bounded area over a period. Through the study of the theoretical foundations and the analysis of the
results obtained by different techniques and methodologies presented, it has been possible to
306
develop an algorithm to detect surface changes resulting from eruptive events.
307
It has been further demonstrated by different scenarios, that this methodology is valid and
308
therefore can be a contribution to the monitoring and study of possible precursors of an eruptive
309
event if deformation occurs in the volcano during this process.
310
Finally, through the processes developed and the various tests, the hypothesis established at the
311
beginning of this work should be considered, in view of the results, valid.
312
313
Author Contributions: Fernández L., Álvarez G., and Salinas R., conceived and designed the experiments;
314
Fernández L., Analyzed the data, implemented algorithms, processed satelital images finally the summary and
315
discussion was a contributions of all authors.
316
Conflicts of Interest: The authors declare no conflict of interest.
317
References
318
1. Fernández, L.; Álvarez, G.; Salinas, R. Impact area determination of pyroclastic deposits in Lascar volcano,
319
eruptive process in the year 1993. Natural Hazards, 2011, 60, 747–760, 10.1007/s11069-011-0048-6.
320
2. Ortiz, R. (ed). Riesgo volcánico. Serie Casa de Los Volcanes N° 5. Servicio de publicaciones del Cabildo
321
Insular de Lanzarote, Canarias, España, 1996. 304.
322
3. Whelley, P.L.; Jay, J.; Calder, E.S.; Pritchard, M.E.; Cassidy, N.J.; Alcaraz, S.; Pavez, A. Post-depositional
323
fracturing and subsidence of pumice flow deposits: Lascar Volcano, Chile, Bull Volcanol, 2011, 74, 511–531,
324
10.1007/s00445-011-0545-1.
325
4. Pavez, A.; Remy, D.; Bonvalot, S.; Diament, M.; Gabalda, G.; Froger, J-L.; Julien, P.; Legrand, D.; Moisset,
326
D. Insight into ground deformations at Lascar volcano (Chile) from SAR interferometry, photogrammetry
327
and GPS data: implications on volcano dynamics and future space monitoring. Remote Sensing of
328
Enviroment, 2006, 100, 307–320, 10.1016/j.rse.2005.10.013.
329
5. Glaze, L.; Francis, P.W.; Rothery, D.A. Measuring thermal budgets of active volcanoes by satellite remote
330
sensing. Nature 1989, 338, 144–146, 10.1038/338144a0.
331
6. Glaze, L.S.; Francis, P.W.; Self, S.; Rothery, D.A. The 16 september 1986 eruption of Lascar volcano, north
332
Chile: Satellite investigations. Bull Volcanol, 1989, 51, 149-160, 10.1007/BF01067952.
333
7. Wooster, M.J. Long-term infrared surveillance of Lascar volcano: contrasting activity cycles and cooling
334
pyroclastics. Geophysical research letters, 2001, 28, 847-850, 10.1029/2000GL011904.
335
8. Bailey, J.E.; Self, S.; Wooller, L.K.; Mouginis-mark, P.J. Discrimination of fluvial and eolian features on
336
large ignimbrite sheets around la Pacana Caldera, Chile, using Landsat and SRTM-derived DEM. Remote
337
Sensing of Environment 2007, 108, 24–41, 10.1016/j.rse.2006.10.018.
338
9. Francis, P.W.; Rothery, D.A. Using the Landsat Thematic Mapper to detect and monitor active volcanoes:
339
an example from Lascar volcano, northern Chile. Geology 1987, 15, 614–617,
340
10.1130/0091-7613(1987)15<614:UTLTMT>2.0.CO;2.
341
10. Oppenheimer, C.; Francis, P.W.; Rothery, D.A.; Carlton, R.W.T.; Glaze, L.S. Infrared image analysis of
342
volcanic thermal features: Lascar volcano, Chile, 1984– 1992. Journal of Geophysical Research 1993, 98,
343
4269–4286, 10.1029/92JB02134.
344
11. Haralick, R.M.; Shanmugam, K.; Dinstein, I. Textural features for image classification. IEEE transactions on
345
Systems, Man, and Cybernetics 1973, SMC-3, 610-621, 10.1109/TSMC.1973.4309314.
346
12. Tuceryan, M.; Jain, A.K. Texture Analysis. In The Handbook of Pattern Recognition and Computer Vision, 2nd
347
ed.; Chen, C., Pau, L. F., Wang P.S.P (eds.); World Scientific Publishing Co., 1998, 207-248.
348
10.1142/9789814343138_0010.
349
13. Materka, A.; Strzelecki, M. Texture Analysis Methods – A Review. Technical University of Lodz, Institute
350
of Electronics, COST B11 report, Brussels 1998; 9-11.
351
14. Epifanio, I. Descripción de texturas. Aplicaciones a su compresión y clasificación. Tesis doctoral,
352
Universidad de Valencia, Facultad de Matemáticas, Departamento de Estadística e Investigación
353
Operativa, España, 2002.
354
15. Fernández, A. Estudio de técnicas basadas en la transformada wavelet y optimización de sus parámetros
355
para la clasificación por texturas de imágenes digitales. Tesis doctoral, Universidad Politécnica de
356
16. Iglesias, P. Estrategias de clasificación de texturas en imágenes forestales hemisféricas. Tesis de maestría,
358
Universidad Complutense de Madrid, Facultad de Informática, Departamento de Ingeniería del Software
359
e Inteligencia Artificial, España, 2009.
360
17. Svedlow, M.; Mcgillem, C.D.; Anuta, P.E. Experimental examination of similarity measures and
361
preprocessing methods used for image registration. In The LARS Symposia , Purdue University, EE. UU.,
362
1976; 9-17.
363
18. Marcello, J.; Eugenio, F.; Marqués, F. Evaluación de técnicas de correspondencia de regiones para la
364
estimación del movimiento superficial del océano. Revista de Teledetección 2007, 2007, 32-42.
365
19. Colodro, C.C.; Toledo, J.; Martínez, J.J.; Garrigós, J.; Ferrández, M. Evaluación de algoritmos de
366
correspondencia estereoscópica y su implementación en FPGA. XII Jornadas de Computación Reconfigurable y
367
Aplicaciones (JCRA), 2012; 88-93.
368
20. Pierson, T.C.; Major, J.J.; Amigo, Á.; Moreno, H. Acute sedimentation response to rainfall following the
369
explosive phase of the 2008–2009 eruption of Chaitén volcano, Chile. Bull Volcanol, 2013, 75, 1-17,
370
10.1007/s00445-013-0723-4.
371
21. Venzke, E.; Sennert, S.K.; Wunderman, R. Reports from the Smithsonian’s Global Volcanism Network,
372
April 2008. Bull Volcanol, 2008, 71, 225-226, 10.1007/s00445-008-0237-7.
373
22. Alfano, F.; Bonadonna, C.; Gurioli, L. Insights into eruption dynamics from textural analysis: the case of
374
the May, 2008, Chaitén eruption. Bull Volcanol, 2012, 74, 2095-2108, 10.1007/s00445-012-0648-3.
375
23. Chander, G.; Markham, B.L.; Helder, D.L. Summary of current radiometric calibration coefficients for
376
Landsat MSS, TM, ETM+, and EO-1 ALI sensors. Remote sensing of environment, 2009, 113, 893-903,
377
10.1016/j.rse.2009.01.007.
378
24. Gupta, R.P.; Tiwari, R.K.; Saini, V.; Srivastava, N.A. Simplified approach for interpreting principal
379
component images. Advances in Remote Sensing, 2013, 2, 111-119, 10.4236/ars.2013.22015.
380
25. Chuvieco, E. Teledetección ambiental. La observación de la Tierra desde el Espacio, 1a ed; Barcelona:
381
Editorial Ariel S.A., España, 2002; 592. ISBN 9788434480476.
382
26. Cheng, Q.; Jing, I.; Panahi, A. Principal component analysis with optimum order sample correlation
383
coefficient for image enhancement. International Journal of Remote Sensing, 2006, 27, 3387-3401,
384
10.1080/01431160600606882.
385
27. Passoni, L. Modelos en bioingeniería: caracterización de imágenes estáticas y dinámicas. Tesis doctoral,
386
Universidad del Mar del Plata, Facultad de Ingeniería, Argentina, 2005.
387
28. González, R.; Woods, R. Digital Image Processing, 3a. ed; United States of America: Perarson Prentice
388
Hall. 2008; pp. 976. ISBN 9780131687288.
389
29. Gomez, M.; Salinas, R.A. New technique for texture classification using Markov Random Fields.
390
International Journal of Computers, Communications & Control, 2006, 1, 41-51, 10.15837/ijccc.2006.2.2284.
391
30. Myint, S.W. Fractal approaches in texture analysis and classification of remotely sensed data: comparisons
392
with spatial autocorrelation techniques and simple descriptive statistics. International Journal of Remote
393
Sensing, 2003, 24, 1925-1947, 10.1080/01431160210155992.
394
31. Martínez, P. Modelos difusos de textura basados en la percepción. Tesis doctoral, Universidad de
395
Granada, Departamento de Ciencias de la Computación e Inteligencia Artificial, España, 2012.
396
32. Ruiz, L.A.; Recio, J.A.; Fernández, A. Clasificación de entornos forestales mediterráneos mediante
397
técnicas de análisis de texturas. Cuadernos de la Sociedad Española de Ciencias Forestales, 2005; Num.19,
398
187-192, 10.31167/csef.v0i19.
399
33. Ruiz, L.A.; Fernández, A.; Recio, J. Evaluation of texture analysis techniques to characterize vegetation.
400
Proceedings International Symposium on Recent Advances in Quantitative Remote Sensing, Universitat
401
de València, Valencia, Spain, 2002, Sobrino, J. A.; 1, 514-521.
402
34. Arivazhagan, S.; Ganesan, L. Texture classification using wavelet transform. Pattern Recognition Letters,
403
2003, 24, 1513-1521, 10.1016/S0167-8655(02)00390-2.
404
35. Fernández, A.; Ruiz, L.A.; Recio, J. Study of methods based on wavelets for texture classification of high
405
resolution images. In Proceedings of the 25th EARSeL Symposium on Global Developments in
406
Environmental Earth Observation from Space, Porto, Portugal, 2005; 19-25.
407
36. Chen, J.; Chen, D.; Blostein, D. Wavelet-Based classification of remotely sensed images: a comparative
408
study of different feature sets in an urban environment. Journal of Environmental Informatics, 2007, 10, 2-9,
409
37. Raju, U.S.N.; Kumar, V.V.; Suresh, A.; Mani, M. Texture description using different wavelet transforms
411
based on statistical parameters. Proceedings of the 2nd WSEAS International Symposium on WAVELETS
412
THEORY & APPLICATIONS in Applied Mathematics, Signal Processing & Modern Science (WAV '08),
413
Istanbul, Turkey, 2008; 174-178.
414
38. Gomez, C. Multi-scale topographic analysis of Merbabu and Merapi volcanoes using wavelet
415
decomposition. Environmental Earth Sciences, 2012, 67, 1423-1430, 10.1007/s12665-012-1587-1.
416
39. Misiti, M.; Misiti, Y.; Oppenheim, G.; Poggi. J. Wavelet Toolbox For Use with MATLAB®. User’s Guide
417
Version 1. The MathWorks Inc., Natick, Mass, 1996.
418
40. Represa, C. Una nueva aproximación a la multirresolución en el dominio del tiempo (MRTD), basada en la
419
transformada discreta en Wavelets. Tesis Doctoral, Universidad de Burgos, Departamento de Ingeniería
420
Electrónica, España, 2002.
421
41. Pardo, E. Trasformadas Wavelet no diezmadas para reducción de ruido y detección de señales:
422
aplicaciones en evaluación no destructiva por ultrasonidos. Tesis doctoral, Universidad Politécnica de
423
Valencia, Departamento de Comunicaciones, España, 2011.
424