Quantitative proteomics at different depths in human articular cartilage
reveals unique patterns of protein distribution
Catharina Müller
a,1,2, Areej Khabut
b,2, Jayesh Dudhia
c, Finn P. Reinholt
d, Anders Aspberg
a,
Dick Heinegård
b,3, Patrik Önnerfjord
b,⁎
a
Department of Biology, University of Copenhagen, Biocenter, DK-2200 Copenhagen N, Denmark b
Department of Clinical Sciences Lund, Lund University, BMC-C12, 221 84 Lund, Sweden c
Department of Clinical Sciences and Services, The Royal Veterinary College, University of London, Hatfield, United Kingdom d
Department of Pathology, University of Oslo and Oslo University Hospital, Rikshospitalet, Oslo, Norway
a b s t r a c t
a r t i c l e i n f o
Article history: Received 11 June 2014
Received in revised form 20 August 2014 Accepted 22 August 2014
Available online 1 September 2014
Keywords: Articular cartilage Cartilage biology
Extracellular matrix proteins Proteomics
Proteoglycan
Multiple reaction monitoring
The articular cartilage of synovial joints ensures friction-free mobility and attenuates mechanical impact on the joint during movement. These functions are mediated by the complex network of extracellular molecules characteristic for articular cartilage. Zonal differences in the extracellular matrix (ECM) are well recognized. However, knowledge about the precise molecular composition in the different zones remains limited. In the present study, we investigated the distribution of ECM molecules along the surface-to-bone axis, using quantita-tive non-targeted as well as targeted proteomics.\
In a discovery approach, iTRAQ mass spectrometry was used to identify all extractable ECM proteins in the different layers of a human lateral tibial plateau full thickness cartilage sample. A targeted MRM mass spectrom-etry approach was then applied to verify thesefindings and to extend the analysis to four medial tibial plateau samples.
In the lateral tibial plateau sample, the unique distribution patterns of 70 ECM proteins were identified, revealing groups of proteins with a preferential distribution to the superficial, intermediate or deep regions of articular cartilage. The detailed analysis of selected 29 proteins confirmed thesefindings and revealed similar distribution patterns in the four medial tibial plateau samples.
The results of this study allow, for thefirst time, an overview of the zonal distribution of a broad range of cartilage ECM proteins and open up further investigations of the functional roles of matrix proteins in the different zones of articular cartilage in health and disease.
© 2014 Published by Elsevier B.V. This is an open access article under the CC BY-NC-ND license (http://creativecommons.org/licenses/by-nc-nd/3.0/).
1. Introduction
Articular cartilage is a highly specialized tissue that serves to facilitate joint mobility and to withstand mechanical load on the joint (Buckwalter and Mankin, 1998; Bhosale and Richardson, 2008). Its extensive ECM has a unique composition to meet the specific needs of the tissue (Mow et al., 1992). It consists mainly of collagens and heavily
charged proteoglycans. A variety of non-collagenous matrix proteins add to the complexity and is important for ECM assembly and tissue maintenance (Heinegård, 2009; Schaefer and Schaefer, 2010).
The articular cartilage matrix is organized differently depending on the distance from the chondrocyte but also depending on the depth from the articular surface (Buckwalter and Mankin, 1998; Guilak et al., 2006; Bhosale and Richardson, 2008; Mittelstaedt et al., 2011). Four zones are distinguished morphologically from the articular cartilage surface to the cartilage–bone interface (Kato et al., 1988; Buckwalter and Mankin, 1998; Hunziker et al., 2002; Bhosale and Richardson, 2008;Fig. 1). The thin superficial zone is characterized byflattened ellipsoid cells and thin collagenfibrils arranged parallel to the surface, providing shear and tensile strength. The intermediate zone contains spheroid-shaped cells and randomly arrangedfibres. The deep zone is rich in glycosaminoglycans and shows spheroid-shaped chondrocytes, which are arranged in columns perpendicular to the surface (Youn et al., 2006). The zone of calcified cartilage connects to the subchondral bone (Redler et al., 1975; Hoemann et al., 2012).
Abbreviations:ECM, extracellular matrix; iTRAQ, isobaric tags for relative and absolute quantification;LTP, lateral tibial plateau;MS, mass spectrometry; MTP, medial tibial plateau; MRM, multiple reaction monitoring.
⁎ Corresponding author at: Department of Clinical Sciences Lund, Section of Rheumatology, BMC-C12, Lund University, SE-22184 Lund, Sweden. Tel.: + 46 46 2223129; fax: +46 46 2113417.
E-mail addresses:[email protected](C. Müller), [email protected](P. Önnerfjord).
1
Present address: Department of Experimental Medical Science, Lund University, BMC-D12, 221 84 Lund, Sweden.
2
Catharina Müller and Areej Khabut contributed equally to this work. 3
Deceased.
http://dx.doi.org/10.1016/j.matbio.2014.08.013
0945-053X/© 2014 Published by Elsevier B.V. This is an open access article under the CC BY-NC-ND license (http://creativecommons.org/licenses/by-nc-nd/3.0/).
Contents lists available atScienceDirect
Matrix Biology
Events that lead to changes in this intricate organization may lead to the development of pathological conditions (Heinegård, 2009). Mechanical injury or disturbances of tissue maintenance, as for example in osteoarthritis, may trigger cells to alter the ECM structure and thus impair the mechanical strength of the tissue (Hunziker, 2002). To understand pathological processes and allow more accurate diagnosis and tailor-made therapy of joint diseases, it is important to know the molecular composition of the tissues involved, including variations between the different zones of the cartilage.
In the past, several studies have been undertaken to characterize these zones with regard to structural organization (Hunziker et al., 2002; Schumacher et al., 2002; Youn et al., 2006), and protein localisation (Schumacher et al., 1994; DiCesare et al., 1995; Lorenzo et al., 1998a; Pfister et al., 2001; Söder et al., 2002; Veje et al., 2003). Generally, these studies focused on one or two components, due to technical restrictions, and could therefore not provide a broad overview. Recently, genomic (Fukui et al., 2008; Grogan et al., 2013) and proteomic studies (Zhang et al., 2011; Cillero-Pastor et al., 2013) were applied to investigate gene expression and protein distribution patterns with a broader scope. Challenges with articular cartilage proteomics include the scarce availability of healthy human articular cartilage biopsies, the high degree of cross-linking between the ECM molecules, and the difficulty in identifying low abundant proteins, particularly in the presence of highly abundant proteins and proteogly-cans such as collagens and aggrecan.
The aim of the present study was to quantitatively analyze extract-able proteins in human articular cartilage to provide a detailed overview of the protein distribution. This was achieved byfirst applying a non-targeted mass spectrometry approach (iTRAQ technology) and subsequently by analyzing protein distribution in detail using a targeted approach (MRM technology;Fig. 2).
We found unique patterns of protein distribution throughout the different zones of the articular cartilage. This detailed characterization strengthens our understanding of articular cartilage matrix composition and forms the basis for further investigations of key molecules in tissue function, maintenance and pathology.
2. Results
2.1. Quantitative mass spectrometry—discovery approach
To test the feasibility of the study and to get an overview about the extractable ECM proteins in articular cartilage, iTRAQ labeled protein mixtures of the different depth zones of a LTP sample were analyzed using Q-TOF tandem mass spectrometry. This discovery approach
allowed the quantification of 277 proteins. The total protein list, includ-ing the weighted average protein ratio (versus reference sample) for
each sample pool (pools 1–9) is presented in Supplementary
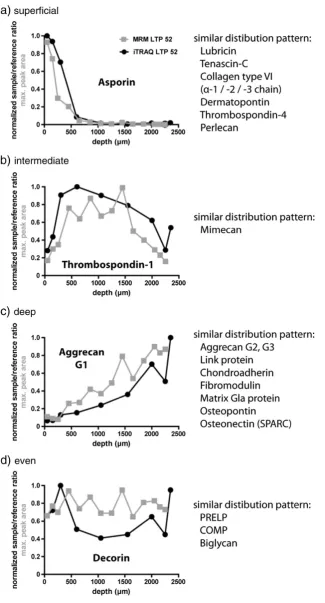
Table S1. Each iTRAQ set was run individually and analyzed separately by calculating the sample-to-reference ratio. The number of peptide ratio measurements for each identified protein varied fromn= 1 (in a few instances listed in italics inTable 1and Supplementary Table S1) to approximately 100 for, e.g. collagen andfibronectin. To focus the analysis on cartilage ECM proteins, a subset of 70 proteins was selected (Table 1). Plasma proteins, membrane proteins and intra-cellular proteins were excluded (Supplementary Table S2). Additionally, collagens except collagen type VI were removed from the list. Due to the high degree of cross-linking in collagens, except collagen type VI, these molecules are poorly extracted and cannot be quantitatively analyzed. Different distribution patterns of ECM proteins in the LTP sample were found (Fig. 3). Several proteins showed a distinct preference for the superficial region, e.g. asporin, tenascin-C and collagen type VI (Fig. 3a). Others were found to be more abundant with increasing depth, e.g. aggrecan (G1, G2 and G3 domains), hyaluronan and proteoglycan link protein 1 (link protein) and chondroadherin (Fig. 3c). Some showed an even distribution throughout the tissue, e.g. decorin and PRELP (Fig. 3d). Only thrombospondin-1 and mimecan were found to be enriched in the middle region (Fig. 3b).
2.2. Data verification using MRM mass spectrometry
From the 70 cartilage ECM proteins identified by the iTRAQ approach, 29 proteins of special interest in articular cartilage were selected for analysis by the MRM technology (marked inTable 1). The advantage of the MRM approach is that pre-optimized assays for selected, unique peptides are used, which provides higher sensitivity. Furthermore, we were able to measure the proteins using a single chromatography step without prior ion-exchange chromatography enabling us to instead take more data points across the cartilage depth, thereby achieving enhanced detail in the protein distribution patterns.
2.3. Protein distribution patterns in four MTP samples
In the four MTP samples (MTP36, MTP43, MTP46 and MTP65), protein distribution patterns similar to the ones identified in the LTP sample were found. For most proteins, the protein distribution pattern of a given protein was similar in the four MTP samples. For a limited num-ber of proteins (fibronectin, versican, COMP and biglycan), no consistent pattern could be established (Fig. 6g; Supplementary Table S4a-e.
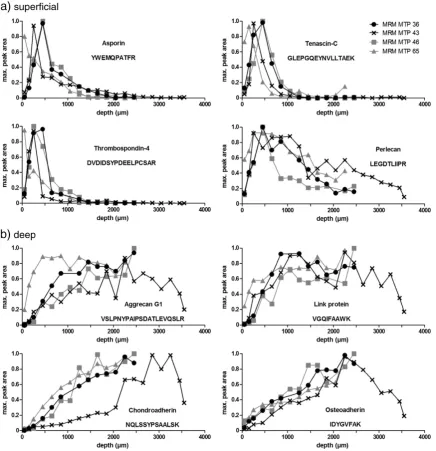
2.3.1. Proteins in the superficial region
Proteins identified with a preferential distribution in the superficial region of the samples were asporin, tenascin-C, thrombospondin-4 and perlecan (Fig. 4a) as well as dermatopontin, collagen alpha-1 (VI) and collagen alpha-3 (VI; Supplementary Table S4a-e). These proteins showed peak abundance within the uppermost 20% of the total tissue depth (Table 2 and Supplementary Table S5). Below the zone of maximum abundance, the protein content decreased rapidly towards the deeper regions.
2.3.2. Proteins in the deep region
Aggrecan G1 domain (as well as the G2 and G3 domains), link protein, chondroadherin and osteoadherin showed a marked increase
of protein content towards the deep region of the samples (Fig. 4b). Further examples are matrix Gla protein, matrilin-3, osteonectin (SPARC) and serin protease HTRA1 (Supplementary Table S4a-e). These proteins showed highest abundance between 60% and 100% of the tissue depth, often in the deepest layers (Table 2and Supplementary Table S5). An exception is aggrecan G1 domain in the MTP65 sample, which peaked at a depth of 850μm and then remained at an even level throughout the deeper tissue. Interestingly, MTP43 stands in sharp contrast to the other MTP samples since the abundance of several proteins was found to decrease towards the deepest layers after a peak at 60%–80% of the tissue depth.
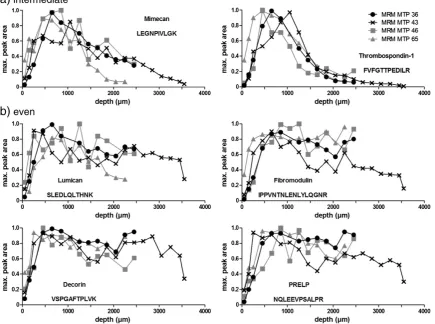
2.3.3. Proteins in the intermediate region
Only mimecan and thrombospondin-1 were found to be enriched in the middle part of the MTP samples (Fig. 5a). They showed highest abundance between 20% and 35% of tissue depth (Table 2). These proteins decreased towards the deeper layer, but not as much as the predominantly superficial proteins.
2.3.4. Evenly distributed proteins
Lumican,fibromodulin, decorin and PRELP showed an even
distribution throughout the tissue (Fig. 5b). However, they seemed to be less abundant in the most superficial layers.
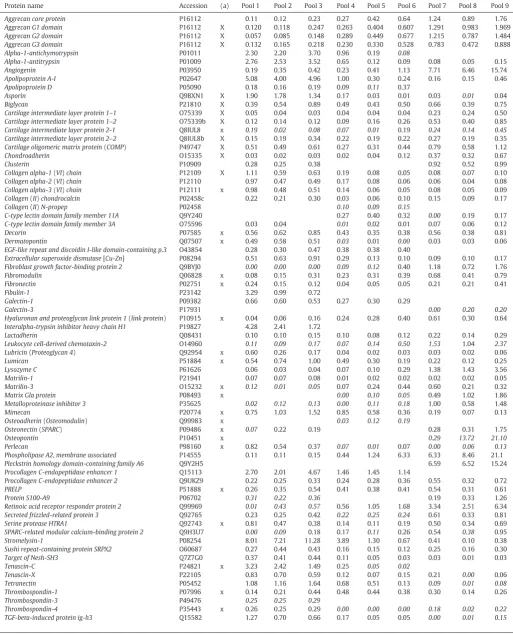
Table 1
Filtered list on quantitative proteomics data of the LTP52 sample (iTRAQ).
The average ratios versus the reference sample are listed. The accession numbers are derived from the SwissProt database. The complete list of identified proteins is available in Supple-mentary Table S1. Single peptide quantifications are shown in italics. Empty cells indicate no identification. Proteins marked in (a) were also measured via MRM mass spectrometry.
Protein name Accession (a) Pool 1 Pool 2 Pool 3 Pool 4 Pool 5 Pool 6 Pool 7 Pool 8 Pool 9
Aggrecan core protein P16112 0.11 0.12 0.23 0.27 0.42 0.64 1.24 0.89 1.76
Aggrecan G1 domain P16112 X 0.120 0.118 0.247 0.263 0.404 0.607 1.291 0.983 1.969
Aggrecan G2 domain P16112 X 0.057 0.085 0.148 0.289 0.449 0.677 1.215 0.787 1.484
Aggrecan G3 domain P16112 X 0.132 0.165 0.218 0.230 0.330 0.528 0.783 0.472 0.888
Alpha-1-antichymotrypsin P01011 2.30 2.20 3.70 0.96 0.19 0.08
Alpha-1-antitrypsin P01009 2.76 2.53 3.52 0.65 0.12 0.09 0.08 0.05 0.15
Angiogenin P03950 0.19 0.35 0.42 0.23 0.41 1.13 7.71 6.46 15.74
Apolipoprotein A-I P02647 5.08 4.00 4.96 1.00 0.30 0.24 0.16 0.15 0.46
Apolipoprotein D P05090 0.18 0.16 0.19 0.09 0.11 0.37
Asporin Q9BXN1 X 1.90 1.78 1.34 0.17 0.03 0.01 0.03 0.01 0.04
Biglycan P21810 X 0.39 0.54 0.89 0.49 0.43 0.50 0.66 0.39 0.75
Cartilage intermediate layer protein 1–1 O75339 X 0.05 0.04 0.03 0.04 0.04 0.04 0.23 0.24 0.50
Cartilage intermediate layer protein 1–2 O75339b X 0.12 0.14 0.12 0.09 0.16 0.26 0.53 0.40 0.85
Cartilage intermediate layer protein 2-1 Q8IUL8 x 0.19 0.02 0.08 0.07 0.01 0.19 0.24 0.14 0.45
Cartilage intermediate layer protein 2–2 Q8IUL8b X 0.15 0.19 0.34 0.22 0.19 0.22 0.27 0.19 0.35
Cartilage oligomeric matrix protein(COMP) P49747 X 0.51 0.49 0.61 0.27 0.31 0.44 0.79 0.58 1.12
Chondroadherin O15335 X 0.03 0.02 0.03 0.02 0.04 0.12 0.37 0.32 0.67
Clusterin P10909 0.28 0.25 0.38 0.92 0.52 0.99
Collagen alpha-1(VI)chain P12109 X 1.11 0.59 0.63 0.19 0.08 0.05 0.08 0.07 0.10
Collagen alpha-2(VI)chain P12110 0.97 0.47 0.49 0.17 0.08 0.06 0.06 0.04 0.08
Collagen alpha-3(VI)chain P12111 x 0.98 0.48 0.51 0.14 0.06 0.05 0.08 0.05 0.09
Collagen(II)chondrocalcin P02458c 0.22 0.21 0.30 0.03 0.06 0.10 0.15 0.09 0.17
Collagen(II)N-propep P02458 0.10 0.09 0.15
C-type lectin domain family member 11A Q9Y240 0.27 0.40 0.32 0.00 0.19 0.17
C-type lectin domain family member 3A O75596 0.03 0.04 0.01 0.02 0.01 0.07 0.06 0.12
Decorin P07585 x 0.56 0.62 0.85 0.43 0.35 0.38 0.56 0.38 0.81
Dermatopontin Q07507 x 0.49 0.58 0.51 0.03 0.01 0.00 0.03 0.03 0.06
EGF-like repeat and discoidin I-like domain-containing p.3 O43854 0.28 0.30 0.47 0.38 0.38 0.40
Extracellular superoxide dismutase[Cu-Zn] P08294 0.51 0.63 0.91 0.29 0.13 0.10 0.09 0.10 0.17
Fibroblast growth factor-binding protein 2 Q9BYJ0 0.00 0.00 0.00 0.09 0.12 0.40 1.18 0.72 1.76
Fibromodulin Q06828 x 0.08 0.15 0.31 0.23 0.31 0.39 0.68 0.41 0.79
Fibronectin P02751 x 0.24 0.15 0.12 0.04 0.05 0.05 0.21 0.21 0.41
Fibulin-1 P23142 3.29 0.99 0.72
Galectin-1 P09382 0.66 0.60 0.53 0.27 0.30 0.29
Galectin-3 P17931 0.00 0.20 0.20
Hyaluronan and proteoglycan link protein 1(link protein) P10915 x 0.04 0.06 0.16 0.24 0.28 0.40 0.61 0.30 0.64 Interalpha-trypsin inhibitor heavy chain H1 P19827 4.28 2.41 1.72
Lactadherin Q08431 0.10 0.10 0.15 0.10 0.08 0.12 0.22 0.14 0.29
Leukocyte cell-derived chemotaxin-2 O14960 0.11 0.09 0.17 0.07 0.14 0.50 1.53 1.04 2.37
Lubricin(Proteoglycan 4) Q92954 x 0.60 0.26 0.17 0.04 0.02 0.03 0.03 0.02 0.06
Lumican P51884 x 0.54 0.74 1.00 0.49 0.30 0.19 0.22 0.12 0.25
Lysozyme C P61626 0.06 0.03 0.04 0.07 0.10 0.29 1.38 1.43 3.56
Matrilin-1 P21941 0.07 0.07 0.08 0.01 0.02 0.02 0.02 0.02 0.05
Matrilin-3 O15232 x 0.12 0.01 0.05 0.07 0.24 0.44 0.60 0.21 0.32
Matrix Gla protein P08493 x 0.00 0.10 0.05 0.49 1.02 1.86
Metalloproteinase inhibitor 3 P35625 0.02 0.12 0.13 0.00 0.11 0.18 1.00 0.58 1.48
Mimecan P20774 x 0.75 1.03 1.52 0.85 0.58 0.36 0.19 0.07 0.13
Osteoadherin(Osteomodulin) Q99983 x 0.03 0.12 0.19
Osteonectin(SPARC) P09486 x 0.07 0.22 0.19 0.28 0.31 1.75
Osteopontin P10451 x 0.29 13.72 21.10
Perlecan P98160 x 0.82 0.54 0.37 0.07 0.01 0.07 0.00 0.06 0.13
Phospholipase A2,membrane associated P14555 0.11 0.11 0.15 0.44 1.24 6.33 6.33 8.46 21.1
Pleckstrin homology domain-containing family A6 Q9Y2H5 6.59 6.52 15.24
Procollagen C-endopeptidase enhancer 1 Q15113 2.70 2.01 4.67 1.46 1.45 1.14
Procollagen C-endopeptidase enhancer 2 Q9UKZ9 0.22 0.25 0.33 0.24 0.28 0.36 0.55 0.32 0.72
PRELP P51888 x 0.26 0.35 0.54 0.41 0.38 0.41 0.54 0.31 0.61
Protein S100-A9 P06702 0.31 0.22 0.36 0.19 0.33 1.26
Retinoic acid receptor responder protein 2 Q99969 0.01 0.43 0.57 0.56 1.05 1.68 3.34 2.51 6.34
Secreted frizzled-related protein 3 Q92765 0.23 0.25 0.42 0.22 0.25 0.24 0.61 0.33 0.81
Serine protease HTRA1 Q92743 x 0.81 0.47 0.38 0.14 0.11 0.19 0.50 0.34 0.69
SPARC-related modular calcium-binding protein 2 Q9H3U7 0.00 0.09 0.18 0.17 0.11 0.26 0.54 0.38 0.95
Stromelysin-1 P08254 8.01 7.21 11.28 3.89 1.30 0.67 0.41 0.10 0.38
Sushi repeat-containing protein SRPX2 O60687 0.27 0.44 0.43 0.16 0.15 0.12 0.25 0.16 0.30
Target of Nesh-SH3 Q7Z7G0 0.37 0.41 0.44 0.11 0.05 0.03 0.03 0.01 0.03
Tenascin-C P24821 x 3.23 2.42 1.49 0.25 0.05 0.02
Tenascin-X P22105 0.83 0.70 0.59 0.12 0.07 0.15 0.21 0.00 0.06
Tetranectin P05452 1.08 1.16 1.64 0.68 0.51 0.13 0.09 0.01 0.08
Thrombospondin-1 P07996 x 0.14 0.21 0.44 0.48 0.44 0.38 0.30 0.14 0.26
Thrombospondin-3 P49476 0.25 0.25 0.29
Thrombospondin-4 P35443 x 0.26 0.25 0.29 0.00 0.00 0.00 0.18 0.02 0.22
TGF-beta-induced protein ig-h3 Q15582 1.27 0.70 0.66 0.17 0.05 0.05 0.00 0.01 0.15
2.3.5. Outlining cartilage tissue boundaries in the samples
In an attempt to set the identified protein distribution patterns in the LTP and MTP samples into perspective, we analyzed the distribution pattern of the superficial zone protein lubricin (Schumacher et al., 1994), the bone protein osteopontin (Franzen and Heinegård, 1985; Sodek et al., 2000) and several serum proteins (Fig. 6). In the LTP52 sample, lubricin was found to be confined to the most superficial layer (Fig. 6a). Lubricin was also found in the superficial part of the MTP samples (Fig. 6b). However, it is interesting to note that the lubricin content showed a less pronounced decrease toward the deeper layers in MTP43 and MTP65. Osteopontin was most prominently detected in the deepest layers of the LTP52 sample (Fig. 6c) and the MTP samples (Fig. 6d). However, considering the absolute peak area instead of the normalized values, only very low levels of the protein could be detected in the MTP43 sample (Fig. 6e), indicating that we did not reach the calcified/mineralized zone for this sample. Similar patterns were observed for osteonectin (SPARC; Supplementary Table S4a-e). Serum proteins showed different penetrations into the tissue depending on the molecular size (Fig. 6f). The smaller ones, alpha-1-acid glycoprotein 1 and serum albumin, were found to be accumulated in a depth of 500μm of the LTP52 sample but were less present in the deeper regions. The larger proteins,fibronectin and alpha-2-macroglobulin, were found at high concentrations in the uppermost layers and in the deepest layers. A bias in the analysis of protein distribution patterns is introduced if proteins are present in the serum infiltrating the cartilage as well as produced by chondrocytes, as in the case offibronectin. Interestingly, thefibronectin distribution patterns differ between the different MTP samples (Fig. 6g).
3. Discussion
Using quantitative mass spectrometry, we established the distribu-tion patterns of a broad range of ECM proteins in articular cartilage (Supplementary Fig. S1a). This resulted in the identification of groups of proteins being enriched in the superficial region in the uppermost 20% of total tissue depth, of proteins enriched in the intermediate region between 20% and 35 % of total tissue depth and proteins enriched between 60% and 100% of total tissue depth (Supplementary Fig. S1b).
Thesefindings are in accordance with the long-established notion of articular cartilage being a composite of different zones with distinct molecular composition and functional roles. These roles include the maintenance of a tear-resistant and lubricating joint surface, a shock-absorbing and elastic matrix and a connection to the subchondral bone. We do not yet fully understand the complex networks of proteins required to achieve these tasks. A detailed mapping of molecular com-position will form the basis for further studies on molecular interactions and functional properties of the different zones. In this study, we used the term region (superficial, intermediate and deep, respectively), to refer to proteins showing predominance in certain parts of the samples. Future studies correlating ourfindings with morphological criteria defining the established term cartilage zones will further increase the understanding of articular cartilage biology.
Our study of four human MTP samples revealed a subset of proteins with predominance in the superficial parts of the samples. Proteins such as asporin and tenascin-C showed strict confinement to the uppermost 20% of the samples (Fig. 4a;Table 2), while others such as perlecan and collagen type VI were also present in deeper zones albeit to a lesser
degree (Fig. 4a; Supplementary Tables S4a-e and S5). The presence of lubricin in the superficial zone has been established by several studies; it is known to be produced by superficial chondrocytes to lubricate the joint surface (Schumacher et al., 1994). The highest abundance of lubricin in the superficial part of the samples confirmed that the analyzed cartilage plugs had an intact joint surface and were sampled in a correct way. However, it is interesting to note that the lubricin abundance peaked in a region just below the most superficial layers in MTP 36, 43 and 46. It should be mentioned that the veryfirst fraction of MTP36, 43 and 46 and thefirst two fractions of MTP65 contained protein extracts of slightly incomplete tissue sections due to technical difficulties in aligning the sample joint surface with the microtome knife (Fig. 2). The actual protein content may thus be slightly under-represented in these fractions. However, this does not explain why several superficial proteins showed peaks in protein abundance just underneath the most superficial layers since the lower levels of superfi -cial region proteins were seen also in subsequent, complete sections. An interesting exception is the MTP65 sample, where these proteins were found to be highest in the most superficial layers, as was the case in the LTP52 sample. MTP65 was derived from the oldest donor, suggest-ing that the superficial zone could be abraded in the older samples. Differences in the protein distribution patterns could also indicate variation between the individual samples. One might also take these reflections into consideration for the proteins where no consistent distribution pattern could be established since the variation between the samples was too large (Supplementary Table S4a-e). However, the distribution patterns of asporin, tenascin-C and thrombospondin-4 are remarkably similar, which suggests a structural-functional relation of these proteins in the superficial region. In the future, these established techniques will be used to study age-related differences to elucidate possible changes in protein distribution during aging.
The other distinct subset identified in our study consists of proteins that are steadily increasing in abundance towards the deep part of the tissue, e.g. aggrecan, link protein, chondroadherin and osteoadherin (Fig. 4b; Supplementary Table S4a-e). Variations in proteoglycan and glycosaminoglycan distribution in articular cartilage are well established (Stockwell and Scott, 1967; Poole et al., 1982; Bayliss et al., 1983). Our data of increasing aggrecan with tissue depth, shown for all three domains G1, G2 and G3 in both the LTP and the MTP samples,fits well with these studies. Another important observation is that all the predominantly deep proteins showed an ultimate decrease towards the deepest layers in the MTP43 sample, in contrast to the other samples. However, it is interesting to note that the distribution patterns of MTP43 are in good agreement with the other samples down to 2200μm.
To delineate the sample boundaries, we analyzed the distribution pattern of the bone protein osteopontin (Fig. 6c,d). Osteopontin is detected in high abundance only in the deepest part of most samples (except for MTP43). This confirms that the deepest layers were reached in these samples, i.e. the calcified zone and possibly upper parts of the subchondral bone. Consequently, this means that no deep tissue areas are missing in MTP36, 46 and 65. However, for unknown reasons, we could only detect very low absolute levels of osteopontin in the much thicker cartilage sample MTP43 (Fig. 6e). We conclude from this that the deepest fractions contain proteins just from the beginning of the calcified zone or the bone tissue and therefore that the analyzed sample contains mainly cartilage tissue.
Table 1(continued)
Protein name Accession (a) Pool 1 Pool 2 Pool 3 Pool 4 Pool 5 Pool 6 Pool 7 Pool 8 Pool 9
TNF receptor superfamily member 11B O00300 0.04 0.02 0.06 0.08 0.03 0.12 0.11 0.04 0.10
Versican P13611 x 0.18 0.09 0.08 0.04 0.05 0.06 0.11 0.07 0.12
Vitronectin P04004 10.75 7.67 7.61 1.45 0.22 0.09
72 kDa type IV collagenase P08253 2.23 2.30 3.55
Thickness variation in the tibia cartilage has been reported, as well as correlation to the body weight and height of the donor (Ateshian et al., 1991; Shepherd and Seedhom, 1999; Li et al., 2005). Ateshian et al. investigated 12 human MTPs identifying a mean thickness of
2.42 ± 0.61 mm (Ateshian et al., 1991). Our own experience (unpub-lished data) is that the thickness at any specified site does vary between individuals of similar age, although thinning with age is the general pattern.
It is interesting to note that asporin and chondroadherin showed reversed distribution patterns throughout the tissue. The same contrary pattern was observed when comparing different cartilage tissues with each other (Önnerfjord et al., 2012). Asporin was found to be high in thefibrocartilage of the meniscus in comparison to articular cartilage, while chondroadherin was found to be low in the meniscus but highly abundant in various articular cartilages. The functional aspects of this observation are still unknown.
Some proteins, such as PRELP and decorin, were fairly evenly distrib-uted (Fig. 5b). However, they seem to be absent from the most super-ficial layers, as observed for several proteins with predominance in the uppermost 20% of the tissue. This might indicate a thus far unknown complexity in a zone just underneath the most superficial layers, which may be related to recent observations of distinct biophysical properties in this region (Buckley et al., 2010). Interestingly, only mimecan and thrombospondin-1 showed predominance in the middle part of the MTP samples (Fig. 5a;Table 2). A hypothesis for explaining the scarcity of proteins with predominance in the intermediate zone
2012). On the other hand, both the CILP 2 variants show more enrich-ment in the intermediate zone.
Most previous studies on protein distribution patterns were based on antibody-based technologies. Even though such studies can give a
detailed picture of protein localisation, they are often difficult to perform and interpret since they require specific antibodies and the accessibility of certain epitopes. The problem with epitope availability re-presents a common challenge when establishing immunohistochemistry Table 2
Regions of maximum protein abundance for superficial, intermediate and deep proteins. Depicted is the depth, in percentage of total tissue depth (from 0% = most superficial data point to 100% = deepest data point), at which a protein was found at maximum abundance (*). Proteins with predominance in the superficial part showed maximum abundance in the uppermost 20% of the MTP samples, proteins with predominance in the intermediate part at 20%–35% of the tissue depth. Proteins with predominance in the deep part showed in general highest abundance in the lower 40% of the samples.
Superficiala)
Intermediateb)
Deepc)
Protein Sample * (%) Protein Sample * (%) Protein Sample * (%)
Asporin MTP36 18 Mimecan MTP36 27 Aggrecan G1 MTP36 100
MTP43 7 MTP43 30 MTP43 63
MTP46 18 MTP46 35 MTP46 100
MTP65 2 MTP65 20 MTP65 (38)
Tenascin-C MTP36 18 Thrombospondin-1 MTP36 27 Chondroadherin MTP36 92
MTP43 7 MTP43 30 MTP43 80
MTP46 18 MTP46 (18) MTP46 100
MTP65 7 MTP65 20 MTP65 100
Thrombospondin-4 MTP36 18 Link protein MTP36 (51)
MTP43 7 MTP43 63
MTP46 10 MTP46 100
MTP65 2 MTP65 100
Perlecan MTP36 18 Osteoadherin MTP36 92
MTP43 7 MTP43 63
MTP46 18 MTP46 100
MTP65 11 MTP65 100
a) max. abundance within uppermost 20% of tissue depth. b) max. abundance between 20% and 35% of tissue depth. c) max. abundance within 60%–100% of tissue depth.
Parentheses indicate samples where the region of maximum protein abundance differs from the other samples.
or immunofluorescence assays. Especially in cartilage, where there is a complex ECM with highly cross-linked macromolecules containing a multitude of different polysaccharide side chains, it is difficult to ensure efficient antibody penetration and epitope availability. This usually requires extensive antigen retrieval methods, e.g. incubation with proteolytic enzymes such as proteinase K or pepsin, incubation with enzymes to remove proteoglycan side chains such as chondroitinase ABC or heat-induced antigen retrieval using low or high pH buffer. There is a risk that these methods in themselves might alter the
and sophisticated methods for quantification have been established. Depending on the length of the proteins, several peptides identifying a certain protein are usually detected, thereby strengthening the identification.
It needs to be stressed, however, that protein analysis using mass spectrometry can only be performed on solubilized proteins. Covalently cross-linked proteins, like thefibrillar collagens except collagen type VI, are therefore not efficiently extracted. In a previous study, we investi-gated the extractability of selected ECM proteins (Önnerfjord et al., 2012). Aggrecan, asporin, chondroadherin and decorin showed an extractability of≥90% from tibial knee cartilage, COMP of ca. 65% and lubricin of ca. 80%. An extraction efficiency of 100% cannot be reached due to the high degree of cross-linking of cartilage ECM molecules and thereby trapping of molecules in the matrix. Nevertheless, we think that conclusions about the relative distribution of proteins, comparing different zones with each other, can be made. Even though we detected chains offibrillar collagens, e.g. collagen I alpha 1 and alpha 2 chains and collagen II alpha 1 chain (Supplementary Table S1) we chose not to draw anyfirm conclusions from these data since the extraction efficiency of, e.g. collagen II has been shown to be≤10%. It is also unknown what this extractable pool represents, e.g. it could be newly synthesized collagen not incorporated into the matrix.
The MRM technology allows targeted quantitative proteomics with high sensitivity and accuracy (Gillette and Carr, 2013). Mass spectrometry and antibody-based methods might target different parts of a protein. Methodological differences might explain discrep-ancies between our study and previous reports. For example, we found collagen type VI at high levels in the superficial layers, while it has been reported from immunofluorescence studies to be located throughout the articular cartilage, possibly to a lesser extent in the superficial zone (Söder et al., 2002; Hansen et al., 2012; Wilusz et al., 2013). This discrepancy may be explained by the epitope not being exposed in the superficial zone, e.g. by interacting proteins masking the binding site. Although our results may reflect more effi -cient extraction from the superficial layers, most proteins discussed in this study (including collagen type VI) were found to be extract-able in a previous study on full thickness knee cartilage (Önnerfjord et al., 2012). The observed distribution patterns of tenascin-C enriched in the superficial zone match previous immuno-histochemical investigations (Veje et al., 2003). The identified pat-terns of distribution of several proteins match well with the gene expression investigated in the different zones of a human lateral femoral condyle in a study byFukui et al. (2008). In this study, the genes of chondroadherin, CILP, link protein and aggrecan showed the highest expression in the deep cartilage region.
Articular cartilage is known to show inter- and intra-joint vari-ability due to differences in mechanical load and architecture of the joints (Buckwalter and Mankin, 1998). Furthermore, even though ar-ticular cartilage zones are distinguished morphologically, the bound-aries cannot be sharply defined. Therefore, it is difficult to compare structural studies with each other. In a quantitative study of the structural organization of human, medial femoral cartilage by Hunzikeret al., the superficial zone was defined as the upper 10%, the transitional zone as the next 10% and the middle zone as the re-maining 80% until the tidemark (Hunziker et al., 2002). When apply-ing our approach as presented here to other areas in the knee as well as other joints, it will be possible to map structural differences and to define the different zones of articular cartilage in a more precise way. In the past, several studies focused on femoral condyle cartilage. We chose to analyze protein distribution patterns in tibial plateau carti-lage since this area has the least curvature to its shape and therefore could be sectioned parallel to the joint surface in a reproducible manner. In future studies, it would be interesting to compare tibial and femoral cartilage of the opposing weight-bearing surfaces to each other. Furthermore, future studies will focus on understanding the functional importance of a distinct ECM composition in different
compartments, for example, by relating the molecular composition to biomechanical properties and cell distribution and metabolism.
This study provides a thus far unique overview of the ECM protein distribution in articular cartilage. This will have implications in basic research identifying structural-functional relations in cartilage ECM, as well as clinical approaches in tissue repair and design. In addition, comparing the protein distribution between healthy and pathological articular cartilage will give new insights into disease development and progression.
4. Experimental procedures
4.1. Materials
Filter tubes (molecular weight cut-off, 30 kDa) were purchased from PALL Life Sciences (Nanosep MI, USA). Reversed phase C18 (SUM-SS18V) spin columns were purchased from the Nest Group (MA, USA). Crude synthetic peptides were purchased from JPT (SpikeTides, JPT Peptide Technologies GmbH, Germany) and Thermo (Thermo-Fisher Scientific, Germany). A peptide mixture was made from the synthetic peptides (JPT) for checking system performance and retention times were adjusted using a peptide mixture (iRT Kit from Biognosys AG, Switzerland). Further reagents were described before (Önnerfjord et al., 2012).
4.2. Sample preparation
4.2.1. Dissection, cryosectioning and extraction
Full-thickness macroscopically normal human articular cartilage from LTP and MTP were used in this study. The LTP sample was used to get an overview of the extractable proteins. The iTRAQ approach was used here to identify protein patterns and based on that, MRM assays for proteins of interest were established. Extracts from the same sample were then used to confirm the identification of similar protein patterns using the targeted and more sensitive MRM technolo-gy. The scarce availability of healthy human cartilage samples is a constant challenge in thefield of cartilage research. For this reason, we chose to perform the initial feasibility test, method optimization and comparison between the two quantitative mass spectrometry approaches on the single LTP sample we obtained. MTP samples, more commonly associated with knee osteoarthritis (Felson et al., 2002), were then used to perform MRM analysis on four samples from the same joint region but from different individuals, thereby allowing identification of inter-individual variation.
of residual Tissue Tek components. These problems were avoided by removing Tissue Tek embedding from the protocol in later experiments. It should be stressed that the focus of the study was to analyze protein distribution patterns within a certain specimen and then to compare these patterns in the different samples. This required constant section areas from top to bottom throughout a given sample, but made the different areas of the different samples irrelevant.
LTP52 sections were collected in the inner lid of an upside down-placedfilter tube (0.45μmfilter; Pall). Extraction was done for 24 h under gentle shaking at 4 °C in the lid of thefilter tubes with 150μl of chaotropic extraction buffer (4 M guanidine hydrochloride, 50 mM sodium acetate, 100 mM 6-aminocaproic acid, 5 mM benzamidine, 5 mMN-ethylmaleimide; pH 5.8). The extract was obtained by centrifu-gation through thefilter at 14000 ×gfor 3 min. Sections from the MTP samples were collected directly into centrifuge tubes and extracted as described above. Extracts were separated from extraction residues by centrifugation.
4.2.2. Preparation for non-targeted quantitative mass spectrometry In a discovery approach, the LTP52 sample was analyzed using the iTRAQ mass spectrometry approach (Ross et al., 2004). Reduction, alkylation and ethanol precipitation were performed as described before (Önnerfjord et al., 2012). Samples were suspended in 100μl 0.1 mM triethylammonium bicarbonate buffer, pH 8.5, before trypsination with 1μg of trypsin at +37 °C on a shaker for about 16 h. The 24 depth fractions were collected into nine pools (Fig. 2). For this, equal sample amounts from the individual trypsin digests (one fraction representing the extract of 10 tissue sections representing a total depth of 100μm) were mixed to achieve a volume of 20μl, thereby representing each sample fraction equally. To achieve a better re-solution in the uppermost and lowest layers, the extracts of fraction 1, 2, 23 and 24 were not pooled with others. Three pools formed a sample set: set 1 (pools 1, 2 and3), set 2 (pools 4, 5 and6) and set 3 (pools 7, 8 and 9). With the iTRAQ technology, samples are labeled at the N-terminus with isobaric labels (label 114, 115 and 116), thereby giving the same mass adduct to all peptides, regardless of their origin. Labeled samples are mixed with a reference sample (label 117) as used in the study byÖnnerfjord et al. (2012).
4.2.3. Preparation for targeted mass spectrometry
Samples were digested with trypsin as described above, and aliquots of 10μl of the trypsin digest (from selected 100μm pools) were diluted to 200μl with 0.5 M ammonium bicarbonate andfiltered through a 30 kDafilter. The high salt content was employed to minimize ionic interactions between positively charged tryptic peptides from ECM proteins and negatively charged glycosaminoglycans present in the sample. In brief, diluted digests were centrifuged at 2060 ×gfor 8 min through thefilter followed by an additional wash with 100μl 0.5 mM ammonium bicarbonate. Before injection into the mass spectrometer, salts were removed from thefiltrates using reversed-phase C18 spin columns according to the manufacturer's instructions.
4.3. MRM assay generation
To generate protein-specific MRM assays,in silicotrypsin digestion of proteins of interest was performed on 29 cartilage ECM proteins to identify proteotypic peptides for each protein (Fusaro et al., 2009). The following parameters were considered for peptide selection (i) unique peptides, (ii) peptides shorter than 20 amino acids, (iii) no missed cleavages, (iv) favoured y-ions over b-ions, (v) favoured Q3NQ1 and (vi) Q1/Q3 ratio between 400 and 1500m/z(Q1: peptide precursor ion mass, Q3: its specific fragment ion mass). We additionally used representative cartilage samples to select thefinal peptide list. Instrument parameters were then optimized for the highest sensitivity for all peptides and their transitions by using purchased crude synthetic peptides (JPT and Thermo). The measured peptide transitions are listed
in Supplementary Table S3. Three to six transitions for each peptide were measured in a scheduled MRM method.
4.4. LC-MS setup and analysis
For the iTRAQ approach, the procedure was as previously described (Önnerfjord et al., 2012).
For the MRM samples, aliquots were injected and quantified using a TSQ Vantage triple quadrupole mass spectrometer (Thermo Scientific, Waltham MA) equipped with an Easy nano-LC system (Thermo Scien-tific, Waltham MA). The mass spectrometer was operated in MRM mode, with both Q1 and Q3 settings at 0.7 Da resolution. A spray voltage of + 1700 V was used with a heated ion transfer setting of 270 °C for desolvation. Data were acquired using the Xcalibur software (version 2.1). Mobile phases used were A (0.1% formic acid in water) and B (0.1% formic acid in 100% acetonitrile). Separation was performed on 10μm tip; 75μm × 15 cm capillary columns (PicoTip™emitter; New Objective, Woburn, MA) packed with Reprosil-Pur C18-AQ resin (3μm, Dr. Maich GmbH). Samples were injected (2–4μl) in duplicates, except for MTP46 due to technical reasons. The on-line reversed-phase separation was performed using aflow rate of 300 nl/min and a linear binary gradient from 3% B for 5 min to 15% B in 3 min, then to 35% B in 32 min andfinally to 90% B in 3 min followed by a wash for 3 min with 90% B, and reconditioning to initial conditions in 10 min. A standard mixture of tryptic peptides was run to check the system performance of the LC-MS setup (Teleman et al., 2012).
4.5. Data analysis
For the iTRAQ discovery approach, data analysis was done as previously described (Önnerfjord et al., 2012).
The targeted MRM data was analyzed using the Skyline 1.4 software (MacCoss Lab Software, University of Washington;MacLean et al., 2010). The relative signal from the individual transitions in combination with the expected retention time of the peak ensured the identity of the peak as measured by synthetic peptides during optimization. For simplicity reasons, the summed area of the individual transitions are presented in the selectedfigures throughout this paper.
We have used relative quantification in both approaches and not absolute values, i.e. the protein distribution patterns can be compared, but not the levels of different proteins. For clarity, values are presented normalized to 1 (maximum relative abundance) in the graphs.
The aggrecan core protein was analyzed individually for its three globular domains (G1, G2 and G3) to investigate differences in domain distribution with cartilage depth. Similarly, the cartilage intermediate layer proteins CILP 1 and CILP 2 were divided into their polypeptides CILP 1-1, 1-2, 2-1 and 2-2 for separate analysis (Lorenzo et al., 1998a; Lorenzo et al., 1998b; Johnson et al., 2003; Bernardo et al., 2011).
Author contributions
CM, AK, AA, DH and PÖ were involved in the conception and design of the study as well as the interpretation of the data. CM and AK conducted the experimental work. CM and AK madefigures and tables and CM wrote the manuscript. CM, AK and PÖ conducted the mass spectrometry experiments and the data analysis. FR and JD provided fo-rensic material and patient material, respectively. All authors critically revised the article, PÖ (corresponding author, E-mail: patrik. [email protected]) gavefinal approval of the article.
Supplementary data to this article can be found online athttp://dx. doi.org/10.1016/j.matbio.2014.08.013.
Acknowledgements
Magnus Bergvall's foundations. The authors acknowledge thefinancial support by the European Union FP7-NMP-2008-LARGE, under contract no. 228929. We thank The Crafoord Foundation and the Inga-Britt & Arne Lundberg Foundation for funding the mass spectrometers used in this study. Catharina Müller was the recipient of a PhD stipend from the Faculty of Science, University of Copenhagen. We thank the National Institute of Health Research UK, for funding the procurement of tibial plateau cartilage sample used in this study (II-FS-0909-13007 to JD).
References
Ateshian, G.A., Soslowsky, L.J., Mow, V.C., 1991.Quantitation of articular surface topogra-phy and cartilage thickness in knee joints using stereophotogrammetry. J. Biomech. 24, 761–776.
Bayliss, M.T., Venn, M., Maroudas, A., Ali, S.Y., 1983. Structure of proteoglycans fromdifferent layers of human articular cartilage. Biochem. J. 209, 387–400. Bernardo, B.C., Belluoccio, D., Rowley, L., Little, C.B., Hansen, U., Bateman, J.F., 2011.
Cartilage intermediate layer protein 2 (CILP-2) is expressed in articular and meniscal cartilage and down-regulated in experimental osteoarthritis. J. Biol. Chem. 286, 37758–37767.
Bhosale, A.M., Richardson, J.B., 2008.Articular cartilage: structure, injuries and review of management. Br. Med. Bull. 87, 77–95.
Buckley, M.R., Bergou, A.J., Fouchard, J., Bonassar, L.J., Cohen, I., 2010.High-resolution spatial mapping of shear properties in cartilage. J. Biomech. 43, 796–800. Buckwalter, J.A., Mankin, H.J., 1998.Articular cartilage: tissue design and
chondrocyte-matrix interactions. Instr. Course Lect. 47, 477–486.
Cillero-Pastor, B., Eijkel, G.B., Kiss, A., Blanco, F.J., Heeren, R.M.A., 2013.Matrix-assisted laser desorption ionizationimaging mass spectrometry: a new methodology to study human osteoarthritic cartilage. Arthritis Rheum 65, 710–720.
DiCesare, P.E., Mörgelin, M., Carlson, C.S., Pasumarti, S., Paulsson, M., 1995.Cartilage oligomeric matrix protein: isolation and characterization from human articular cartilage. J. Orthop. Res. 13, 422–428.
Felson, D.T., Nevitt, M.C., Zhang, Y., Aliabadi, P., Baumer, B., Gale, D., Li, W., Yu, W., Xu, L., 2002.High prevalence of lateral knee osteoarthritis in Beijing Chinese compared with Framingham Caucasian subjects. Arthritis Rheum 46, 1217–1222.
Franzen, A., Heinegård, D., 1985.Isolation and characterization of two sialoproteins present only in bone calcified matrix. Biochem. J. 232, 715–724.
Fukui, N., Miyamoto, Y., Nakajima, M., Ikeda, Y., Hikita, A., Furukawa, H., Mitomi, H., Tanaka, N., Katsuragawa, Y., Yamamoto, S., Sawabe, M., Juji, T., Mori, T., Suzuki, R., Ikegawa, S., 2008.Zonal gene expression of chondrocytes in osteoarthritic cartilage. Arthritis Rheum. 58, 3843–3853.
Fusaro, V.A., Mani, D.R., Mesirov, J.P., Carr, S.A., 2009.Prediction of high-responding peptides for targeted protein assays by mass spectrometry. Nat. Biotechnol. 27, 190–198.
Gillette, M.A., Carr, S.A., 2013.Quantitative analysis of peptides and proteins in biomedicine by targeted mass spectrometry. Nat. Methods 10, 28–34.
Grogan, S.P., Duffy, S.F., Pauli, C., Koziol, J.A., Su, A.I., D'Lima, D.D., Lotz, M.K., 2013. Zone-specific gene expression patterns in articular cartilage. Arthritis Rheum. 65, 418–428. Guilak, F., Alexopoulos, L.G., Upton, M.L., Youn, I., Choi, J.B., Cao, L., Setton, L.A., Haider, M.A., 2006.The pericellular matrix as a transducer of biomechanical and biochemical signals in articular cartilage. Ann. N. Y. Acad. Sci. 1068, 498–512.
Hansen, U., Allen, J.M., White, R., Moscibrocki, C., Bruckner, P., Bateman, J.F., Fitzgerald, J., 2012.WARP interacts with collagen VI-containing microfibrils in the pericellular matrix of human chondrocytes. PLoS One 7, e52793.
Heinegård, D., 2009.Proteoglycans and more—from molecules to biology. Int. J. Exp. Pathol. 90, 575–586.
Hoemann, C.D., Lafantaisie-Favreau, C.H., Lascau-Coman, V., Chen, G., Guzman-Morales, J., 2012.The cartilage–bone interface. J. Knee Surg. 25, 85–97.
Hunziker, E.B., 2002.Articular cartilage repair: basic science and clinical progress. A review of the current status and prospects. Osteoarthr. Cartil. 10, 432–463. Hunziker, E.B., Quinn, T.M., Hauselmann, H.J., 2002.Quantitative structural organization of
normal adult human articular cartilage. Osteoarthr. Cartil. 10, 564–572.
Johnson, K., Farley, D., Hu, S.I., Terkeltaub, R., 2003.One of two chondrocyte-expressed isoforms of cartilage intermediate-layer protein functions as an insulin-like growth factor 1 antagonist. Arthritis Rheum. 48, 1302–1314.
Kato, Y., Iwamoto, M., Koike, T., Suzuki, F., Takano, Y., 1988.Terminal differentiation and calcification in rabbit chondrocyte cultures grown in centrifuge tubes: regulation by transforming growth factor beta and serum factors. Proc. Natl. Acad. Sci. U. S. A. 85, 9552–9556.
Li, G., Park, S.E., DeFrate, L.E., Schutzer, M.E., Ji, L., Gill, T.J., Rubash, H.E., 2005.The cartilage thickness distribution in the tibiofemoral joint and its correlation with cartilage-to-cartilage contact. Clin. Biomech. (Bristol, Avon) 20, 736–744.
Lorenzo, P., Bayliss, M.T., Heinegård, D., 1998a.A novel cartilage protein (CILP) present in the mid-zone of human articular cartilage increases with age. J. Biol. Chem. 273, 23463–23468.
Lorenzo, P., Neame, P., Sommarin, Y., Heinegård, D., 1998b.Cloning and deduced amino acid sequence of a novel cartilage protein (CILP) identifies a proform including a nucleotide pyrophosphohydrolase. J. Biol. Chem. 273, 23469–23475.
MacLean, B., Tomazela, D.M., Shulman, N., Chambers, M., Finney, G.L., Frewen, B., Kern, R., Tabb, D.L., Liebler, D.C., MacCoss, M.J., 2010.Skyline: an open source document editor for creating and analyzing targeted proteomics experiments. Bioinformatics 26, 966–968.
Mittelstaedt, D., Xia, Y., Shmelyov, A., Casciani, N., Bidthanapally, A., 2011.Quantitative determination of morphological and territorial structures of articular cartilage from both perpendicular and parallel sections by polarized light microscopy. Connect. Tissue Res. 52, 512–522.
Mow, V.C., Ratcliffe, A., Poole, A.R., 1992.Cartilage and diarthrodial joints as paradigms for hierarchical materials and structures. Biomaterials 13, 67–97.
Önnerfjord, P., Khabut, A., Reinholt, F.P., Svensson, O., Heinegård, D., 2012.Quantitative proteomic analysis of eight cartilaginous tissues reveals characteristic differences as well as similarities between subgroups. J. Biol. Chem. 287, 18913–18924. Pecchini, P., Malberti, F., Mieth, M., Quinn, R., Tripepi, G., Mallamaci, F., Maas, R., Zoccali, C.,
Ravani, P., 2012.Measuring asymmetric dimethylarginine (ADMA) in CKD: a comparison between enzyme-linked immunosorbent assay and liquid chromatography-electrospray tandem mass spectrometry. J. Nephrol. 25, 1016–1022.
Pfister, B.E., Aydelotte, M.B., Burkhart, W., Kuettner, K.E., Schmid, T.M., 2001.Del1: a new protein in the superficial layer of articular cartilage. Biochem. Biophys. Res. Commun. 286, 268–273.
Poole, A.R., Pidoux, I., Reiner, A., Rosenberg, L., 1982.An immunoelectron microscope study of the organization of proteoglycan monomer, link protein, and collagen in the matrix of articular cartilage. J. Cell Biol. 93, 921–937.
Redler, I., Mow, V.C., Zimny, M.L., Mansell, J., 1975.The ultrastructure and biomechanical significance of the tidemark of articular cartilage. Clin. Orthop. Relat. Res. 357–362. Ross, P.L., Huang, Y.N., Marchese, J.N., Williamson, B., Parker, K., Hattan, S., Khainovski, N.,
Pillai, S., Dey, S., Daniels, S., Purkayastha, S., Juhasz, P., Martin, S., Bartlet-Jones, M., He, F., Jacobson, A., Pappin, D.J., 2004.Multiplexed protein quantitation inSaccharomyces cerevisiaeusing amine-reactive isobaric tagging reagents. Mol. Cell. Proteomics 3, 1154–1169.
Schaefer, L., Schaefer, R.M., 2010.Proteoglycans: from structural compounds to signaling molecules. Cell Tissue Res. 339, 237–246.
Schumacher, B.L., Block, J.A., Schmid, T.M., Aydelotte, M.B., Kuettner, K.E., 1994.A novel proteoglycan synthesized and secreted by chondrocytes of the superficial zone of articular cartilage. Arch. Biochem. Biophys. 311, 144–152.
Schumacher, B.L., Su, J.L., Lindley, K.M., Kuettner, K.E., Cole, A.A., 2002.Horizontally orient-ed clusters of multiple chondrons in the superficial zone of ankle, but not knee articular cartilage. Anat. Rec. 266, 241–248.
Shepherd, D.E., Seedhom, B.B., 1999.Thickness of human articular cartilage in joints of the lower limb. Ann. Rheum. Dis. 58, 27–34.
Sodek, J., Ganss, B., McKee, M.D., 2000.Osteopontin. Crit. Rev. Oral Biol. Med. 11, 279–303. Söder, S., Hambach, L., Lissner, R., Kirchner, T., Aigner, T., 2002.Ultrastructural localization of type VI collagen in normal adult and osteoarthritic human articular cartilage. Osteoarthr. Cartil. 10, 464–470.
Stockwell, R.A., Scott, J.E., 1967.Distribution of acid glycosaminoglycans in human articular cartilage. Nature 215, 1376–1378.
Teleman, J., Karlsson, C., Waldemarson, S., Hansson, K., James, P., Malmstrom, J., Levander, F., 2012.Automated selected reaction monitoring software for accurate label-free protein quantification. J. Proteome Res. 11, 3766–3773.
Veje, K., Hyllested-Winge, J.L., Ostergaard, K., 2003.Topographic and zonal distribution of tenascin in human articular cartilage from femoral heads: normal versus mild and severe osteoarthritis. Osteoarthr. Cartil. 11, 217–227.
Wilusz, R.E., Zauscher, S., Guilak, F., 2013.Micromechanical mapping of early osteoarthritic changes in the pericellular matrix of human articular cartilage. Osteoarthr. Cartil. 21, 1895–1903.
Youn, I., Choi, J.B., Cao, L., Setton, L.A., Guilak, F., 2006.Zonal variations in the three-dimensional morphology of the chondron measured in situ using confocal microscopy. Osteoarthr. Cartil. 14, 889–897.