R E S E A R C H A R T I C L E
The stable oxygen isotope ratio of resin extractable phosphate
derived from fresh cattle faeces
†
Steven J. Granger
1|
Yuguo Yang
2|
Verena Pfahler
1|
Chris Hodgson
1|
Andrew C. Smith
3|
Kate Le Cocq
1|
Adrian L. Collins
1|
Martin S. A. Blackwell
1|
Nicholas J. K. Howden
21
Rothamsted Research, North Wyke, Okehampton EX20 2SB, UK
2
Queen's School of Engineering, University of Bristol, Senate House, Tyndall Avenue, Bristol BS8 1TH, UK
3
NERC Isotope Geoscience Laboratory, British Geological Survey, Keyworth, Nottingham NG12 5GG, UK
Correspondence
S. J. Granger, Rothamsted Research, North Wyke, Okehampton EX20 2SB, UK. Email: [email protected]
Funding information
Biotechnology and Biological Sciences Research Council, Grant/Award Numbers: BBS/E/C/000I0330 and BB/K013327/1; 2015 Rothamsted Fellowship; Natural Environment Research Council (NERC), Grant/Award Number: IP‐1564‐1115
Rationale:
Phosphorus losses from agriculture pose an environmental threat to watercourses. A new approach using the stable oxygen isotope ratio of oxygen in phosphate (δ18OPO4value) may help elucidate some phosphorus sources and cycling. Accurately determined and isotopicallydistinct source values are essential for this process. Theδ18OPO4values of animal wastes have, up to now, received little attention.
Methods:
Phosphate (PO4) was extracted from cattle faeces using anion resins and the contribution of microbial PO4was assessed. Theδ18OPO4value of the extracted PO4was measured by precipitating silver phosphate and subsequent analysis on a thermal conversion elementalanalyser at 1400°C, with the resultant carbon monoxide being mixed with a helium carrier gas
passed through a gas chromatography (GC) column into a mass spectrometer. Faecal water
oxygen isotope ratios (δ18OH2O values) were determined on a dual‐inlet mass spectrometer through a process of headspace carbon dioxide equilibration with water samples.
Results:
Microbiological results indicated that much of the extracted PO4was not derived directly from the gut fauna lysed during the extraction of PO4from the faeces. Assuming thatthe faecal δ18OH2O values represented cattle body water, the predicted pyrophosphatase equilibrium δ18OPO4 (Eδ18OPO4) values ranged between +17.9 and +19.9‰, while using groundwaterδ18OH2Ovalues gave a range of +13.1 to +14.0‰. The faecal δ18OPO4values ranged between +13.2 and +15.3‰.
Conclusions:
The fresh faecalδ18OPO4values were equivalent to those reported elsewhere for agricultural animal slurry. However, they were different from the Eδ18OPO4value calculated from the faecalδ18OH2Ovalue. Our results indicate that slurry PO4is, in the main, derived from animal faeces although an explanation for the observed value range could not be determined.1
|I N T R O D U C T I O N
Phosphorus (P) is an essential macro‐nutrient for plants and animals. It is
fundamental to many biological processes because it is involved in
energy transfer and is the constituent of several organic molecules.1
As such, it is essential to modern agricultural systems where it is applied
both in the form of animal and plant wastes and as inorganic mineral
fertilizers. However, in many parts of the world, a P surplus now exists
such that more P is contained within the soil than is required by
plants,2,3 leading to increased P in soil water,4 and ultimately a
proportion of this is lost to watercourses alongside any incidental losses
that may occur from directly applied amendments.5Even small increases
of P in watercourses can have serious detrimental effects,6 causing
eutrophication and eventually important shifts in ecosystems7,8and, for
-This is an open access article under the terms of the Creative Commons Attribution License, which permits use, distribution and reproduction in any medium, provided the original work is properly cited.
© 2018 The Authors.Rapid Communications in Mass SpectrometryPublished by John Wiley & Sons Ltd. †This manuscript is dedicated to the memory of Robert Orr whose career in
grazing livestock systems spanned more than 40 years. Sadly, Robert, who was due to be involved with this research, passed away shortly before it was undertaken. He will be missed both professionally and personally.
DOI: 10.1002/rcm.8092
this reason, it is essential we understand better P chemistry, biochemistry
and emissions from key sources in the landscape.
Stable isotope ratios have been used to track elements during
transfers between different pools and to understand the respective
roles of abiotic and biotic processes during these transfers.9-11
However, P has only one stable isotope and therefore the stable
isotope ratio approach is not directly applicable. Despite this, a stable
isotope approach has been developed which may shed more light on
P cycling. This is because in the environment most P is bound to
oxygen (O), forming anions such as orthophosphate (PO43−), hydrogen
phosphate (HPO42−) and dihydrogen phosphate (H2PO4−) which can
collectively be termed 'phosphate' (subsequently referred to as PO4
in the manuscript). This new approach uses the ratio between the 18O and16O in PO4(
δ18OPO4value) to understand better P sources and transformations. Comprehensive reviews have been written by
Davis et al12and Tamburini et al13but, in short, at typical terrestrial
temperatures and pH, and in the absence of biological activity, the
P–O bonds in PO4 are stable. Therefore, bonds are only broken
through biological mediation, and in these cases PO4 exchanges O
with the ambient water within which it is in solution.14-16The most
important of these biological processes is generally considered to
be that performed by pyrophosphatase, a ubiquitous intracellular
enzyme that facilitates the hydrolysis of pyrophosphate. The
hydrolysis of pyrophosphate leads to the formation of two PO4ions
incorporating one O atom from the ambient H2O. This process is
extremely fast and leads to a complete O exchange between H2O
and PO4over time because PO4as well as pyrophosphate can bind
at the active site of pyrophosphatase.13 This enzyme
‐catalyzed O exchange is subject to a thermodynamic isotopic fractionation, leading
to a temperature‐dependent equilibrium value (Eδ18OPO4) which is predictable and initially described by Longinelli and Nuti15but since
refined by Chang and Blake17and modified by Pistocchi et al:18
Eδ18OPO4¼−0:18Tþ26:3þδ18OH2O
where Eδ18OPO4is the stable O isotope ratio of PO4at equilibrium in ‰, T is the temperature in degrees Celsius andδ18OH2Ois the stable oxygen isotope ratio of water in‰.
For effective use of this approach for tracing the sources of PO4,
the following criteria should be met:12
• The δ18OPO4 values for significant PO4 sources are well characterised (spatially and temporally)
• The individual sources of PO4possess distinctδ18OPO4signatures • Theδ18OPO4values for PO4sources are not equal to the Eδ18OPO4
values
• Theδ18OPO4signatures for PO4sources are maintained and not rapidly transformed or modified by fractionation caused by
metabolic processes.
One of the confounding issues surrounding this area of research is
the narrow range ofδ18OPO4values that most PO4sources have and that they often overlap or they are similar to the Eδ18OPO4value.13,19,20 A recent study by Granger et al,19which characterised different sources
within a river catchment found that farm slurry, a mix of fresh and aged
animal urine, faeces, bedding materials and other farm washings,21had a
relatively consistentδ18OPO4value for water‐extractable PO4despite its heterogenous composition. Furthermore, this study reported that
its value was noticeably lower than the Eδ18OPO4value in the rivers. Granger et al19speculated that, given that the primary source of slurry
PO4was probably animal faeces, theδ18OPO4value probably reflected the Eδ18OPO4value of PO4within the animal due to high microbial turnover, and that the Eδ18OPO4value was strongly influenced by the higher body temperature relative to the ambient water temperature in
the aquatic environment receiving the slurry.
In the present study, we sought to analyse fresh cattle faeces to
establish itsδ18OPO4value, to see how consistent this value was, and whether it was similar both to the values of animal slurry already
measured and to the calculated Eδ18OPO4value for the animal. The forms of P in animal faeces can be split into three broad categories. Toor
et al22described many forms of P in animal faeces, although these can
be more simply described as (i) organic P and (ii) inorganic P. However,
their NaOH/EDTA extraction subsumes and incorporates a third form
of P which is of interest when examiningδ18OPO4 values
–(iii) the microbial P. For the purposes of this study, we did not attempt to
examine theδ18OPO4values of organic forms of P, but, instead, aimed to characterise the inorganic 'free' PO4, and the 'microbial' PO4of cattle
faeces. There is no reported method for doing this in animal faeces so
we attempted to apply and adapt an approach used for soils to test
the following hypothesis: Theδ18OPO4 value of inorganic 'free' PO4 and the 'microbial' PO4will be the same and will reflect the Eδ18OPO4 value calculated for fresh cattle faeces.
2
|E X P E R I M E N T A L
2.1
|Sample collection
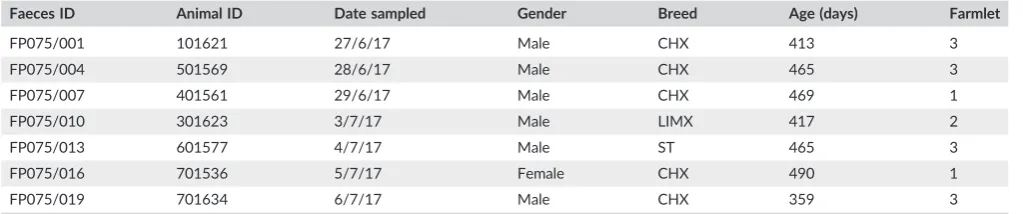
The details of the animals sampled are presented in Table 1. The animals
sampled were being reared on the North Wyke Farm Platform23and came
from one of the three treatments which, individually, comprise a farmlet;
(1) 'Legumes': sward improvement by reseeding with long‐term grass
and white clover mixtures; (2) 'Planned reseeding': sward improvement
through regular reseeding using new varieties of grass; and (3) 'Permanent
pasture': sward improvement of the existing permanent grassland
using artificial fertilisers (both other treatments are also fertilised).
Samples were collected from seven animals whose ages ranged
between 359 and 490 days old; six were male and one female, and five
were Charolais crosses, one a Limousin cross, and one a Stabilizer.
Animals were not preselected for the study; simply, the first animal
to defecate was selected. The animal ID number was noted and about
150 g of faeces was collected from the ground using sterile containers.
Samples of fresh faeces were collected directly after being voided onto
the soil surface in clean aluminium containers and returned immediately
to the laboratory for sub‐sampling and preparation. First, a sub‐sample
of 2–3 g faeces was placed into a 12‐mL glass exetainer, sealed
and frozen at−20°C, ready for determination of itsδ18OH2Ovalue. Secondly, a 1 g faeces sub‐sample for microbial analysis was placed in
a 25‐mL polystyrene screw‐capped container (Sterilin, Newport, UK),
potassium chloride, 0.105; calcium chloride 6H2O, 0.12; sodium
bicarbonate, 0.05; pH 7.0; Oxoid, Basingstoke, UK), and stored at 4°C
for analysis within 24 h. Thirdly, a 20–30 g sub‐sample was taken,
placed in a pre‐weighed foil tray, weighed, and then dried to a constant
weight at 105°C overnight to determine dry matter (DM) content.
2.2
|Development of extraction methods for
distinguishing inorganic and microbial PO
4in cattle faeces
The method development experiments for distinguishing inorganic and
microbial PO4 were based on extraction methods described for
soils;24,25whereby samples were extracted in a matrix of deionised
water, or deionised water and hexanol, in the presence of anion‐
exchange resins to collect 'free' PO4and 'microbial' PO4, respectively.
Tests using faeces found that there was no difference in the amounts
of PO4recovered from faeces with, or without, hexanol (results not
presented). This suggested that either there was no microbiological
content within the faeces, or that hexanol did not lyse the cells. As it
seemed unlikely that there would be no faecal microbial content, it
was hypothesised that osmotic stress was causing the lysis of most
of the microbial cells present and therefore the addition of hexanol
would not further increase the amount of extractable PO4. This
hypothesis was based on the standard practice of microbiologists in
using a buffered solution when extracting gut microbiology for
culture.26,27 Unlike soil microbiology, gut microbiology tends to be
adversely affected in pure water and, to prevent this, the use of an
isotonic diluent such as ¼ strength Ringer's solution is well established.
Ringer's solution contains mainly anions, to prevent the osmotic
stress of the microbiology, so a recovery test was undertaken to see
if it would adversely affect the ability of the anion resins to collect
PO4. A PO4spike was added to a container of Ringer's solution into
which anion resins were placed. After a 16‐h shaking period, it was
found that PO4 recovery was unaffected by the Ringer's solution
(results not shown) and on this basis the study was continued.
2.2.1
|Microbiology
Determination of the number of bacteria was undertaken using the
standard plate count method for Escherichia coli, a faecal indicator
organism. The sample to be tested was diluted through serial dilutions
to obtain a small number of colonies on each agar plate; 0.1 mL of the
diluted sample was spread on the surface of a Membrane Lactose
Glucuronide Agar (MLGA) (Oxoid) plate. Samples were initially vortex
mixed before appropriate serial dilutions, from which 0.1 mL was
spread plated aseptically. Once plates were dry, they were incubated
at 44.0°C (±0.5°C) for between 18 and 24 h. After the total incubation
period, all plates were examined and plates with between 30 and 300
colonies were counted.
2.3
|Sample extraction
2.3.1
|Faecal PO
4Two further sub‐samples were extracted for PO4; (i) Resin PO4:
25–100 g placed in a 5‐L HDPE sealable bottle, diluted with 3 L
Ringer's solution, and 72 anion‐exchange resin (VWR International
Ltd, Lutterworth, UK) squares (4 cm × 4 cm) added; and (ii) Microbial
PO4: 1–2 g placed in a 5‐L HDPE bottle and diluted with 3 L deionised
water, and 72 anion‐exchange resin squares added. The bottles were
placed on an orbital shaker set at 100 rpm, in a 4°C walk‐in refrigerator.
After 16 h, the bottles were removed and the extracting solution
sub‐sampled for microbial analysis by diluting 1 mL of extractant
solution in 9 mL Ringer's solution and stored at 4°C before analysis
within 24 h. Resins were then recovered by pouring the extraction
solution from the 5‐L bottle though a 4 mm sieve ensuring that all resins
were recovered from the bottle. As the sample was highly organic in
nature we felt it necessary to test and, if needed, account for any
potential hydrolysis of organic P during the extraction of PO4from the
resins. Resins from each extraction were divided into two sub‐sets of
36, placed in a 250‐mL polypropylene screw‐capped bottle and washed
several times with their respective, fresh, matrix solutions. When clean,
PO4 was liberated from the resins using 75 mL of 0.2 M nitric acid
(HNO3). For each of the two sub‐sets of 36 resins collected from a
single extraction matrix, δ18OH2O unlabelled (−5.7‰) and labelled (+81.6‰) 0.2 M NHO3was used to test for hydrolysis of organic P by
the acid. The correctedδ18OPO4value is then calculated using a revised version18of the mass balance equation described by McLaughlin et al:28
δ18OPO4¼ δ 18O
Psp*δ18OAus
− δ18O
Pus*δ18OAsp
δ18OPsp−δ18OPus−δ18OAspþδ18OAus
whereδ18OPO4is the corrected final stable oxygen isotope ratio for PO4 considering the effect of any hydrolysis of organic P,δ18OPspis the stable oxygen isotope ratio of the PO4 collected using 18O‐spiked HNO3,
δ18OPusis the stable oxygen isotope ratio of the PO4collected using unspiked HNO3,δ18OAusis the stable oxygen isotope ratio of the water
TABLE 1 Information on the cattle from which faeces were sampled
Faeces ID Animal ID Date sampled Gender Breed Age (days) Farmlet
FP075/001 101621 27/6/17 Male CHX 413 3
FP075/004 501569 28/6/17 Male CHX 465 3
FP075/007 401561 29/6/17 Male CHX 469 1
FP075/010 301623 3/7/17 Male LIMX 417 2
FP075/013 601577 4/7/17 Male ST 465 3
FP075/016 701536 5/7/17 Female CHX 490 1
FP075/019 701634 6/7/17 Male CHX 359 3
Breed codes: CHX = Charolais cross, LIMX = Limousin cross, ST = Stabilizer.
in the unspiked HNO3, andδ18OAspis the stable oxygen isotope ratio of water in the18O
‐spiked HNO3.
Phosphate in the extracts was converted into silver phosphate
(Ag3PO4) using the purification protocol described by Tamburini
et al.29 The process utilises a series of dissolution and precipitation
reactions to isolate and purify dissolved PO4. The PO4is precipitated
first as ammonium phosphomolybdate before it is dissolved and
reprecipitated as magnesium ammonium phosphate which is dissolved
again. The resultant PO4 in solution is converted into Ag3PO4
through the addition of an Ag‐ammine solution which is then placed
in an oven for 1 day at 50°C. Although the Tamburini protocol uses a
DAX‐8 resin early in the extraction its use is not necessary unless
organic contamination is present in the subsequent Ag3PO4
(F. Tamburini, personal communication).30
2.3.2
|Faecal water
Cryogenic extraction of faeces water was undertaken at the National
Isotope Geosciences Laboratory, based at the British Geological Survey
in Nottingham, UK. Frozen samples were placed in a U‐shaped vacuum
tube (borosilicate glass), the sample containing side of which was
immersed in liquid N2to ensure complete freezing of sample water.
The U‐tube was then evacuated to a pressure of <10−2mbar, removing
all the residual atmosphere. Once under stable vacuum, the U‐tube was
sealed, removed from the vacuum line and the sample side of the tube
placed in a furnace at 100°C. Sample water collection was achieved by
immersing the opposite side of the glass U‐tube in liquid nitrogen,
forcing evaporated sample water to condense and collect. This setup
was maintained for at least 1 h to ensure complete water transfer.
Sample water was collected and stored refrigerated in 1.5‐mL vials with
no headspace until isotope analysis. Samples were weighed before and
after extraction to assess whether they had been successfully dried.
2.4
|Sample analysis
2.4.1
|Phosphate
Phosphate concentrations were determined colourimetrically on an
Aquachem 250 analyser (Thermo Fisher Scientific, Waltham, MA, USA)
using a molybdenum blue reaction31after they had been diluted (typically
1/10th) to avoid any acid interference with the molybdenum chemistry.
2.4.2
|Isotopes
Measurement of the PO418O/16O ratio was undertaken by weighing
approximately 300μg of Ag3PO4into a silver capsule to which a small
amount of fine glassy carbon powder was added.29The sample was
converted into carbon monoxide by dropping it into a thermal
conversion elemental analyser (ThermoFinnigan, Bremen, Germany) at
1400°C; the resultant carbon monoxide mixed with a helium carrier gas
passed through a GC column into a Delta + XL mass spectrometer
(ThermoFinnigan). Theδ18OPO4values were calculated by comparison with an internal Ag3PO4laboratory standard, ALFA‐1 (ALFA‐1 =δ18O VSMOW value of +14.2‰). In the absence of an international Ag3PO4
reference material, we derived this value for ALFA‐1 by comparison with
the Ag3PO4standard 'B2207' (Elemental Microanalysis Ltd, Okehampton,
UK), which has been measured in an inter‐laboratory comparison study
to have aδ18O value of +21.7
‰versus VSMOW. Samples were run in triplicate, with a typical precisionσ≤0.3‰. Sample purity was assessed by determining the CO yield compared with the yield of Ag3PO4
standards, and samples were rejected where this differed by 10%.
Faeces water δ18OH2Ovalues were determined on an Isoprime Aquaprep coupled to an Isoprime 100 dual‐inlet isotope ratio mass
spectrometer (Isoprime Ltd, Cheadle Hulme, UK) through a process
of headspace CO2equilibration with water samples. The isotope ratios
are reported asδ18OH2Ovalues versus VSMOW, based on comparison with laboratory standards calibrated against IAEA standards VSMOW
and SLAP, with analytical precision typicallyσ≤0.05‰.
2.5
|Statistical analysis
All statistical analyses were conducted in R.32
3
|R E S U L T S
3.1
|Faecal properties
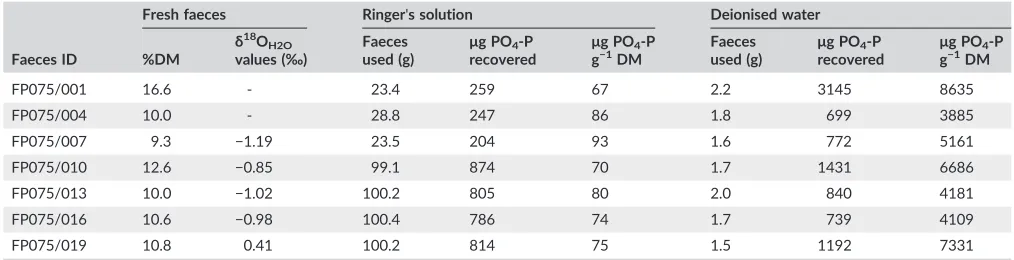
The fresh faeces were found to have a DM ranging from 9.3 to 16.6% with
a mean of 11.4% (±2.5) while theδ18OH2Ovalues ranged between−1.19 and +0.41‰with a mean of−0.73‰(±0.65) (Table 2). The amounts of
PO4collected from faeces when using Ringer's solution ranged from
67 to 93μg PO4‐P g−1DM with a mean of 78 (±9.1)
μg PO4‐P g−1 DM. This was found to be significantly less (t6=−8.03; p <0.001) than
that collected using deionised water which ranged from 3885 to
8635μg PO4‐P g−1DM with a mean of 5713 (±1856)μg PO4‐P g−1DM.
3.2
|Faecal microbiological content
Fresh cattle faeces had E. coli concentrations ranging from 6.1 to
7.85 CFU g−1DM (Table 3). The concentrations ofE. coliin the two
TABLE 2 Properties of the different fresh faeces samples collected
Faeces ID
Fresh faeces Ringer's solution Deionised water
%DM
δ18
OH2O
values (‰)
Faeces used (g)
μg PO4‐P
recovered
μg PO4‐P
g−1DM
Faeces used (g)
μg PO4‐P
recovered
μg PO4‐P
g−1DM
FP075/001 16.6 ‐ 23.4 259 67 2.2 3145 8635
FP075/004 10.0 ‐ 28.8 247 86 1.8 699 3885
FP075/007 9.3 −1.19 23.5 204 93 1.6 772 5161
FP075/010 12.6 −0.85 99.1 874 70 1.7 1431 6686
FP075/013 10.0 −1.02 100.2 805 80 2.0 840 4181
FP075/016 10.6 −0.98 100.4 786 74 1.7 739 4109
extracting solutions ranged from 5.73 to 7.71 CFU g−1DM in Ringer's
solution and from 5.85 to 8.02 CFU g−1DM in deionised water. There
was no significant difference in E. coliconcentrations between raw
faeces, Ringer's solution and deionised water.
3.3
|Extractable faecal
δ
18O
PO4values
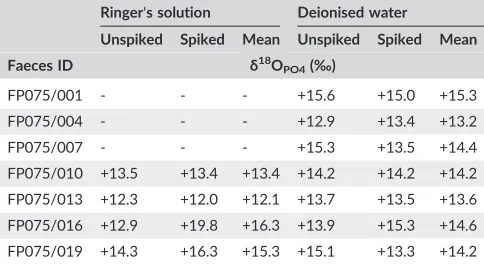
To assess whether organic P had been hydrolysed by the 0.2 M HNO3
resin elution solution, theδ18OPO4values obtained following extraction with18O
‐labelled and unlabelled HNO3were analysed statistically and it was found that no significant difference occurred between labelled
and unlabelled acid elution for extractions with either Ringer's solution
(t3.358=−1.2012; p >0.05) or deionised water (t11.606= 0.6995; p >0.05).
It was concluded therefore that there was no need to correct data using
the equation described by McLaughlin et al.28Instead, a mean of the
spiked and unspiked values was used to report the resin‐extractable
δ18
OPO4values. Theδ18OPO4values for the PO4extracted from faeces are presented in Table 4. Theδ18OPO4values for PO4extracted using Ringer's solution for the first three samples are not presented as
the amount of some of them was too small for standard Ag3PO4
precipitation. Of the remaining four faecal samples the values ranged
from +12.0 to +19.8‰ with mean values between +12.1 and
+16.3‰. The values for the seven samples extracted in deionised water
ranged from +12.9 to +15.6‰with mean values of +13.2 and +15.3‰.
The greatest variation between labelled and unlabelled acidδ18OPO4 elution values occurred in the Ringer's solution dataset with the mean
difference of the labelled acid extraction being +2.1‰. This result,
however, was strongly influenced by one anomalously high labelled
acidδ18OPO4value of +19.8‰, leading to a difference of +6.9‰. This sample also had a slightly higher oxygen yield indicating that it was
not pure Ag3PO4 which could explain the relatively high difference
between theδ18OPO4values of labelled and unlabelled acid extraction. The differences observed in the deionised water labelled and unlabelled
acid elution were far smaller and ranged between−1.8 and +1.4‰with
a mean of−0.3‰. Statistical analysis of the two sets of paired data
shows that there was no difference between the δ18OPO4 values obtained following extraction using Ringer's solution and that using
deionised water (t3.463= 0.0785; p >0.05).
4
|D I S C U S S I O N
4.1
|Microbiological content
The concentrations ofE. colireported here are consistent with those
reported in the literature for beef cattle faeces.33-35The use of ¼ strength
sterile Ringer's solution before bacteriological examination is well
established26,27to effectively protect bacterial cells from the osmotic
shock that they would experience when being suspended in sterile water.
However, the new data from this study (Table 3) indicate that there was
no difference between Ringer's solution and deionised water and that the
microbial cells were thus not lysed in water and that the extracted PO4in
both cases does not represent 'microbial' PO4released through cellular
breakdown during the extraction process but, instead, 'free' PO4.
4.2
|Resin
‐
extractable PO
4The amounts of PO4extracted in deionised water were significantly
higher than in Ringer's solution. This finding is at odds with the initial
recovery test undertaken on PO4in a pure Ringer's solution matrix.
However, it would seem that the combination of organic material,
faecal anions, and the anions within the solution itself significantly
reduced the recovery of PO4on the resins in a way that did not occur
in just the Ringer's solution alone. This interference raises questions
about the validity of the δ18OPO4values of PO4 recovered in this solution due to potential unknown fractionations that might occur as
a result of preferential adsorption/desorption of the lighter/heavier
isotopologues.36 The microbiological analysis showed that cell lysis
and rupture did not occur in either extraction (Table 3). Therefore,
the results derived from the Ringer's solution extraction are not
considered further in this discussion, as it apparent that the method
for distinguishing microbial PO4from inorganic PO4(as defined earlier)
requires further development.
4.3
|Faecal water
The fresh faeces %DM values are consistent with those reported
elsewhere for cattle grazing pasture.37 The cattle's main source of
water is via drinking troughs supplied using ground water originating
from a local borehole. The δ18OH2O value of the groundwater is relatively stable and will represent an integrated value of the annual
precipitation supplying it. At this location, the δ18OH2O value is
TABLE 3 Colony‐forming units (CFU) forE. coliin raw faeces, a Ringer's solution extraction and a deionised water extraction expressed in per g of faecal dry matter (DM)
Ringers solution Faeces ID
Raw
faeces log10CFU g−1DM
Deionised water
FP075/001 6.28 6.38 6.22
FP075/004 7.85 7.71 8.02
FP075/007 7.01 6.99 7.05
FP075/010 6.10 5.73 5.85
FP075/013 7.10 7.22 7.04
FP075/016 6.93 7.08 7.46
FP075/019 7.38 7.35 7.63
TABLE 4 Measured and meanδ18OPO4values of PO4collected from seven fresh cattle faeces samples using anion resins in either Ringer's solution or deionised water
Ringer's solution Deionised water
Unspiked Spiked Mean Unspiked Spiked Mean
Faeces ID δ18O
PO4(‰)
FP075/001 ‐ ‐ ‐ +15.6 +15.0 +15.3
FP075/004 ‐ ‐ ‐ +12.9 +13.4 +13.2
FP075/007 ‐ ‐ ‐ +15.3 +13.5 +14.4
FP075/010 +13.5 +13.4 +13.4 +14.2 +14.2 +14.2
FP075/013 +12.3 +12.0 +12.1 +13.7 +13.5 +13.6
FP075/016 +12.9 +19.8 +16.3 +13.9 +15.3 +14.6
predicted to be between−5.5 and−6.0‰.38The drinking troughs are
refilled with fresh water every time that an animal drinks from them
and therefore we do not consider deviations from the groundwater
δ18OH2Ovalue due to evaporative losses as important. Abeni et al39 also found that summer and winter drinking water δ18OH2Ovalues did not differ greatly despite the increased temperatures. Water is also
ingested as metabolic water in food, which is likely to be isotopically
heavier than local meteoric water due to fractionation;40 however,
the main source of water for the animal is considered to be that
supplied by the drinking troughs. Abeni et al39 showed that the
δ18
OH2Ovalues of various forms of body water in cattle were from
4.2 to 7.9‰heavier than in drinking water in the summer and that
for faecal water they were from 4.8 to 7.7‰heavier. The measured
δ18OH2Ovalue in faeces in this study was found to be up to 6.4 ‰ heavier than in groundwater and this was not unexpected as
demonstrated by the model proposed by Bryant and Froelich.40Water
lost via breath water vapour and transcutaneous water vapour will be
isotopically fractionated, leading to an increase in body waterδ18OH2O values while water lost via pathways such as urine, faeces and sweat
will be similar and thus have similar δ18OH2Ovalues to that of the animal's body water. The increase inδ18OH2Ovalue will also be more pronounced in the summer when temperatures are higher.39
4.4
|Theoretical animal E
δ
18O
PO4values
The use of Eδ18OPO4 values is widespread within the
δ18OPO4 community to benchmark measured values with values that have
potentially lost their original signal through intracellular cycling,
specifically through the enzyme pyrophosphatase. However, there is
much uncertainty as to how relevant this theoretical equilibrium is in
many situations, and we acknowledge that in terms of animal gut
processes other cycling pathways may predominate.
The normal temperature of cattle is 38.6°C, with anything outside
a range of 38.0 to 39.2°C indicating ill health.41When combined with
the range ofδ18OH2Ovalues measured in faeces and with the range expected for the ground/drinking water in the region, a Eδ18OPO4 range of values from +13.2 to +14.0‰is expected, assuming that
the body waterδ18OH2Ovalue is similar to that of ground water and +18.1 to +19.9‰if theδ18OH2Ovalues within faeces are used and are taken to represent the animal body water (Figure 1).
4.5
|Extractable faecal
δ
18O
PO4values
As it was shown that the resin‐extractable PO4 was not derived
directly from the lysis of microbial cells, it was not possible to compare
'free' PO4with 'microbial' PO4. However, theδ18OPO4values of the 'free' PO4ranged between +13.2 and +15.3‰which are very similar
to those reported for slurry PO4 by Granger et al19 which ranged
between +12.0 and +15.0‰despite being extracted differently and
representing a much more heterogeneous source material (Figure 1).
There was no apparent relationship between theδ18OPO4values and the animal variables; however, the scope of the study was too limited
to investigate variables such as age, gender, breed, etc. Theδ18OPO4 values reported within this study indicate that the slurry δ18OPO4 values are caused by the PO4in animal faeces. Theδ18OPO4values
of the faeces themselves, however, are at or slightly above the range
of Eδ18OPO4 values based on the ground/drinking water
δ18OH2O values. However, all the values are at least 2.8‰ lower that the
Eδ18OPO4value range calculated from the
δ18OH2O value of faecal water, water that should be far more representative of the body water
of the animal.40It is unclear why this is the case without further work
being carried out to investigate animal P food sources and metabolic
processes within the animal.
5
|C O N C L U S I O N S
• The extractable PO4 from fresh cattle faeces was lower using Ringer's solution than deionised water. However, this did not
appear to be because of microbial cellular lysis in the deionised
water extraction. It would appear to be due to some form of
interference between the Ringer's solution ions, compounds in
the faeces and the anion resin sheets. Because of this it was
notpossible to differentiate 'microbial' PO4 and 'free' PO4, and
their respective δ18OPO4 values. As it has been shown that deionised water does not lyse the microbial cells it would be
worth repeating the study using the more traditional resin PO4
extraction in a water/hexanol extraction solution to extract
'microbial' PO4and to also use the microbial assays described to
establish if this occurs.
• Theδ18OPO4values of fresh cattle faeces, under the conditions reported in this study, ranged between +13.2 and +15.3‰which
are consistent with those reported elsewhere for agricultural
animal slurry.
• Theδ18OPO4values are similar to the E
δ18OPO4value calculated for within the animal using theδ18OH2Ovalue of groundwater. However, they are at least 2.8‰lower than the Eδ18OPO4value range calculated using faecal water as a proxy for the animals'
body water.
• There were no apparent relationships between the animal variables and theδ18OPO4value. However, to examine these, a more detailed study is required which should also include other
animals for which few data exist in the literature.
A C K N O W L E D G E M E N T S
This work at Rothamsted forms part of the Soil to Nutrition (S2N)
strategic programme (BBS/E/C/000I0330) funded by the Biotechnology
and Biological Sciences Research Council which also supported the
research through an international travel grant (BB/K013327/1) and
the 2015 Rothamsted Fellowship. The authors thank the Natural
Environment Research Council (NERC) for analytical support through
the award of grant IP‐1564‐1115. The authors also thank Hannah
Fleming for her knowledge of the body temperature of cattle, Paul
Harris for statistical advice and the anonymous reviewers and editor
for their time improving this manuscript.
O R C I D
Steven J. Granger http://orcid.org/0000-0003-0183-0244
R E F E R E N C E S
1. Westheimer FH. Why nature chose phosphates. Science. 1987;235(4793):1173‐1178. https://doi.org/10.1126/science.2434996
2. Sharpley A, Daniel TC, Sims JT, Pote DH. Determining environmentally sound soil phosphorus levels.J Soil Water Conserv. 1996;51(2):160‐166.
3. Haygarth PM, Chapman PJ, Jarvis SC, Smith RV. Phosphorus budgets for two contrasting grassland farming systems in the UK. Soil Use Manag.1998;14:160‐167.
4. Smith RV, Lennox SD, Jordan C, Foy RH, McHale E. Increase in soluble phosphorus transported in drainflow from a grassland catchment in response to soil phosphorus accumulation. Soil Use Manag. 1995;11(4):204‐209.
5. Withers PJA, Ulen B, Stamm C, Bechmann M. Incidental phosphorus losses‐are they significant and can they be predicted?J Plant Nutr Soil Sci‐Z Pflanzenernahr Bodenkd. 2003;166(4):459‐468. https://doi.org/ 10.1002/jpln.200321165
6. Heathwaite AL, Dils RM. Characterising phosphorus loss in surface and subsurface hydrological pathways.Sci Total Environ. 2000;251:523‐538.
7. Conley DJ, Paerl HW, Howarth RW, et al. Ecology: Controlling eutrophication: Nitrogen and phosphorus. Science. 2009;323(5917): 1014‐1015. https://doi.org/10.1126/science.1167755
8. Correll DL. The role of phosphorus in the eutrophication of receiving waters: A review.J Environ Qual. 1998;27(2):261‐266.
9. Bol R, Amelung W, Friedrich C, Ostle N. Tracing dung‐derived carbon in temperate grassland using13C natural abundance measurements.Soil Biol Biochem. 2000;32(10):1337‐1343.
10. Bronders J, Tirez K, Desmet N, et al. Use of compound‐specific nitrogen (δ15N), oxygen (δ18O), and bulk boron (δ11B) isotope ratios to identify sources of nitrate‐contaminated waters: A guideline to identify polluters. Environ Forensics. 2012;13(1):32‐38. https://doi. org/10.1080/15275922.2011.643338
11. Senbayram M, Dixon L, Goulding KWT, Bol R. Long‐term influence of manure and mineral nitrogen applications on plant and soil15N and 13C values from the Broadbalk Wheat Experiment.Rapid Commun Mass
Spectrom. 2008;22(11):1735‐1740. https://doi.org/10.1002/rcm.3548
12. Davies CL, Surridge BJ, Gooddy DC. Phosphate oxygen isotopes within aquatic ecosystems: Global data synthesis and future research priorities.Sci Total Environ. 2014;496:563‐575. https://doi.org/10.1016/ j.scitotenv.2014.07.057
13. Tamburini F, Pfahler V, von Sperber C, Frossard E, Bernasconi SM. Oxygen isotopes for unraveling phosphorus transformations in the soil‐plant system: A review. Soil Sci Soc Am J. 2014;78(1):38‐46. https://doi.org/10.2136/sssaj2013.05.0186dgs
14. Blake RE, O'Neil JR, Garcia GA. Oxygen isotope systematics of biologically mediated reactions of phosphate: 1. Microbial degradation of organophosphorus compounds.Geochim Cosmochim Acta. 1997;61(20): 4411‐4422. https://doi.org/10.1016/s0016‐7037(97)00272‐x
15. Longinelli A, Nuti S. Oxygen isotope measurments of phosphate from fish teeth and bones. Earth Planet Sci Lett. 1973;20(3):337‐340. https://doi.org/10.1016/0012‐821x(73)90007‐1
16. Paytan A, Kolodny Y, Neori A, Luz B. Rapid biologically mediated oxygen isotope exchange between water and phosphate. Global Biogeochem Cycles. 2002;16(1):13‐11‐13‐18. https://doi.org/ 10.1029/2001gb001430
17. Chang SJ, Blake RE. Precise calibration of equilibrium oxygen isotope fractionations between dissolved phosphate and water from 3 to 37 degrees C.Geochim Cosmochim Acta. 2015;150:314‐329. https://doi. org/10.1016/j.gca.2014.10.030
18. Pistocchi C, Tamburini F, Gruau G, Ferhi A, Trevisan D, Dorioz JM. Tracing the sources and cycling of phosphorus in river sediments using oxygen isotopes: Methodological adaptations and first results from a case study in France.Water Res. 2017;111:346‐356. https://doi.org/ 10.1016/j.watres.2016.12.038
19. Granger SJ, Heaton THE, Pfahler V, Blackwell MSA, Yuan HM, Collins AL. The oxygen isotopic composition of phosphate in river water and its potential sources in the Upper River Taw catchment, UK. Sci Total Environ. 2017;574:680‐690. https://doi.org/10.1016/j. scitotenv.2016.09.007
20. Young MB, McLaughlin K, Kendall C, et al. Characterizing the oxygen isotopic composition of phosphate sources to aquatic ecosystems. Environ Sci Technol. 2009;43(14):5190‐5196. https://doi.org/ 10.1021/es900337q
21. Chadwick DR, Chen S. Manures. In: Haygarth PM, Jarvis SC, eds. Agriculture, Hydrology and Water Quality. 1st ed. Wallingford, UK: CABI Publishing; 2002:57‐82.
22. Toor GS, Cade‐Menun BJ, Sims JT. Establishing a linkage between phosphorus forms in dairy diets, feces, and manures.J Environ Qual. 2005;34(4):1380‐1391. https://doi.org/10.2134/jeq2004.0232
23. Orr RJ, Murray PJ, Eyles CJ, et al. The North Wyke Farm Platform: effect of temperate grassland farming systems on soil moisture contents, runoff and associated water quality dynamics.Eur J Soil Sci. 2016;67(4):374‐385. https://doi.org/10.1111/ejss.12350
24. Kouno K, Tuchiya Y, Ando T. Measurment of soil microbial biomass phosphorus by an anion‐exchange membrane method.Soil Biol Biochem. 1995;27(10):1353‐1357. https://doi.org/10.1016/0038‐0717(95)00057‐l
25. McLaughlin MJ, Alston AM, Martin JK. Measurment of phosphorus in the soil microbial biomass‐a modified procedure for field soils.Soil Biol Biochem. 1986;18(4):437‐443. https://doi.org/10.1016/0038‐0717(86)90050‐7
26.Bacterial Tests for Graded Milk. London: Dept. of Health and Social Security; 1937.
27. Davis JG.Laboratory Control of Dairy Plant. London: Dairy lndustries Ltd; 1956.
28. McLaughlin K, Paytan A, Kendall C, Silva S. Oxygen isotopes of phosphatic compounds – Application for marine particulate matter, sediments and soils. Mar Chem. 2006;98(2‐4):148‐155. https://doi. org/10.1016/j.marchem.2005.09.004
29. Tamburini F, Bernasconi SM, Angert A, Weiner T, Frossard E. A method for the analysis of the delta O‐18 of inorganic phosphate extracted from soils with HCl.Eur J Soil Sci. 2010;61(6):1025‐1032. https://doi. org/10.1111/j.1365‐2389.2010.01290.x
30. International Atomic Energy Agency.Supporting Sampling and Sample Preparation Tools for Isotope and Nuclear Analysis. Austria: (IAEA); 2016.
32. Available: https://www.r‐project.org/.
33. Hodgson CJ, Bulmer N, Chadwick DR, et al. Establishing relative release kinetics of faecal indicator organisms from different faecal matrices. Lett Appl Microbiol. 2009;49(1):124‐130. https://doi.org/10.1111/ j.1472‐765X.2009.02630.x
34. Moriarty EM, Sinton LW, Mackenzie ML, Karki N, Wood DR. A survey of enteric bacteria and protozoans in fresh bovine faeces on New Zealand dairy farms. J Appl Microbiol. 2008;105(6):2015‐2025. https://doi.org/10.1111/j.1365‐2672.2008.03939.x
35. Sinton LW, Braithwaite RR, Hall CH, Mackenzie ML. Survival of indicator and pathogenic bacteria in bovine feces on pasture. Appl Environ Microbiol. 2007;73(24):7917‐7925. https://doi.org/10.1128/ aem.01620‐07
36. Jaisi DP, Blake RE. Advances in using oxygen isotope ratios of phosphate to understand phosphorus cycling in the environment. In: Sparks DL, ed. Advances in Agronomy. Vol. 125 San Diego: Elsevier Academic Press Inc.; 2014:1‐53. doi: 10.1016/b978‐0‐12‐800137‐0.00001‐7.
37. During C, Weeda WC. Some effects of cattle dung on soil properties, pasture production, and nutrient uptake .1. Dung as a source of phosphorus.N Z J Agric Res. 1973;16(3):423‐430.
38. Darling WG, Bath AH, Talbot JC. The O & H stable isotopic composition of fresh waters in the British Isles. 2. Surface waters and groundwater.Hydrol Earth Syst Sci. 2003;7(2):183‐195.
39. Abeni F, Petrera F, Capelletti M, et al. Hydrogen and oxygen stable isotope fractionation in body fluid compartments of dairy cattle according to season, farm, breed, and reproductive stage.PLoS One. 2015;10(5):18. https://doi.org/10.1371/journal.pone.0127391
40. Bryant JD, Froelich PN. A model of oxygen isotope fractionation in body water of large mammals. Geochim Cosmochim Acta. 1995;59(21):4523‐4537.
41. Thomas HS. Raising Beef Cattle. 3rd ed. United States: Storey Publishing; 2009.
How to cite this article: Granger SJ, Yang Y, Pfahler V, et al. The stable oxygen isotope ratio of resin extractable phosphate
derived from fresh cattle faeces.Rapid Commun Mass Spectrom.
![FIGURE 1The range of δ18OPO4 values for deionised water extractedfresh faeces compared with (i) the reported values for agriculturalslurry, (ii) the Eδ18OPO4 for cattle assuming body water δ18OH2O isequivalent to ground water and, (iii) the Eδ18OPO4 for cattle assumingbody water δ18OH2O is equivalent to faecal water [Color figure can beviewed at wileyonlinelibrary.com]](https://thumb-us.123doks.com/thumbv2/123dok_us/1090805.1609661/6.595.309.548.44.222/deionised-extractedfresh-agriculturalslurry-isequivalent-assumingbody-equivalent-beviewed-wileyonlinelibrary.webp)
