The Effect of Window Length on Accuracy of
Smartphone-Based Activity Recognition
Sulaimon A. Bashir, Daniel C. Doolan, Andrei Petrovski
Abstract—One of the main approaches for personalization of activity recognition is the generation of the classification model from user annotated data on mobile itself. However, giving the resource constraints on such devices there is a need to examine the effects of system parameters such as the feature extraction parameter that can affect the performance of the system. Thus, this paper examines the effects of window length of the sensor data and varying data set sizes on the classification accuracy of four selected supervised machine learning algorithms running on off the shelf smartphone. Our results show that out of the three window lengths of 32, 64 and 128 considered, the 128 window length yields the best accuracy for all the algorithms tested. Also, the time taken to train the algorithms with samples of this length is minimal compare to 64 and 32 window lengths. A smartphone based activity recognition is implemented to utilize the results in an online activity recognition scenario.
Index Terms—activity recognition, smartphone, accelerome-ter sensor data, machine learning algorithms.
I. INTRODUCTION
Sensor rich smartphones are gradually becoming common-place items in the hands of billions of people worldwide. The ubiquity and the improved processing and storage resources on these phones are making them suitable for sensor data gathering and processing to infer meaningful information about the phones internal and external environment. We can infer various kinds of information such as users ac-tivities, locations and interactions based on the processed sensor data collected from the phone. A typical smartphone is equipped with a number of integrated sensors such as accelerometer, microphone, camera, gyroscope, GPS and many others depending on the manufacturer and model. These sensors can facilitate different types of sensor data mining applications such as activity and behavioural sensing, environment sensing, road and traffic monitoring and health monitoring [1]. Recognition of user activities, an important task in pervasive computing is moving from the use of traditional wearable sensors [2], [3], [4] to mobile platforms [5] due to the aforementioned capabilities of smartphones. Recognition of different activities provides contextual infor-mation to computing platforms for adapting their functions to the user contexts. For example, a device is configured to increase the screen font size if discovered that the user is walking to make it easy to read the screen or a device may do self-management to conserve resource usage by switching off radios like WiFi and bluetooth if discovered
S. A. BashirSchool of Computing Science and Digital Media, Robert Gordon University, Aberdeen, UK
e-mail: [email protected]
D. C. DoolanSchool of Computing Science and Digital Media, Robert Gordon University, Aberdeen, UK
e-mail: [email protected]
A. PetrovskiSchool of Computing Science and Digital Media, Robert Gordon University, Aberdeen, UK. e-mail: [email protected]
the user is running. Similarly, activity recognition is useful for fitness and health monitoring [6], social networking [7] and commercial application like activity based advertising [8].
The first fundamental step in performing context recog-nition with smartphones is sensor data collection to train classification algorithms. In many of the previous work, activity recognition is performed by collecting sensor data from many subjects that carry the mobile phones, uploads the data for training and generates a classification model on re-mote systems. However, the need to personalise classification model to each user requires training of the algorithm locally on the mobile phones using the user generated data only. However, giving the resource constraints on such devices there is a need to examine the effects of system parameters such as the feature extraction parameter that can affect the performance of the algorithms in terms of processing time and accuracy. Therefore, we examine the effects of window length of the sensor data and varying data set sizes on the accuracy and time required to train four selected algorithms (J48, Naive Bayes, PART and KNN) directly on a mobile phone. We aim to identify which of these state of the art activity recognition algorithms is more suitable for incremental update with additional data and also to select the optimal window length of the raw data from which feature can be extracted to induce the learning algorithms. Based on the results obtained, we implemented a smartphone based activity recognition utilizing built-in accelerometer in an Android phone. This work is an extension of our work presented in [9]. We employed Fast Fourier Transform (FFT) algorithm computation of Discrete Fourier Transform (DFT) to extract frequency domain feature from the raw time series accelerometer data. FFT feature extraction method for accelerometer data has been shown to perform better than statistical features extraction methods like mean, standard deviation and variance [10].
The rest of this paper is organised as follows: in Section 2, we present related and background work in activity recogni-tion system. Secrecogni-tion 3 discusses the experimental set-up and method. The results and discussion of the experiments are presented in Section 4. A mobile app for activity recognition that utilized the results of the experiment is presented in section 5 and the paper is concluded in Section 6.
II. RELATEDWORK
Mobile based activity recognition is gaining research momentum owing to the availability of inertial sensors on today’s smartphones. Ustev et. al. [10] have examined the effects of system parameters on the activity recognition accu-racy on smartphone. The paper evaluates the effects of users, device models and orientation differences on recognition ac-curacy of k-nearest neighbour classification algorithm using
IAENG International Journal of Computer Science, 43:1, IJCS_43_1_15
data collected from mobile phones accelerometer, gyroscope and compass sensors. They collected data under different scenarios to show the impact of the three experimental parameters on the classification accuracy. To elicit the effects of device orientation on classification accuracy, data collected with phone placed at horizontal orientation was used for training while the data collected when the phone was placed at vertical orientation was used for testing. Again, for the device independent test scenario, data from one phone model was used as training while the data from another phone model was used for testing. In the user independent test, a leave- one-out approach was used where a user data was left out during training and then used for testing the generated model from the rest of other users data. Their results show that, with simple features such as mean, variance and standard deviation, the user dependency test recorded 91% accuracy, while the phone dependency test reached 96% accuracy for the same phone model and 95% with different phone models. The orientation effects test was low with 83% accuracy. They further considered including more sophisticated features like FFT and autocorrelation and the observed an increase of accuracy of up to 1-2% across all the test scenarios. To improve further on the orientation effects test accuracy, they used both linear acceleration that was devoid of gravitational force and earth coordinates reference to collect new set of data. The new dataset yielded 93% for the orientation test and user dependency test increased to 95%. The earth coordinate system data obtained a further accuracy of up to 97% for both the orientation effects and the user dependency test. This study does not consider the effect of raw data window length in all the experiments. In addition, the data processing was performed off the phone on a desktop machine unlike our experiment, which we carried out on the mobile phone directly.
Another study [11] performed a comparative analysis of different classifier algorithms for activity recognition with mobile phone accelerometer data. They selected variety of algorithms from the seven categories of classification al-gorithms in Weka to build models for their two different data collection strategies. The data collected with phone placed in the shirt pocket was used to compare accuracies of IBK, Naive Bayes, Rotation Forest, VFI, DTNB and LMT algorithms while the data collected when the phone was placed in the palm position was used to compare accuracies of SMO, NNge, ClaaasificationViaRegression, FT, VFI, IBK and Naive Bayes algorithms. Out of all the algorithms tested, they reported IBK and IB1 to give the best accuracy for the hand’s palm data and VFI resulted in the lowest accuracy. For the shirt pocket’s data, rotation forest algorithm was reported to give best accuracy while simple logistic regression gave the lowest accuracy. In all, the accuracies of hand palm’s position was reported to be better overall. This study shows the relative performance of the algorithms but does not consider any system parameters such as sensor data window length that makes one algorithm to perform better than the others .
Authors in [12] conducted a study to investigate the impact of user differences on the accuracy of classification algorithms when the data collected from one user was used for training and separate data from another subject was used for testing. They induced three types of models from the
data collected to show the impact of each on the accuracy of classifier algorithms like J48 Decision Trees, Random Forest, IBk, J-rip, Voting Features Interval (VFI) and Logistic Regression. The first model, called the impersonal model was induced by using training data from set of subjects who were not targeted to use the model afterwards. This implies that the training set is totally different from the test set. This was achieved by designating data from a number of subjects for training and data from one specific subject as testing data. The personal model on the other hand was generated by using part of the data collected from a particular subject for training and another part of the same data for testing. This yielded a model that is personalised to the intended user only. The last model named hybrid model was generated with the data collected from a set of subjects used for training and part of the data from the same set of subjects used for testing. The hybrid model can be seen as a combination of the two other models. The result from the experiment shows that the personal model performance in terms of recognition accuracy across all the algorithms tested is the best, while the hybrid model came second best and the impersonal model performs worst. The best performing algorithm for the personal model is reported to be Multi-Layer Perceptron reaching an accuracy of 98.7% and its worst performing algorithm was J-rip with 95.1% accuracy. The best performing algorithm for the hybrid model was K-nearest neighbour with an accuracy of 96.5% and worst performing algorithm was VFI with 76% accuracy. The impersonal model has random forest algorithm performed best with an accuracy of 75.9% while multilayer perceptron gave the worst accuracy of 67.8 %. This experiment shows the superiority of personal model in activity recognition and support the notions of the need for solving the population diversity problem [13] encountered in large scale activity recognition involving diverse user population.
Several other activity recognition systems on mobile phone have been reported in the literature. Kose et al. [14] imple-mented a modified KNN algorithm called clustered KNN that uses smaller training sets on a mobile phone. Bartolo et al. [15] proposed an online training and classification approach that uses data stream mining. The benefit of data stream mining is that the training data are only observed once and no need to store all training records on the phone. A recent survey of various mobile based activity recognition system is presented in [5].
A. Traditional Supervised Approach to Activity Recognition
The generic architectural framework for activity recogni-tion involves five basic tasks i.) Sensor calibrarecogni-tion and Sam-pling ii.) Segmentation and Feature Extraction iii.) Online or Offline Training of classifier iv). Model deployment.
1) Sensor Data Sampling and Pre-Processing: The first step in inertial based AR is to sample the three axis ac-celerometer sensor to obtain raw sensor data. To ensure the reliability and accuracy of the raw data, pre-processing steps are required to be applied on the data. Typical pre-processing stages include: Sensor calibration and smoothing or filtering. Sensor Calibration: is used to eliminate the effects of zero offset and drift sensitivity error sometime encountered in accelerometer sensor data. Zero offset are erroneous data
IAENG International Journal of Computer Science, 43:1, IJCS_43_1_15
obtained from sensor other than the true expected zero values. For example, a device at rest is expected to give a magnitude acceleration of 9.8m/s2 which is the sum of
acceleration forces along each axis with x and y axes given zero values and y axis given 9.8m/s2 due to the gravity
effect. Any value more or less than this is regarded as offset error. Calibration requires the computation of scaling factor and offset values along each orthogonal axis of the accelerometer to compensate for the drift and offset error. A traditional approach to calibration is to determine the positive and negative g force along each of the device [16]. This is done by precise positioning of the device to the direction of gravity to determine the positive and negative g force experienced along the corresponding six orientations of the device. After obtaining these values, the offset and scale factor of each axis can be determined with equations 1 and 2 respectively. The positive values are the { b1, b2, b3
} while negative values are the{b01, b02, b03 }. The equations show only the calibration for x axis. The other axes can be computed similarly by using their corresponding positive and negative axis values along the g direction.
of f setx=
b1+b01
2 (1)
scalex=
|b1−b01|
2 (2)
The demerit of this approach stems from the difficulty of determining the precise g direction to point the device to. Also, the procedure needs to be repeated several times to obtain accurate values. Doing this will be cumbersome for the end user. Thus a more complex and automatic calibration techniques for accelerometer data have been presented in [17] and [18]. Smoothing or filtering can also be applied to ensure continuous elimination of jitter in the signal. Common filtering techniques include moving average, low pass filter and high pass filter.
2) Segmentation and Feature Extraction:
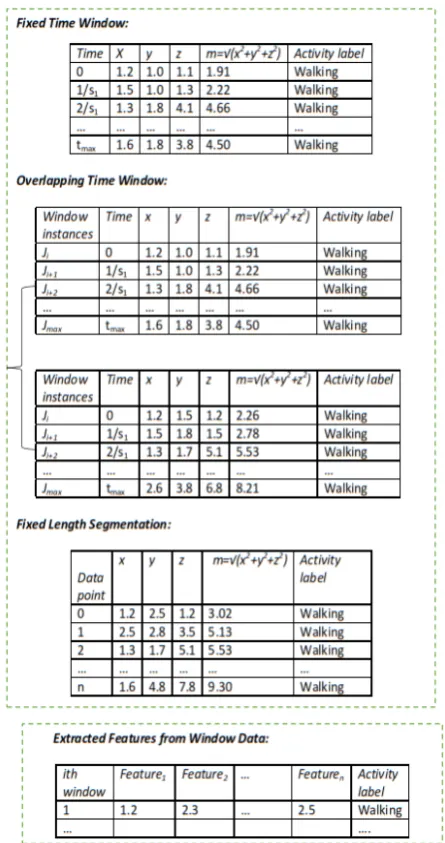
Segmentation : The individual point by point data in the streaming sensor data is inadequate to capture the signal variations associated with a given activity. This is because an activity can span a period of seconds or minutes thus a single sample point cannot contain adequate information to describe the performed activity [19]. Segmentation is the process of grouping of streaming time series raw sensor data into manageable chunks that contain discerning information describing an activity. The amount of sample data within a segment or window is dependent on the predefined window data collection strategy. Various windowing strategies have been proposed. Figure 1 shows three common approaches to windowing. The first approach is to collect chunks of data defined within every fixed time period. The second approach is the overlapping window whereby a previous window data is overlapped with the current window data by a predefined percentage. The advantage of the first approach is that it cater for inter activity transition points. The third approach does not employ time. The system collects a predefined amount of data of fixed sizenfrom the continuous flow of streaming sensor data.
Fig. 1. Segmentation of Raw Data with Windowing Approach
Feature Extraction: After the raw data is segmented, we need to extract more meaningful and informative features from them. These features will allow the comparison of data which is not possible using the raw window data directly. There are two basic categories of features that are commonly used in inertial based activity recognition. They are time and frequency domain features. Time domain features are basic statistical expressions computed over the raw data captured in the window. They can be computed from the individual orthogonal axis or from the magnitude of the three axes. The descriptions and formulae of some of the commonly used statistical features as described in [16] and [19] are summarized in the Table I. We assume the feature being computed is from the x-axis component.
Frequency domain features on the other hand are derived by transforming the window data into frequency domain by using Fast Fourier transform (FFT). The FFT coefficients obtained from the transform serve as the amplitudes of the frequency components of the signal and its energy distri-bution. A number of these coefficients can serve as feature vector and other features such as energy (equation3) can be
IAENG International Journal of Computer Science, 43:1, IJCS_43_1_15
TABLE I TIMEDOMAINFEATURES
Time Domain Features
Formulae Description
Mean 1n
n
P
i=1
xi The mean represent the
DC component of the mo-tion signal
Root Mean Squares
s
1 n
n
P
i=1 x2
i It captures the the
inten-sity of the signal and in-variable the activity being performed.
Variance n−11
n
P
i=1
(xi−X)2 As a measure of
dis-persion, this feature indi-cates level of dynamics of the signal, differentiat-ing between low dynamic activity such as walking and high dynamic activity such running.
Standard De-viation
s
1 n−1
n
P
i=1
(xi−X)2 Same as variance.
derived from the coefficients.
E=
n P
i=1
F F Tcoefi
n (3)
The energy feature captures the level of intensity of the accelerometer signal and invariably the activity intensity.
3) Model Generation: Once the data have been processed they are ready to be used for inducing classification model. Several supervised machine learning algorithms have been proposed by different authors. Preece et. al [20] presents a detail review of many of the exiting work on activity recognition. It is worthy to note that the model generation can be performed directly on the device used for data collection or on a server system. The choice of the platform for model generation depends on the target users of the system. A single-user activity recognition utilizes on the phone model generation while a system designed for large user population will employ off-the-phone model derived from large pool of data from many users to induce a more generalised model. While the generalised is prone to inaccurate recognition due to differences in users characteristics, single-user model based on each user data results in duplication of efforts. This is why model adaptation is a paramount issue in activity recognition.
B. Sensors for Activity Recognition
Sensors are crucial components in context recognition. There are many types of sensors that are being used in context and activity recognition. Sensors can be used singly to recognize a particular kind of activity or combined to im-prove recognition accuracy. Multi-modal context recognition can also be done by combining sensors of different types. The choice of sensor depends on factors such as the type of
context being sensed, level of intrusiveness of the sensor, ease of use, level of recognition accuracy, availability and cost. This section presents the commonly used sensors in activity recognition which include, wearable, environment-installed and smartphone sensors. Wearable are attached to the user body e.g. 3D accelerometers, environment-installed sensors are fixed into a position in the home or office environment e.g. wireless sensor network and camera while smartphone sensors consist of many types of sensors integrated into mobile phone.
1) Inertial Sensors: These are by far the most widely used sensors for activity recognition. This stems from the fact that they are very small and can be easily carried as wearable sensors attached to the users’ body. In addition, they have low cost and are usable under different environments both indoor and outdoor to recognise ambulatory activities. 3-D accelerometers are the common inertial sensors used in activity recognition research. They are usually packaged in a compact cases and attached to the users at specific positions on their body parts, such as waist, arms, knees ankles and hips. Accelerometer measures the magnitude and direction of acceleration forces along the three axes. These values reflect the level of intensity of the force experience by the device which invariably indicates the type of activity being performed. Prior to the advent of smartphones, body-worn accelerometer are often used for activity recognition. The pioneering work of Intille and Bao [4] examined the use of sensors worn at different body parts to accurately determine physical activities. Similar works in [2], [21], [22] also focused on activity recognitions using body worn sensors.
2) Audio Sensor: The sound encountered in the surround-ing of a user while performsurround-ing an activity is a good clue to the kind of activities. Audio based sensing is useful for recognizing high level activities of daily living such as driving and vacumming the floor by extracting characteristics sounds associated with such activities. Stork et al. [23] pre-sented a microphone based system that is able to recognize 22 different sounds corresponding to a number of human activities in a bathroom and kitchen context. They extracted mel-frequency ceptral coefficients (MFCC) from sound sam-ples and applied segmentation free approach that yielded a recognition rate of over 85%. Another work presented by Zhan and Kuroda [3] employed Haar-like sound features with HMM to recognize 22 different activities related to personal (e.g. vaccum cleaning, shaving, drinking, etc.) and social activities ( shopping or outside dining). They claim an average accuracy of 97% given their laboratory settings. Although, the use of audio for activity recognition is yielding promising results as reported in the cite work above, the major challenges in real world situations are the occlusions produced by background noise which could hinder the recog-nition of pre-trained sound from noise polluted sounds in the environment. Another limitation is that sound cannot be used to recognize some activities (e.g. ambulation and sport activities) since they do not produce characteristics sound to discern their audio patterns.
3) Image Sensor: Use of camera for activity recognition has been studies extensively in the literature. There are two main approaches to recognising human actions from video i) a direct recognition of human action form video
IAENG International Journal of Computer Science, 43:1, IJCS_43_1_15
sequences ii) inferring the actions through observation of phenomenons such as location and object in the environment of the user. The former is often hard to achieve due to variations in motion, recording settings and inter-personal differences [24], [25]. The latter approach is more practical and are often used in recognising activity of daily living in the context of elderly home to monitor the inhabitant activity. For example, Duong et al. [26] presented a work that install multiple cameras in a room which observes a user performing different actions. The room is divided into regions of squares with different objects of interest in each regions. The list of visited regions is used to infer the action being performed by the user such as watching television. The major limitation of image sensor is that they can only observe activity of objects within the vicinity of their installed location. They are not pervasive enough to recognise activity of a user outside their vicinity.
4) Object Use through Wireless Sensor Network and RFID: Other approach for capturing data to infer users’ activities is through their interaction and contact with some sensors in their environment. AR is performed with wireless sensor network by connecting them to objects that people are supposed to interact with inside smart homes. The sensor node ca be equipped with various types of sensors such as contact switches, pressure mats, mercury contacts, passive infrareds sensors, humidity sensors and temperature sensors. Data from these sensors can indicate activities such as sleeping using pressure mats sensors, bathing using humidity sensors in the bathroom, cooking using temperature sensors in the kitchen and in-the-room using contact sensors [27], [28]. Similarly, RFID (Radio frequency identification) is also used by attaching tags to objects in the house, and users with RFID reader which can read information stored in those tags. The activity is inferred based on the tag information on the objects interacted with by the user. Philipose et al. [29] implemented an activity recognition that attached RFID tags with objects and user with a glove embedded with RFID readers to recognise their activities.
5) Physiological and Vital Signs Sensors: These cate-gories of sensors are used to infer activities by sensing physiological parameters that indicates intensity of the ac-tions being performed by the wearer of the device. Vital signs data such as ECG (electrocardiogram), GSR (galvanic skin response), skin temperature, oxygen saturation etc. are being used to improve activity recognition. Parka et al. [22] examined the use of physiological sensors for activity recognition and concluded that, they did not provide more useful data for activity recognition. They observed that phys-iological signals correlate with intensity level of activities, they are not adequate enough to reflect the type of activity. This is because physiological signal react slower to activity changes. In another work, Tapia et al. [30] demonstrated an activity recognition system that combines data from hearth rate monitor and five accelerometers. They arrived at the same conclusion that physiological sensors did not respond well to activity changes. However, Lara et al. [31] assert that by performing extra feature extraction on the physiological data, they can be used to improve recognition accuracy. The main drawback of physiological sensors is their high level of intrusiveness as user has to attached the sensors to the basal skin to read the signals.
6) Smartphone Sensors: Today’s mobile phones are be-coming more and more powerful with many types of sensors packaged into them. A typical smartphone has many of the individual sensors discussed in the previous sections thereby making them a good platform to infer more fine grained user context. Incel et al. [32] presented a taxonomy of mobile phones based activity recognition.They identified three approaches of inferring activities using mobile phone to include i) location, ii ) motion and iii) hybrid phone based activity recognition. Location-driven recognition uses the location information of the users to infer their activities. The main focus was to recognise activities associated to certain places [33]. There are series of examples that can be referenced, Reality Mining Project [34] used bluetooth and cell tower data to model user location and frequent activity such as being at home, work and elsewhere . They employed HMM algorithm conditioned on the our of the day and day of th week to build a predictive model and recorded a 95% accuracy.
Motion-based Activity Recognition uses phone embedded sensors like accelerometer, gyroscope , cellular, Wi-Fi and GPS radio data from moving users to infer their activities. Accelerometer enables inference of user activity by capturing the acceleration force experienced by the device. The inten-sity of this force correlates to the inteninten-sity of the activity that is being performed. Works carried out by Bertchold et al. [35], Alvian and Muhammad [36] and many others utilised mobile phone accelerometers for recognition of activity. Sohn et al. [37] used GSM data collected by mobile phones to recognize walking, driving, stationary and daily step count activities of users. They used fingerprinting principle, where GSM observations with a stable set of towers and signal strengths are used to infer not moving and changes in the set of nearby towers and signal strengths indicate motion. Another related work presented by Anderson et al. [38] focuses tracking daily exercises activities of supporting the user to share and compare their activity levels with others. They employ an Artificial Neural Network (ANN) to analyse GSM cell signal strength and visibility. The multitude of sensors on mobile phone can allowed more fine grained context information to be inferred. Cenceme [39] draws inference from GPS, bluetooth, accelerometer and audio data to infer user context. Lane et al. [6], Alqassim et al. [40] and Natale et al. [41] utilized phone embedded sensors to infer user sleep patterns for well-being monitoring.
We can conclude that smartphones are versatile tools for performing sensing of user context at different level of details. The advantage of using smartphone sensors for activity recognition stems from the ubiquity of the phones and popularity of usage among billions of people worldwide. It is less intrusive and users would not hesitate to carry the phones with them always. As a result of this we consider smartphone as the sensor platform for our work in activity recognition.
C. Learning Techniques for Activity Recognition
The raw data gathered from sensors highlighted in the previous sections need to be processed to derived useful knowledge from them. In other to achieve this, AR systems use techniques from machine learning to generate patterns
IAENG International Journal of Computer Science, 43:1, IJCS_43_1_15
that represent knowledge derived from the data. Machine learning algorithms takes sample data (attributes and class label) and learn from them to build models that are capable of classifying unseen data to appropriate class. The approach for recognising patterns by machine learning is regarded as supervised if the sample data are given class label and unsu-pervised if the data has no sample label to serve as clue to the algorithm. In between these extremes is semi-supervised approach which learn form combinations of labelled and unlabelled data. All these approaches are being applied to activity recognition with supervised learning methods being the predominant approach. The following sections gives an overview of some of the machine learning algorithms used in activity recognition.
1) Supervised Learning Technique: Supervised learning technique captures the concepts of teaching before asking. Examples data that consist of attributes values and class labels are presented to the learning algorithms to train them. The attributes are the representative information derived from the sensory data. Class label represents the type of activity i.e walking or running, being carried out while the data is captured. The algorithms learn from these data and generate classification models that can take an unseen data without label and classify them into one of the class labels already seen. Supervised learning is also refereed to as classification problems. Some of the commonly used algorithms includes Naive Bayes, K-Nearest Neighbour (KNN), Support Vector Machine (SVM), Artificial Neural Network (ANN), Hidden Markov Model (HMM) and Decision trees. Their descrip-tions are succinctly given below.
• Decision trees utilised the concepts of if then rules to build a hierarchical model in form of tree. The tree mapped its nodes to attributes in the sample data and edges to the possible attribute values. Each branch from the root to the leaf node is a classification rule. There are many variants of decision tree algorithms. Notable ones include ID3 (Iterative Dichotomiser 3), C4.5 (successor of ID3), and CART (Classification And Regression Tree). C4.5 is the most widely used implementation of decision tree. It utilised the concept of information gain to determine which attributes should be placed in the top nodes [42] and recursively builds the tree until all attributes are selected and leaf nodes are reached. Decision tree is easy to understand by humans but suffers from difficulties in obtaining a single optimal tree.
• Naive Bayes is another widely used learning algorithms
in AR. It is based on the Baye’s probability theorem [43]. To determine the class yi of an unseen data
xi∈Rn with attributesa
1, a2, ..., anand corresponding
values v1, v2, ..., vn the algorithm first computes the
prior probabilities of each classP(y1), P(y2), ..., P(yk)
from the training data. The conditional probability of the observed data given the classes yi ∈ K is also
computed with:
P(a1=v1|yi)P(a2=v2|yi)...P(an=vn|yi))
∀yi ∈ K number of classes
(4)
Finally the posterior probability of the most probable classy, out of all possible classesK to be assigned to
the instancexi is obtained from:
c=argmaxyi∈K
P(yi)P(a1 =v1|yi)P(a2 =v2|yi)...P(an=vn|yi)
KP
i=1P(yi)P(a1 =v1|yi)P(a2 =v2|yi)...P(an=vn|yi)
(5)
The denominator is called the marginal probability or the normalizer. Naive Bayes algorithm is easier to use with categorical attributes. If the attributes are continu-ous as in the case of most sensor data, a pre-processing step is required to discretized the data.
• K-nearest neighbour is an instance based learning
tech-nique [44]. It works by comparing unseen instance with all instances in the data set using a distance function. K nearest training data to the unseen instance is selected and the class labels of the majority of the k points is used as the class of the unseen instance.
• Hidden Markov Model (HMM) models the situation in which a set of emissions sequence is observed without knowing the sequence of states the model went through to generate such emissions. In the context of AR, the observable emission sequence are the features derived from accelerometer data and the state are the activity classes. HMM is trained by determining state transition and the probabilities that each set of observation is observed form a given sate. This probability is then used to classify new instances.
• Support Vector Machine learning method finds optimal
decision boundary with highest margin between patterns of each class by utilising kernel functions to project all instances to a higher dimensional space. The result is a partition of the dataset to classes present in them.
2) Semi-supervised Technique: Semi-supervised learning technique employed both labelled and unlabelled data to induce classification model that recognise activity. The small amount of labelled data are used initially to train a model or set of model, to enhance the accuracy over time new unlabelled data that comes for identification are added using different scheme such as prediction level accuracy, majority voting among set of classifiers and challenge user to confirm or contradict the classification output. In all circumstances, new data are added after the most accurate label has been inferred. Examples of include entraining, democratic co-learning. Longstaff et al. [45] investigated these algorithms in a study of activity recognition with mobile phone.
3) Unsupervised Technique: While supervised technique requires label data to generate recognition model, unsuper-vised methods attempts to find patterns in the unlabelled data automatically without prior training. The algorithms finds patterns in terms of clusters that groups the data to corresponding activities, or generate a distribution functions that estimate the patterns in the data.
III. METHODOLOGY
A. Data Collection Procedure
We collected smartphone accelerometer data with a mod-ule of our application that sampled sensor data on a Sony Xperia E 1505 smartphone. The phone has Qualcomm MSM7227A 1 GHzprocessor codenamed Snapdragon. It also has 1000MB of RAM, 1530mAh battery and runs Android 4.1.1 Jelly Bean. Each data point from the phone’s accelerometer sensor consists of three axes x, y, z values. These values represent the motion components along each
IAENG International Journal of Computer Science, 43:1, IJCS_43_1_15
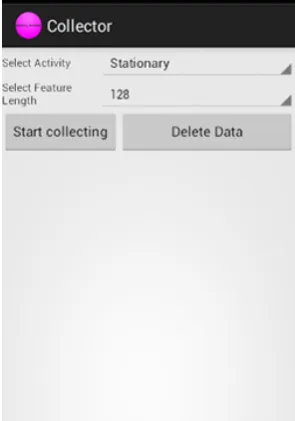
axis. Figure 2 shows the data collection application. The interface allowed the selection of absolute window length and the activity label of the current data collection session.
Fig. 2. Data Collection Interface
To elicit the effect of sensor data window length and the amount of training data on the accuracy and time required for training the selected algorithms on a mobile phone, we performed the data collection in three phases for each defined window length. We have 32, 64 and 128 window lengths. For a given window length, we collect 1 minute of data for each activity to form the first data set, followed by another 30 seconds of data for each activity to form the second dataset and an additional 30 seconds worth of data to form the third data set. We repeated this process for each of the defined window length for each activity performed by the user. When users launch the application, they are presented with a screen for selecting the vector size and the activity class they are about to perform. Upon initializing the capture process, the user put the phone into the pants pocket and starts performing the selected activity. We selected pants pocket because other studies [46], [10], [47] have established this to be the most suitable position to record the impacts of user movements on the accelerometer sensor. An Android service is started that asynchronously performs sensor sampling, feature extraction and storage into a file within a background thread.
B. Feature Extraction
This stage is performed by extracting features from the raw time series x, y, z accelerometer values. Figure 3 shows the process for sampling the accelerometer sensor and extracting the features. The sampling rate of the accelerometer is set to the Android provided constant that gets the sensor data as fast as possible. Orientation effects on the data are eliminated by computing the magnitude of x, y, z components of each accelerometer data. A combination of fixed amount of this magnitude values i.e. 32, 64 or 128 are combined into a vector. This time series sample stored in a vector array of real value is converted to frequency domain samples of the same length by making use of Fast Fourier Transform (FFT) algorithm computation of Discrete Fourier Transform (DFT).
The FFT computation is based on the decimation-in-time radix 2 algorithm.
Fig. 3. Sensor Sampling Pipeline
C. Training and Model Induction
The training and evaluation of the classifier models are performed directly on a mobile phone. The algorithms tested are from Weka implementation [48]. They were easy to incorporate into our application since the Weka API are available in Java and we used Java to develop our An-droid application. All the Weka classification algorithms are grouped into the base package called weka.classfier and each sub-group of the algorithms were further grouped into sub-packages. For example, all the rules based al-gorithms are in weka.classifier.rules. A specific algorithm from this can then be invoked by instantiating an ob-ject of a specific class such as weka.classifier.rules.PART, weka.classifier.rules.DecisionTable and so on.
IV. RESULTS ANDDISCUSSION
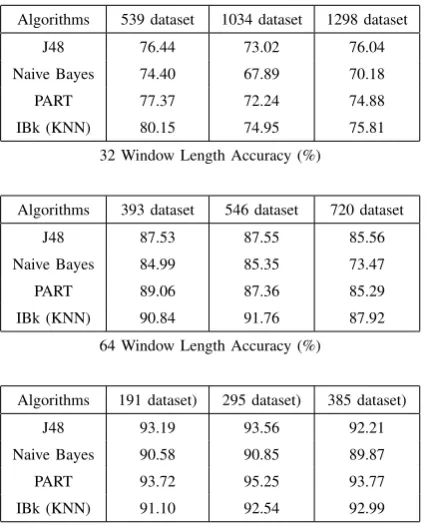
The accuracy of the algorithms and time taken to train and evaluate them on the mobile phone are presented in this section. The amount of data collected within the allocated period for collections vary according to the size of sensor data window length. Of the three windows, 32 rapidly collect more data follow by 64 and 128 window lengths. It has been shown that a small amount of 3 seconds worth of personal data from an accelerometer is adequate to induce a personalised model on a mobile phone [15],[12], therefore our data collection is performed in 30 seconds interval for each window length under consideration. Table II shows the data collected with each feature length settings and the accuracies obtained for the four algorithms.
The accuracies are recorded separately for the 32, 64 and 128 sensor data window lengths in the table from top to bottom respectively.
Similarly, table III shows the time taken to train and perform a 10 fold cross validations on each of the algorithms giving the varying dataset sizes and the window lengths shown from top to bottom in the table.
The data collection session is carried out in three phases across all the window lengths. We first collect 1 minute worth of data for each activity class making a total of 4 minutes for the four activities of walking, running, stationary and
IAENG International Journal of Computer Science, 43:1, IJCS_43_1_15
TABLE II
ACCURACY OF THEFOURALGORITHMS WITHVARYINGDATASETSIZES ANDWINDOWLENGTHS
Algorithms 539 dataset 1034 dataset 1298 dataset
J48 76.44 73.02 76.04
Naive Bayes 74.40 67.89 70.18
PART 77.37 72.24 74.88
IBk (KNN) 80.15 74.95 75.81
32 Window Length Accuracy (%)
Algorithms 393 dataset 546 dataset 720 dataset
J48 87.53 87.55 85.56
Naive Bayes 84.99 85.35 73.47
PART 89.06 87.36 85.29
IBk (KNN) 90.84 91.76 87.92
64 Window Length Accuracy (%)
Algorithms 191 dataset) 295 dataset) 385 dataset)
J48 93.19 93.56 92.21
Naive Bayes 90.58 90.85 89.87
PART 93.72 95.25 93.77
IBk (KNN) 91.10 92.54 92.99
128 Window Length Accuracy (%)
TABLE III
TRAINING ANDEVALUATIONTIME ON THEFOURALGORITHMS
Algorithms 539 dataset 1034 dataset 1298 dataset
J48 29972 72467 96362
Naive Bayes 6935 13382 17412
PART 54876 248914 314477
IBk (KNN) 4780 14259 23231
32 Window Length Time (ms)
Algorithms 393 dataset) 546 dataset) 720 dataset)
J48 25617 36616 62559
Naive Bayes 11643 13873 18437
PART 45422 72994 143199
IBk (KNN) 5387 9483 15532
64 Window Length Time (ms)
Algorithms 191 dataset) 295 dataset) 385 dataset)
J48 16425 25893 39677
Naive Bayes 9246 14231 18583
PART 28253 52661 82132
IBk (KNN) 4089 8479 13263
128 Window Length Time (ms)
jumping. This data is then used to train and evaluate the four algorithms under consideration and the result is recorded. Another 30 seconds worth of data is collected in the second and third phase for each activity and the model training and testing were performed. These procedure was repeated for
each data window length to obtain the results.
According to the results in the first part of table II, the overall classification accuracy rate of 80.15% is obtained from IBk algorithm for the 32 window length using the first dataset. PART, J48 and Naive Bayes algorithms accuracies range between 74-77%. However, while we expect the accu-racies of all the algorithms to increase with additional data, their accuracies degrade with more data in datasets 2 and 3 although the accuracies obtained in dataset 3 are better than those of the second dataset. We opine that the decrease in the accuracies with additional data is caused by the non-discerning information in the small window length.
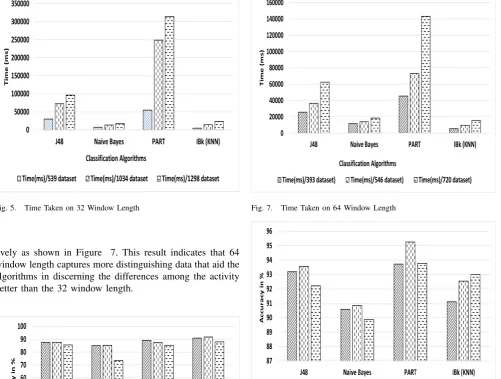
Moreover, we can see that IBk outperforms all the other algorithms across the three datasets except for the J48 that slightly outperforms it in the third dataset. The performance of IBk can be attributed to the nature of the data that are very correlated and since IBk is an instance based algorithm it is able to leverage this to discern the closeness in the data samples. The assumption of Naive Bayes on the independence of each feature makes it perform worse on all the dataset because the feature instances are dependent on each other. Figure 4 and 5 show the relative performance of the algorithms and the time taken to train the models for the 32 window length. As indicated in Figure5, IBk takes the smallest amount of time across all the three datasets during training and evaluation. This is understandable because it does not build a model from the data and the dimension of each data sample is manageable for comparison operation inherent in the IBk algorithm. This result indicates that 32 window length does not enable the algorithms to benefit from incremental update in terms of adding more training data.
Fig. 4. Accuracy of 32 Window Length
The 64 window length results as shown in middle part of table II have IBk as the most accurate and least time consuming to train and evaluate. Unlike the 32 window length whose performance degrades across all the algorithms in dataset 2 and 3, the 64 window length accuracy slightly increases for all the algorithms in dataset 2 except for the PART which decreases slightly as captured in Figure 6. However, the increase does not extend to the third dataset. IBk takes the minimal amount of time during training and evaluation followed by Naive Bayes, J48 and PART
respec-IAENG International Journal of Computer Science, 43:1, IJCS_43_1_15
Fig. 5. Time Taken on 32 Window Length
tively as shown in Figure 7. This result indicates that 64 window length captures more distinguishing data that aid the algorithms in discerning the differences among the activity better than the 32 window length.
Fig. 6. Accuracy of 64 Window Length
The 128 window length gives the best accuracies across all the algorithms as indicated in Figure 9 and bottom part of table III. The training time is also minimal compared to other window lengths. We can attribute this to the relatively smaller amount of data set collected within the same period for other window This shows that it takes more time to collect more data with long window length but the training time of the algorithm depends on the amount of data samples. Invariably, the long window length captures information that is more discerning and thereby enables the algorithms to perform better on the recognition task. As indicated in Figure 9, the highest time for the 128 window length is below 90000ms compared to 32 window length with 300000ms (Figure 5) and 140000ms for the 64 window length (Figure 7).
Fig. 7. Time Taken on 64 Window Length
Fig. 8. Accuracy on 128 Window Length
‘
Fig. 9. Time Taken on 128 Window Length
V. ACTIVITYRECOGNITIONAPPLICATION
Based on the experimental results from the preceding section, we implemented an activity recognition application
IAENG International Journal of Computer Science, 43:1, IJCS_43_1_15
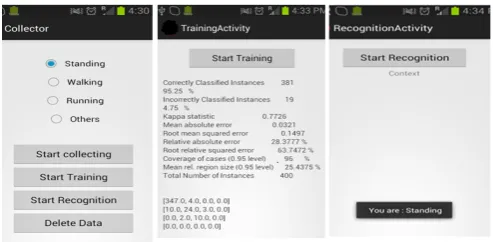
that has three major components namely: (i) Data collection (ii) Online training (iii) Online recognition. We collected data from the accelerometer sensor on a Sony Xperia E 1505 smartphone. The data collection component collects labelled data from a user who performed the walking, running and stationary activities. The application first prompts the user to select an activity from the list. The user puts the phone into the pant’s pocket and starts performing the selected activity. The application then begins to collect the accelerometer data and use the user input as the label. Each data point from the phones accelerometer sensor consists of three axes x, y, z values. These values represent the motion components along each axis. To eliminate the effect of phone orientation and position on the values, we computed their magnitude. For each 64 samples collected, their magnitudes are stored in a vector array of real values and then converted to frequency domain samples of the same length by making use of Fast Fourier Transform (FFT) algorithm. Each instance generated this way is labelled with a nominal value of the activity being performed. The data is then stored in a file on the device as an attribute relation file format (arff). Figure 10 shows the application interface.
Fig. 10. Activity Recognition Application Interface
Although IBK gives the best results from the experiment, we utilized J48 classifier because it does not need to keep the training data during recognition unlike IBk which requires the presence of all the training data. J48 classifier is able to build a model from the training data and the data can be discarded while the model is saved for later use to recognise new unseen instances.
The online recognition stage is implemented with an Android service component, which runs in the background to continuously sample the accelerometer data. Unlabelled instances are generated from the raw accelerometer readings similar to the data collection stage. The initial model is then used to classify the generated instances and the results of the classification are displayed to the user.
Resource usage in terms of CPU and memory utilization during the online recognition is presented in Table IV. We can see that the resource usage is similar to other typical applications often used regularly by users. For example, note editor and camera for taking note and pictures on the go respectively utilised comparable amount of memory as our application. However, CPU usage is higher than the other applications. This can be attributed to the CPU usage of the background service that samples data from the accelerometer hardware continuously.
TABLE IV
RESOURCEUSAGE FORRECOGNITION WITHBENCHMARK APPLICATIONS
CPU Usage Memory Usage
Recognition Phase 3.4% 9.19MB
Benchmark application
NOTE APPLICATION 1.1% 9.74MB
CAMERA APPLICATION 1.1% 8.25MB
VI. CONCLUSION
From the analysis presented above, it is clear that 128 window length yields the best result for all the algorithms tested and required the least amount of time to train and evaluate. The reduced training time can be attributed to the small amount of samples collected within our defined time. However, since this is the same time used for other window lengths, it implies that its performance over them is justifiable. In terms of accuracy of the algorithms, IBk is the best on the average, followed by PART, J48 and Naive Bayes respectively. Nevertheless, the time requirements of PART is the highest followed by J48, Naive Bayes and IBk. The performance of IBk has been reported in other previous work for online activity recognition task [2], [14]. None of the algorithms shows any significant increase in accuracy with additional data suggesting that they are not amenable to incremental update. With these results, we can conclude that the more the window length the better the discerning information they contain for the accurate performance of classification algorithm. Also, while it takes longer time to collect large data samples for long window length, the length of the window does not have a significant impact on the training and evaluation time of the algorithm. The sample size has more effect on the training time. In addition, the results also show that a minimal amount of personal data is adequate to recognize activity of a user. The main issue with collecting personal data is the duplication of efforts for all users.
With these results in mind, the issues of personalised recognition on a mobile device will be given attention to develop algorithm to solve the problem. Such algorithm should eliminate user burden and perform an automatic adaptation to reflect changes in individual activity data.
REFERENCES
[1] W. Khan, Y. Xiang, M. Aalsalem, and Q. Arshad, “Mobile phone sensing systems: A survey,”Communications Surveys Tutorials, IEEE, vol. 15, no. 1, pp. 402–427, 2013.
[2] U. Maurer, A. Smailagic, D. P. Siewiorek, and M. Deisher, “Activity recognition and monitoring using multiple sensors on different body positions,” in International Workshop on Wearable and Implantable Body Sensor Networks, 2006. BSN 2006. IEEE, 2006, pp. 4–pp. [3] Y. Zhan and T. Kuroda, “Wearable sensor-based human activity
recog-nition from environmental background sounds,” Journal of Ambient Intelligence and Humanized Computing, vol. 5, no. 1, pp. 77–89, 2014. [4] L. Bao and S. S. Intille, “Activity recognition from user-annotated acceleration data,” inPervasive computing. Springer, 2004, pp. 1– 17.
[5] M. Shoaib, S. Bosch, O. D. Incel, H. Scholten, and P. J. Havinga, “A survey of online activity recognition using mobile phones,”Sensors, vol. 15, no. 1, pp. 2059–2085, 2015.
IAENG International Journal of Computer Science, 43:1, IJCS_43_1_15
[6] N. D. Lane, M. Mohammod, M. Lin, X. Yang, H. Lu, S. Ali, A. Doryab, E. Berke, T. Choudhury, and A. Campbell, “Bewell: A smartphone application to monitor, model and promote wellbeing,” in
5th International ICST Conference on Pervasive Computing Technolo-gies for Healthcare, 2011, pp. 23–26.
[7] E. Miluzzo, N. D. Lane, K. Fodor, R. Peterson, H. Lu, M. Musolesi, S. B. Eisenman, X. Zheng, and A. T. Campbell, “Sensing meets mobile social networks: the design, implementation and evaluation of the cenceme application,” inProceedings of the 6th ACM conference on Embedded network sensor systems. ACM, 2008, pp. 337–350. [8] K. Partridge and B. Begole, “Activity-based advertising techniques and
challenges,” inProceedings of Workshop on Pervasive Advertising, 2009.
[9] S. A. Bashir, D. C. Doolan, and A. Petrovski, “The impact of feature vector length on activity recognition accuracy on mobile phone,” in
Lecture Notes in Engineering and Computer Science: Proceedings of The World Congress on Engineering 2015, WCE 2015, London, U.K, vol. 1, 1-3 July 2015, pp. 332–337.
[10] Y. E. Ustev, O. Durmaz Incel, and C. Ersoy, “User, device and orientation independent human activity recognition on mobile phones: challenges and a proposal,” in Proceedings of the 2013 ACM con-ference on Pervasive and ubiquitous computing adjunct publication. ACM, 2013, pp. 1427–1436.
[11] M. A. Ayu, S. A. Ismail, A. F. A. Matin, and T. Mantoro, “A compar-ison study of classifier algorithms for mobile-phone’s accelerometer based activity recognition,”Procedia Engineering, vol. 41, pp. 224– 229, 2012.
[12] G. M. Weiss and J. W. Lockhart, “The impact of personalization on smartphone-based activity recognition,” inAAAI Workshop on Activity Context Representation: Techniques and Languages, 2012.
[13] N. D. Lane, Y. Xu, H. Lu, S. Hu, T. Choudhury, A. T. Campbell, and F. Zhao, “Enabling large-scale human activity inference on smart-phones using community similarity networks (csn),” inProceedings of the 13th international conference on Ubiquitous computing. ACM, 2011, pp. 355–364.
[14] M. Kose, O. D. Incel, and C. Ersoy, “Online human activity recognition on smart phones,” inWorkshop on Mobile Sensing: From Smartphones and Wearables to Big Data, 2012, pp. 11–15.
[15] J. B. Gomes, S. Krishnaswamy, M. M. Gaber, P. A. Sousa, and E. Menasalvas, “Mars: a personalised mobile activity recognition system,” in 13th IEEE International Conference on Mobile Data Management (MDM), 2012. IEEE, 2012, pp. 316–319.
[16] J. Yang, H. Lu, Z. Liu, and P. P. Boda, “Physical activity recognition with mobile phones: challenges, methods, and applications,” in Mul-timedia Interaction and Intelligent User Interfaces. Springer, 2010, pp. 185–213.
[17] J. Yang, “Toward physical activity diary: motion recognition using simple acceleration features with mobile phones,” inProceedings of the 1st international workshop on Interactive multimedia for consumer electronics. ACM, 2009, pp. 1–10.
[18] J. L¨otters, J. Schipper, P. Veltink, W. Olthuis, and P. Bergveld, “Procedure for in-use calibration of triaxial accelerometers in medical applications,”Sensors and Actuators A: Physical, vol. 68, no. 1, pp. 221–228, 1998.
[19] O. D. Lara and M. A. Labrador, “A survey on human activity recog-nition using wearable sensors,”Communications Surveys & Tutorials, IEEE, vol. 15, no. 3, pp. 1192–1209, 2013.
[20] S. J. Preece, J. Y. Goulermas, L. P. Kenney, and D. Howard, “A comparison of feature extraction methods for the classification of dynamic activities from accelerometer data,”IEEE Transactions on Biomedical Engineering, vol. 56, no. 3, pp. 871–879, 2009. [21] S.-W. Lee and K. Mase, “Activity and location recognition using
wearable sensors,”IEEE Pervasive Computing, vol. 1, no. 3, pp. 24– 32, 2002.
[22] J. Parkka, M. Ermes, P. Korpipaa, J. Mantyjarvi, J. Peltola, and I. Ko-rhonen, “Activity classification using realistic data from wearable sen-sors,”IEEE Transactions on Information Technology in Biomedicine, vol. 10, no. 1, pp. 119–128, 2006.
[23] J. Stork, L. Spinello, J. Silva, and K. Arras, “Audio-based human activity recognition using non-markovian ensemble voting,” in RO-MAN, 2012 IEEE, Sept 2012, pp. 509–514.
[24] V. K. Thomas B. Moeslund, Adrian Hilton, “A survey of advances in vision-based human motion capture and analysis.”Computing Visual Image Understanding, vol. 2, no. 104, pp. 90–126, 2006.
[25] R. Poppe, “A survey on vision-based human action recognition,”Image and Vision Computing, vol. 6, no. 28, pp. 976–990, June 2010. [26] D. Q. P. S. V. p. Thi V. Duong, Hung H. Bui, “Activity recognition and
abnormality detection with the switching hidden semi-markov model.” inProceedings of IEEE Computer Society Conference on Computer Vision and Pattern Recognition (CVPR). San Diego, CA, USA,: IEEE, June 2005, p. 838845.
[27] T. Van Kasteren, A. Noulas, G. Englebienne, and B. Kr¨ose, “Accurate activity recognition in a home setting,” in Proceedings of the 10th international conference on Ubiquitous computing. ACM, 2008, pp. 1–9.
[28] C. R. Wren and E. M. Tapia, “Toward scalable activity recognition for sensor networks,” inLocation-and context-awareness. Springer, 2006, pp. 168–185.
[29] M. Philipose, K. P. Fishkin, M. Perkowitz, D. J. Patterson, D. Fox, H. Kautz, and D. Hahnel, “Inferring activities from interactions with objects,”Pervasive Computing, IEEE, vol. 3, no. 4, pp. 50–57, 2004. [30] E. M. Tapia, S. S. Intille, W. Haskell, K. Larson, J. Wright, A. King, and R. Friedman, “Real-time recognition of physical activities and their intensities using wireless accelerometers and a heart monitor,” in
Proceeding of International Symposium on Wearable Comp. Citeseer, 2007.
[31] ´O. D. Lara, A. J. P´erez, M. A. Labrador, and J. D. Posada, “Centinela: A human activity recognition system based on acceleration¡ i¿ and¡/i¿ vital sign data,”Pervasive and mobile computing, vol. 8, no. 5, pp. 717–729, 2012.
[32] O. D. Incel, M. Kose, and C. Ersoy, “A review and taxonomy of activity recognition on mobile phones,”BioNanoScience, vol. 3, no. 2, pp. 145–171, 2013.
[33] D. Choujaa and N. Dulay, “Activity recognition using mobile phones: achievements, challenges and recommendations,” inProceedings of the Workshop on How To Do Good Research in Activity Recognition: Ex-perimental Methodology, Performance Evaluation and Reproducibility in Conjunction with UBICOMP, 2010.
[34] N. Eagle and A. Pentland, “Reality mining: sensing complex social systems,”Personal and ubiquitous computing, vol. 10, no. 4, pp. 255– 268, 2006.
[35] M. Berchtold, M. Budde, D. Gordon, H. Schmidtke, and M. Beigl, “Actiserv: Activity recognition service for mobile phones,” in Wear-able Computers (ISWC), 2010 International Symposium on, Oct 2010, pp. 1–8.
[36] I. Schweizer, C. Meurisch, J. Gedeon, R. B, and M. M, “Noisemap: multi-tier incentive mechanisms for participative urban sensing,” in
Proceedings of the Third International Workshop on Sensing Applica-tions on Mobile Phones, ser. PhoneSense ’12. New York, NY, USA: ACM, 2012, pp. 9:1–9:5.
[37] T. Sohn, A. Varshavsky, A. LaMarca, M. Y. Chen, T. Choudhury, I. Smith, S. Consolvo, J. Hightower, W. G. Griswold, and E. De Lara, “Mobility detection using everyday gsm traces,” inUbiquitous Com-puting. Proceedings of UbiComp 2006. Springer, 2006, pp. 212–224. [38] I. Anderson, J. Maitland, S. Sherwood, L. Barkhuus, M. Chalmers, M. Hall, B. Brown, and H. Muller, “Shakra: tracking and sharing daily activity levels with unaugmented mobile phones,” Mobile Networks and Applications, vol. 12, no. 2-3, pp. 185–199, 2007.
[39] E. Miluzzo, N. D. Lane, K. Fodor, R. Peterson, H. Lu, M. Musolesi, S. B. Eisenman, X. Zheng, and A. T. Campbell, “Sensing meets mobile social networks: the design, implementation and evaluation of the cenceme application,” inProceedings of the 6th ACM conference on Embedded network sensor systems. ACM, 2008, pp. 337–350. [40] S. Alqassim, M. Ganesh, S. Khoja, M. Zaidi, F. Aloul, and A.
Sagahy-roon, “Sleep apnea monitoring using mobile phones,” in e-Health Networking, Applications and Services (Healthcom), 2012 IEEE 14th International Conference on. IEEE, 2012, pp. 443–446.
[41] V. Natale, M. Drejak, A. Erbacci, L. Tonetti, M. Fabbri, and M. Mar-toni, “Monitoring sleep with a smartphone accelerometer,”Sleep and Biological Rhythms, vol. 10, no. 4, pp. 287–292, 2012.
[42] J. R. Quinlan, C4.5: programs for machine learning. Morgan Kaufman, 1993, vol. 1.
[43] M. Bramer,Principles of data mining. Springer, 2013.
[44] I. H. Witten and E. Frank,Data Mining: Practical machine learning tools and techniques. Morgan Kaufmann, 2005.
[45] B. Longstaff, S. Reddy, and D. Estrin, “Improving activity classi-fication for health applications on mobile devices using active and semi-supervised learning,” in4th International Conference on Perva-sive Computing Technologies for Healthcare (PervaPerva-siveHealth), 2010. IEEE, 2010, pp. 1–7.
[46] P. Siirtola and J. R¨oning, “Recognizing human activities user-independently on smartphones based on accelerometer data,” Inter-national Journal of Interactive Multimedia and Artificial Intelligence, vol. 1, no. 5, 2012.
[47] S. Reddy, M. Mun, J. Burke, D. Estrin, M. Hansen, and M. Srivastava, “Using mobile phones to determine transportation modes,” ACM Transactions on Sensor Networks (TOSN), vol. 6, no. 2, p. 13, 2010. [48] M. Hall, E. Frank, G. Holmes, B. Pfahringer, P. Reutemann, and I. H. Witten, “The weka data mining software: an update,”ACM SIGKDD explorations newsletter, vol. 11, no. 1, pp. 10–18, 2009.