Optimization and Statistical Analysis of
Machining Parameters for Tool Wear Rate
on EN-19 Alloy Steel
Manish Vishwakarma
Mechanical Engineering Department, M.A.N.I.T, Bhopal-51 (India) [email protected]
www.manit.ac.in
Vishal Parashar
Mechanical Engineering Department, M.A.N.I.T, Bhopal-51 (India) [email protected]
www.manit.ac.in
V.K.Khare
Mechanical Engineering Department, M.A.N.I.T, Bhopal-51 (India) [email protected]
www.manit.ac.in
Abstract
In this paper, an attempt has been made to machine the EN-19 alloy steel by using rectangular shaped copper electrode perform on electrical discharge machine. This work attempts to investigate the effects of input current, pulse on time, duty cycle, voltage gap and flushing pressure on electrode wear rate (EWR) of EN-19 alloy steel in EDM using copper electrode. A regression model for the electrode wear rate has been developed to develop relation between input and responses. Design of experiments and response surface methodology techniques are implemented. The validity of test of fit and adequacy of the proposed models has been carried out through analysis of variance. Results shows that as the input current increases the electrode wear rate decreases till certain limit and then increases. The result leads to minimum electrode wear rate and economical machining by optimization of input parameters by response surface optimization.
Keywords: EWR, Central composite design, ANOVA
1. Introduction
In this work, the machining phenomena in the electrical discharge machining (EDM) process are investigated through five level factorial design method in which we take five suitable input parameters through which the electrode wear rate is calculated. The aim of this study is to understand the effect of these input operating parameter on output parameter and to improve the electrode wear rate. The Electric discharge machining has extensive applications for manufacturing dies and tools to produce mouldings, die casting, and sheet metal dies etc [1][2].Implementation of EDM process will awaken manufacturing engineers, product designers, tool engineer and metallurgical engineers about unique capabilities and benefits of this process[3].EDM can be used for machining of high precision of all type of conductive material (metals, alloys, graphite, ceramics etc.) of any hardness. This paper presents work on machining by EDM for EN-19 alloy steel. Certain parameters in EDM process directly influence the process outputs. Setting appropriate values for such parameters requires the implementation of many machining trials. This leads to time consuming and expensive experimental work. Response Surface Methodology (RSM) has been used for modelling EDM machining of rectangular slot size 15 mm x 20 mm on EN-19 material using copper electrode tool [5, 6-9].
2. Experimental work
The material used for this work is EN-19 alloy steel square plate of size 100mm x 100mm x 20mm with density 7.85 g/cm3. The specimen is machined on conventional milling at depth of cut 0.25 mm to produce a plane surface. Copper electrodes (99.97% pure, density 8.96 g/cm3 and melting point of 1086 ◦C), parallelepiped shaped 20mm x 15mm 100mm is used in the experiment. The machine used is ENC EDM Microcut make with NC control in Z-direction with EDM oil as dielectric medium.
3. Experimental plan
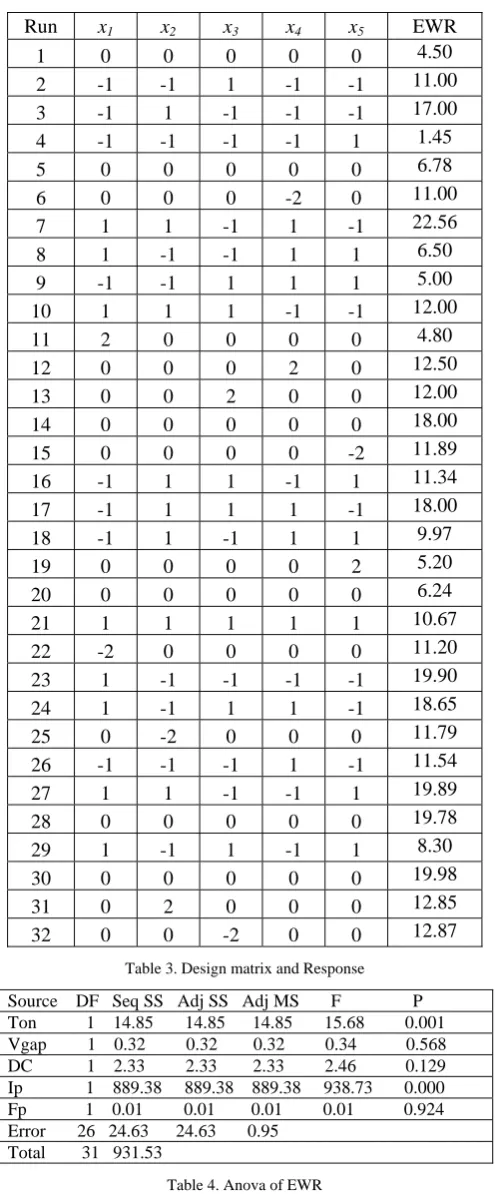
Experiments are planned on the basis of RSM technique used in experimental design. The codes are calculated as functions of the range of interest of each factor as shown in Table 1. A central composite design with five input variables having five levels between (β =±2) coded values and 32 experimental runs were performed. Different variables represented by x1, x2, x3, x4, x5 and their levels are given in Table 2.The coded numbers for the
variables used in tables are obtained from the following relationship[12] :
Code Actual Value of variable
-β xmin
-1 [(xmax + xmin)/2] – [(xmax – xmin)/2α]
0 [(xmax + xmin)/2
+1 [(xmax + xmin)/2] + [(xmax – xmin)/2α]
β xmax
Table 1. Relationship between coded & actual values of variables [12]
The numbers of test required are chosen with the standard 2k full factorial central composite design. CCRd provides as much as information as a five level factorial, requires many fewer tests and has been shown to be sufficient to describe the majority of process responses [13, 14,15].Each experiment is performed using copper electrode, with a particular set of input parameters chosen randomly from the planned set of experiments. The polarity of the electrode is set as negative. The depth of machining is set at 2mm for all sets of experiments.
Factor Level
-2 -1 0 1 2
x1 10 30 50 70 90
x2 6 9 12 15 18
x3 3 4 5 6 7
x4 5 15 25 35 45
x5 0.1 0.2 0.3 0.4 0.5
Table 2. Coded levels
4. Regression Modelling and analysis
According to the experimental plan a total of 32 experiments are conducted, each having the combination of various values of process variables x1, x2, x3, x4, x5. Each of the responses is fitted into a linear equation
represented by:
Y (EWR) = β0 +β1x1+ β2x2 + β3x3+ β4x4 + β5x5--- (1)
Where, Y is the response and x1, x2, x3, x4, x5 are coded levels of the variables. The coefficients β0, β1, β2, β3, β4, β5
can be calculated by solving the following equation:
β = (xTx)-1 xTY--- (2)
where, βis the matrix of parameter estimates, x is the matrix of independent variables, xT is the transpose of X
Run x1 x2 x3 x4 x5 EWR
1 0 0 0 0 0 4.50 2 -1 -1 1 -1 -1 11.00 3 -1 1 -1 -1 -1 17.00 4 -1 -1 -1 -1 1 1.45 5 0 0 0 0 0 6.78 6 0 0 0 -2 0 11.00 7 1 1 -1 1 -1 22.56 8 1 -1 -1 1 1 6.50 9 -1 -1 1 1 1 5.00 10 1 1 1 -1 -1 12.00 11 2 0 0 0 0 4.80 12 0 0 0 2 0 12.50 13 0 0 2 0 0 12.00 14 0 0 0 0 0 18.00 15 0 0 0 0 -2 11.89 16 -1 1 1 -1 1 11.34 17 -1 1 1 1 -1 18.00 18 -1 1 -1 1 1 9.97 19 0 0 0 0 2 5.20 20 0 0 0 0 0 6.24 21 1 1 1 1 1 10.67 22 -2 0 0 0 0 11.20 23 1 -1 -1 -1 -1 19.90 24 1 -1 1 1 -1 18.65 25 0 -2 0 0 0 11.79 26 -1 -1 -1 1 -1 11.54 27 1 1 -1 -1 1 19.89 28 0 0 0 0 0 19.78 29 1 -1 1 -1 1 8.30 30 0 0 0 0 0 19.98 31 0 2 0 0 0 12.85 32 0 0 -2 0 0 12.87
Table 3. Design matrix and Response
Source DF Seq SS Adj SS Adj MS F P Ton 1 14.85 14.85 14.85 15.68 0.001 Vgap 1 0.32 0.32 0.32 0.34 0.568 DC 1 2.33 2.33 2.33 2.46 0.129 Ip 1 889.38 889.38 889.38 938.73 0.000 Fp 1 0.01 0.01 0.01 0.01 0.924 Error 26 24.63 24.63 0.95
Total 31 931.53
Table 4. Anova of EWR
Empirical models are fitted for the stated responses material removal rate. Analysis of variance is carried out on all the fitted models for a confidence level of 95%. The fitted model of material removal rate is given by Eq. (3) and its analysis of variance is in Table 4.
EWR = - 3.19 + 0.0393 Ton - 0.0383 Vgap - 0.312 DC + 0.609 Ip + 0.19 Fp--- (3)
constant variance Figure 1 of residuals. The quantitative test methods mentioned earlier are employed again, and none of the assumptions are violated.
2 1 0 -1 -2 99 90 50 10 1 Residual Pe rc en t 24 18 12 6 0 2 1 0 -1 -2 Fitted Value Re si du a l 1.5 1.0 0.5 0.0 -0.5 -1.0 -1.5 10.0 7.5 5.0 2.5 0.0 Residual Fr eq ue nc y 32 30 28 26 24 22 20 18 16 14 12 10 8 6 4 2 2 1 0 -1 -2 Observation Order Re si du a l
Normal Probability Plot Versus Fits
Histogram Versus Order
Residual Plots for EWR
Figure1. Residual plots for EWR
Regression analysis is carried out to ensure a least squared fitting to error surface in Minitab 15 environment. Regression analysis has been performed to find out the relationship between input factors and MRR. During regression analysis it is assumed that the factors and the response are linearly related to each other.
The general first order model is proposed to predict the surface roughness over the experimental region can be expressed as Equation 1. In general, the R2 adj statistic will not always increase as variables are added to the model. In fact, if unnecessary terms are added, the value of R2 adjwill often decrease. When R2 and R2 adj differ dramatically, there is a good chance that no significant terms have been included in the model [16].
For this experiment the R2 value indicates that the predictors explain 97.36 % of the response variation. Adjusted R2 for the number of predictors in the model was 96.85 % both values shows that the data are fitted well. The prediction model was then validated with another set of data.Table 5 shows verification of the tests results for electrode wear rate. The predicted machining parameters performance is compared with the actual machining performance and a good agreement is observed between these performances.
In Table 5 process factors are given in terms of natural factors and their corresponding coded factors. In order to assess the accuracy of the prediction model, percentage error and average percentage error were recorded. Percentage of prediction errors is shown in the last column of Table 6. The maximum prediction error was 19.31 % and the average percentage error of this method validation was about 7.92%. As a result, the prediction accuracy of the model appeared satisfactory.
Run Ton Vgap DC Ip Fp Predicted
EWR
Experimental
EWR Error(%)
1 30 15 4 15 0.2 5.33 4.50 18.44
4 50 12 5 5 0.3 1.17 1.45 19.31
8 70 9 6 15 0.4 6.55 6.50 0.76
11 30 15 6 15 0.4 4.75 4.80 1.04
16 50 12 5 25 0.3 12.34 11.34 8.81
20 70 15 6 15 0.2 6.39 6.24 2.40
24 30 15 4 35 0.4 17.56 18.65 5.84
26 50 12 5 25 0.3 12.35 11.54 7.01
29 70 9 4 15 0.2 7.14 8.30 13.97
32 50 12 3 25 0.3 12.66 12.87 1.63
75 50 5
10 15
0 20
25 15
30 0
45
EWR
Ton
Ip
Surface Plot of EWR vs Ton, Ip
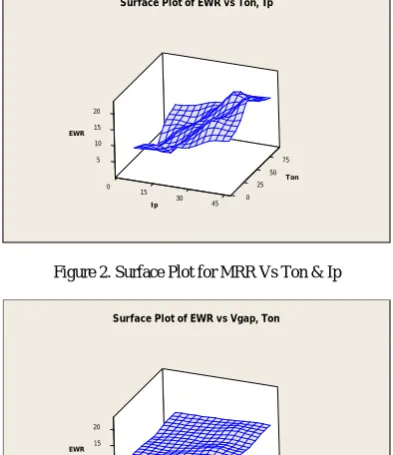
Figure 2. Surface Plot for MRR Vs Ton & Ip
15 5
10
10 15
0 20
25
50 75 5
EWR
Vgap
Ton
Surface Plot of EWR vs Vgap, Ton
Figure 3. Surface Plot for MRR Vs Ton & Vgap
15 5
10
10 15
0 20
15
30 5
45
EWR
Vgap
Ip
Surface Plot of EWR vs Vgap, Ip
Figure 4. Surface Plot for MRR Vs Vgap & Ip
Figure 2 show that electrode wear rate increases with the increase in input current. Though, there is low EWR at the initial low values of Ip and low Ton which gives linear relation but there after it is increased with rise in
current and pulse on time. Figure 3 show similar relationship between EWR versus Ton and Vgap in which it clear
that there is linear relation of Vgap with EWR. The influence of Vgap is minimum on electrode wear rate. And
figure 4 show the relation between Ip and Vgap. In this graph the high peaks show that the there is increase in
EWR with increase in Vgap.
5. Optimization of Electrode Wear Rate
As in this case of EWR we need to optimize single response, so here individual desirability (d) for material removal rate is obtained using the goals and boundaries for MRR that is given in Minitab session window. There are three optimization goals desired as follows:
minimize the response (smaller is better)
target the response (target is best) maximize the response (larger is better)
5.1 Individual desirability
The individual desirability is obtained by the maximizing desirability function as follows:
di = fi(y)wi--- (5)
Where:
Wi is the Weight for response i and the function fi(y)
In the below Table 6, y is the response value, T and L are the target and lower boundaries (i.e. minimum and maximum acceptable values for the response), respectively, and T is the target. For the EWR (y) to maximize by:
fi(y) =
1 Y<T U – y/ U –T T ≤ y ≤ U
0 y ≥ U
Table 6. Minimization of response by individual desirability [29]
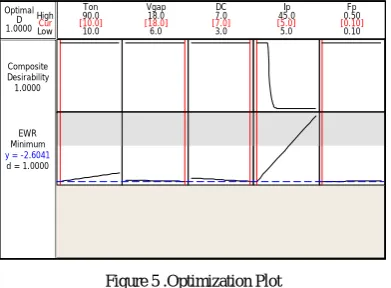
5.2 Response Optimization
Parameters
Goal Lower Target Upper Weight Import EWR Minimum 2 2 11 10 1
Table 7. EWR Range
Starting Point
Ton =50; Vgap =12; DC = 5;Ip =25; Fp =0.3
Ton = 10 Vgap = 18 DC = 7
Ip = 5 Fp = 0.1
Table 8. Global Solution
Predicted Responses
EWR = -2.60406 , desirability = 1.000000 Composite Desirability = 1.000000
Cur High Low 1.0000D Optimal
d = 1.0000 MinimumEWR
y = -2.6041
1.0000 Desirability Composite
0.10 0.50 5.0
45.0 3.0
7.0 6.0 18.0 10.0
90.0 Vgap DC Ip Fp
Ton
[10.0] [18.0] [7.0] [5.0] [0.10]
Figure 5 .Optimization Plot
Each response in the research work are expressed separately as linear and non linear functions of input variables such as Ip, Ton, Vgap, DC, Fp. It is desired to minimize the response EWR and simultaneously maintain other
responses in EDM process. As shown in Table 8 global solution of input parameters is obtained by response optimizer. To determine global solution of input variables in order to satisfy the above criteria of EWR minimization, it had been solved by Response optimizer desirability minimization function in Minitab 15 environment.
The individual desirability for EWR material removal rate is 1. To obtain this desirability, the optimum values factor levels can be set as shown under Global Solution in the Minitab Session window in Table 8. That is, Ip=5
, Ton=10, Vgap=18, DC=7, Fp= 0.5.The optimum predicted value for EWR = 2.604 obtained for 100%
6. Results and Discussion
Results obtained by this investigation are in accord with findings in literature in which Electrode wear rate in EDM machining depends prominently on input current, pulse on time and duty cycle along with minimum effect of voltage gap and flushing pressure. Results show that input current, pulse on time, duty cycle are significant factors for EWR and voltage gap, flushing pressure has minimum effect on the electrode wear rate of while machining EN-19 alloy steel material. Finally, a mathematical model was developed using multiple regression method to formulate the input current, gap voltage, pulse on time and flushing pressure to the EWR. The developed model showed high prediction accuracy within the experimental region. The maximum prediction error of the model was 19.31 % and the average percentage error of prediction was 7.92 %.
7. Conclusion
(1) The electrode wear rate increases with increasing in discharge current, but, at the high energy discharge it sometimes deposits the carbon layer which is obtained dielectric fluid at high energy regime acts as protective layer and reduces the EWR.
(2) Electrode wear rate of the Copper electrode increases with increase in current and voltage and it decreases with increase in pulse on time and flushing pressure of the dielectric fluid.
References
[1] Payal H S & Sethi B L,”Non-conventional machining processes as viable alternatives for production with Specific reference to electric discharge machining”, J Sci Ind Res, 62(2002) 678- 682.
[2] Pandey P C & Jilani S T, “Electrical machining characteristics of cemented carbides, Journal of Material Processing Technology 116 (1987) 77-88.
[3] Singh S, Maheshwari S & Pandey P C, “Some investigations into the electric discharge machining of hardened tool steel using different electrode materials”, J Mater Process Technol, 149(2004) 272 277.
[4] Kuppan, P., Rajadurai, A. and Narayanan, S. “Influence of EDM process parameters in deep hole drilling of Inconel 718”. Int. J. of Advanced Manufacturing Technology (2007) Vol. 38, No. 1-2, pp. 74-84.
[5] Kanagarajan et.al Influence of process parameters on electric discharge machining of WC/30% Co composites”. IMechE, Part B: Engineering Manufacture (2008) Vol. 222, pp. 807-815.
[6] Shabgard, M.R. and Shotorbani, R.M. “Mathematical modelling of machining parameters in EDM of FW4 welded steel”. Proc. of World Academy of Science, Engineering and Technology, (2009) ISSN: 2070-3740, pp. 403-409.
[7] Chiang, K.T. “Modelling and analysis of effects of machining parameters on the performance characteristics in the EDM process of Al2O3+TiC mixed ceramic”. Int. J. of Advanced Manufacturing Technology, (2008) Vol. 37, pp. 523-533.
[8] Habib et.al. “Study of the parameters in electrical discharge machining through response surface methodology approach”. Applied Mathematical Modelling, (2009) Vol. 33, pp. 4397-4407.
[9] Lee S.H., Li X.P. “Study of the Effect of Machining Parameters on the Machining Characteristics in Electrical Discharge Machining of Tungsten Carbide”. Journal of Materials Processing Technology. (2001)115, (3), pp. 344-358.
[10] Pichai et.al. (2012) Investigation of Electrical Discharge Machining of Tungsten Carbide using EDM-C3 Electrode Material. European Journal of Scientific Research ISSN 1450-216X Vol.76 No.1 (2012), pp. 133-142.
[11] N.Aslan (2008) Application of response surface methodology and central composite rotatable design for modelling and optimization of multi-gravity separator for chromite concentration, Powder Technology, Vol 185, Issue 1, 10 June 2008, Pages 80-86.
[12] Obeng et.al. (2005) Application of central composite rotatable design to modelling the effect of some operating variables on the performance of the three-product cyclone, Journal of Mineral Processing 76 (2005) 181-192.
[13] Cilliers JJ, Austin RC, Tucker JP(1992) An Evaluation of formal experimental design procedures for hydro cyclone modelling, 4th
International conference on hydro cyclones, pages 31-49.
[14] R.D Crozier. Flotation Theory, Reagents and Ore Testing, New York: Pergamon Press, 1992.