* Corresponding author Tel.: +919896465019 E-mail: [email protected] (R. Kumar) © 2018 Growing Science Ltd. All rights reserved. doi: 10.5267/j.ijiec.2017.6.002
International Journal of Industrial Engineering Computations 9 (2018) 221–234
Contents lists available at GrowingScience
International Journal of Industrial Engineering Computations
homepage: www.GrowingScience.com/ijiec
Parameters optimization of fabric finishing system of a textile industry using
teaching–learning-based optimization algorithm
Rajiv Kumara*, P.C. Tewarib and Dinesh Khandujab
aReseach Scholar, Department of Mechanical Engineering, National Institute of Technology, Kurukshetra, Haryana, India -136119
bProfessor, Department of Mechanical Engineering, National Institute of Technology, Kurukshetra, Haryana, India -136119
C H R O N I C L E A B S T R A C T
Article history:
Received February 13 2017 Received in Revised Format April 1 2017
Accepted June 4 2017 Available online June 4 2017
In the present work, a recently developed advanced optimization algorithm named as teaching–learning-based optimization (TLBO) is used for the parameters optimization of fabric finishing system of a textile industry. Fabric Finishing System has four main subsystems, arranged in hybrid configuration. For performance modeling and analysis of availability, a performance evaluating model of fabric finishing system has been developed with the help of mathematical formulation based on Markov-Birth-Death process using Probabilistic Approach. Then, the overall performance of the concerned system has first analyzed and then, optimized by using teaching–learning-based optimization (TLBO). The results of optimization using the proposed algorithm are validated by comparing with those obtained by using the genetic algorithm (GA) on the same system. Improvement in the results is obtained by the proposed algorithm. The results of effect of variation of the algorithm parameters on fitness values of the objective function are reported.
© 2018 Growing Science Ltd. All rights reserved Keywords:
Performance modeling TLBO
Markov process Genetic algorithm Probabilistic Approach
1. Introduction
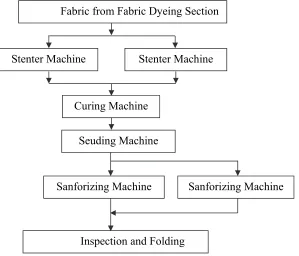
Firstly cloth is passed through water in the padding mangle and then squeezed under pressure so as to remove excess of the liquor. The fabric is wetted in order to remove creases from the fabric. Then fabric is dried over Vertical Dryers consisting of five to eight vertical steam heated cylinders depending upon the type of Seuding Machine. From here fabric moves the main Seuding Section. Twenty four small rollers are covered with emery paper and these rollers are mounted on the Drum. Twelve rollers are known to be energy pile rollers and are rotating in the direction of the fabric. Twelve remaining rollers are counter energy pile rollers and are rotating against the direction of the fabric. Sanforizing or shrinkage is the final step of finishing before the fabric is forwarded to the folding department. The function of this machine is to impart pre-determined shrinkage to the fabric so that there is no further shrinkage in fabric during washing. The schematic flow diagram of fabric finishing system is shown in Fig. 2.
The available literature shows the many approaches have been used to analyze the system performance in terms of availability. These are Reliability Block Diagram (RBD), Monte Carlo simulation, Markov approach, failure mode and effect analysis, Fault tree analysis and petri nets. Cafaro et al. (1986) explained the use of Markov models for evaluating the availability and reliability of a system when the transition rates of each component depend on the state of the system. The Markov approach was also discussed by Fu et al. (1986, 1987). Chung (1987) presented a mathematical model of a repairable parallel system with standby units involving human error and common cause failures. Laplace transforms of state probabilities and steady state availabilities of the system were evaluated. Kumar et al. (1988, 1989, 1990, 1991, 1992) derived the expressions for steady state availabilities of feeding, washing, screening, paper production and crystallization system in paper and sugar industries. Failure and repair rates were taken to be constant. Coit and Smith (1996) developed a problem specific Genetic Algorithm (GA) to analyze series-parallel systems and to determine the optimal design configuration. Singh and Mahajan (1999) examined the reliability and availability of a utensils manufacturing plant assuming constant failure and repair rates for various machines. Lai et al. (2002) studied the availability of distributed software/hardware systems. A Markov model was developed and equations were derived to obtain the steady state availability. Tewari et al. (2003) framed out a decision support system for refining system with the help of mathematical modeling using probabilistic approach. Gupta et al. (2005) proposed a method to compute reliability and long-run availability of the main parts of the serial processes system. Mathematical formulation of the model was carried out using mnemonic rule and the differential equations were solved by Runge-Kutta method. Gupta et al. (2009) assessed the reliability and availability of a critical ash handling unit of a steam thermal power plant using the concept of performance modeling and analysis. Mathematical formulation for reliability of ash handling unit of plant has been carried out using probability theory and Markov birth-death process. Khanduja et al. (2009, 2010) dealt with the mathematical modeling and performance optimization for the screening unit and paper making system in a paper plant using GA. Garg et al. (2010) dealt with availability optimization for screw plant using genetic algorithm (GA). Gupta (2011) demonstrated a mathematical model of a repairable spinning solution preparation system, a part of an acrylic yarn manufacturing plant with an effort to improve its availability. The proposed derived methodology relied on Markov Modeling. Garg and Sharma (2012) presented a technique for analyzing the behavior of an industrial unit. The synthesis unit of a urea plant situated in northern part of India has been considered to demonstrate the proposed approach. Goyal and Gupta (2012) developed a mathematical model of a complex bubble gum production system with an attempt to improve its availability. The methodology for determining the availability of the system was based on Markov modeling. The mathematical model was established using probability considerations and supplementary variable technique. Wang et al. (2012) dealt with two availability systems with warm standby units and different imperfect coverage. The failure and the time-to-repair of the active and standby units are assumed to be exponentially and generally distributed, respectively. Supplementary variable technique has been used to develop the steady-state availability for
two systems. Modgil et al. (2013) dealt a performance model based on Markov process for shoe upper
R. Kumar et al.
common cause failures of groups of elements. The number of spare parts required for an item can be effectively estimated based on its reliability performance. Ravinder Kumar (2014) developed a mathematical model based on Markov birth-death process for a boiler air circulation system of a thermal power plant. The differential equations associated with the model have been solved recursively in order to find out the system’s steady state availability. They focused mainly on coherent systems and series connection of k-out-of-n stand by subsystems with exponentially distributed component lifetimes. Sabouhi et al. (2016) discussed the Reliability modeling and Availability analysis of combined cycle power plants (CCPP). Kumar et al. (2017) dealt the performance analysis and optimization for Carbonated Soft Drink Glass Bottle (CSDGB) filling system of a beverage plant using Particle Swarm Optimization (PSO) approach. Çekyay and Özekici (2015) presented the Reliability, MTTF and Steady-State Availability Analysis of systems with exponential failure.
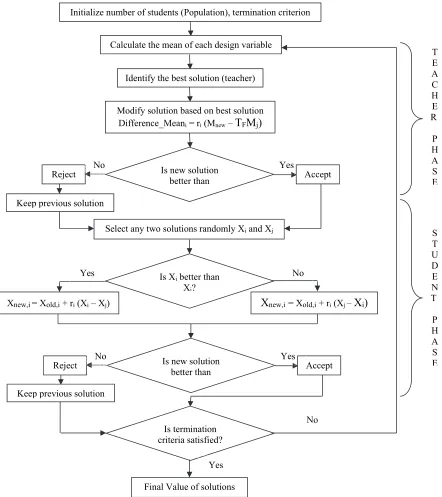
Fig. 1. Flowchart of TLBO algorithm (Rao et al., 2012)
j and X i Select any two solutions randomly X Keep previous solution
Initialize number of students (Population), termination criterion
Calculate the mean of each design variable
Identify the best solution (teacher)
Modify solution based on best solution
) j M F T – new M ( i r = i Mean _ Difference
Is new solution
better than Accept
Reject No Yes
better than i X Is ? j X Yes No ) j X – i X ( i r + i, old X = i, new X
Xnewi,= Xoldi,+ ri(Xj –Xi)
Is new solution
better than Accept
Reject No Yes
Keep previous solution
Is termination criteria satisfied?
Yes
No
Final Value of solutions
1.1Teaching–learning-based optimization algorithm
Teaching–learning-based optimization algorithm is a teaching–learning process inspired algorithm recently proposed by Rao et al. (2011, 2012)and Rao and Patel (2012)based on the effect of influence of a teacher on the output of learners in a class. In this algorithm, a group of learners are considered as population and different subjects offered to the learners are considered as different design parameters and a learner’s result is analogous to the ‘fitness’ value of the optimization problem. The best solution in the entire population is considered as the teacher. The design parameters are actually the parameters involved in the objective function of the given optimization problem and the best solution is the best value of the objective function. The working of TLBO algorithm is divided into two parts, ‘Teacher phase’ and ‘Learner phase’. Working of both these phases is described in detail by Rao et al. (2011, 2012). The same explanation of teacher phase and learner phase is referred here for the working of TLBO algorithm. Fig.1. represents the flowchart of TLBO algorithm ( Rao et al. (2012)). The TLBO algorithm has been already tested on several constrained and unconstrained benchmark functions and proved better than the other advanced optimization techniques by Rao and Patel (2012). It is also proving better in various field of engineering such as those reported by Niknam et al. (2012) in the field of electrical engineering, Togan (2012) in the field of civil engineering. Similarly, Krishnanand et al. (2011) used it for the problems related to economic load dispatch, Rao and Kalyankar (2012,2013) used it for various fields related to manufacturing processes such as machining processes, modern machining processes, laser beam welding process, etc. and Rao and Patel (2013) used it to attempt multi-objective mathematical models in the field of thermal engineering. In the literature, it is observed that, the TLBO algorithm is not yet used in the field of optimization of mathematical models of textile industry. Hence the same is now used for the parameters optimization of a system of textile industry under consideration. In this work, efforts are carried out to prove the importance of advanced optimization techniques in the field of parameters optimization of fabric finishing system so that the maintenance personnel can achieve their objectives along with satisfying various constraints and limits of the respective system.
2. System description
Fabric Finishing System of a Textile Industry consists of four subsystems with the following description:
Fig. 2. Schematic Flow Diagram of Fabric Finishing System of a Textile Industry Curing Machine
Seuding Machine
Sanforizing Machine Sanforizing Machine
Inspection and Folding
Stenter Machine Stenter Machine
R. Kumar et al.
Stenter Machine (A): The main function of Stenter Machine is to impart various chemical finishes and made them set on the fabric. There are two units of Stenter Machines working in parallel. Failure of any one reduces the capacity of the system. Complete failure of the system occurs when both the machines fail.
Curing Machine (B): Finishing chemicals are fixed here i.e. resin finishes (crosslinks). It consists of four chambers and uses thermic oil to heat these chambers. Failure of anyone chamber causes failure of this subsystem.
Seuding Machine (C): Seuding machine is used to impart peach finish to the fabric. It consists of padding mangle, vertical dryer, emery paper covered twenty four small rollers mounted on the Drum, energy pile roller and counter energy pile roller. This subsystem fails due to failure of some component.
Sanforizing Machine (D): Sanforizing is used to impart pre-determined shrinkage to the fabric so that there is no further shrinkage in fabric during washing. It consists of guided rollers, a rubber belt and steam heated cylinders. The subsystem consists of two units of Sanforizing Machines. The standby unit operates only upon the failure of first one. Complete failure of system occurs when standby unit also fails.
2.1Assumptions
i. Failure/repair rates are constant over time and statistically independent. ii. A repaired unit is as good as new, performance wise for a specified duration. iii. Sufficient repair facilities are provided, i.e. no waiting time to start the repairs.
iv. Standby units (if any) are of the same nature and capacity as the active units.
v. System failure /repair follow exponential distribution. vi. Service includes repair and /or replacement.
vii. System may work at a reduced capacity/ efficiency.
viii. There are no simultaneous failures among the system.
2.2Notations
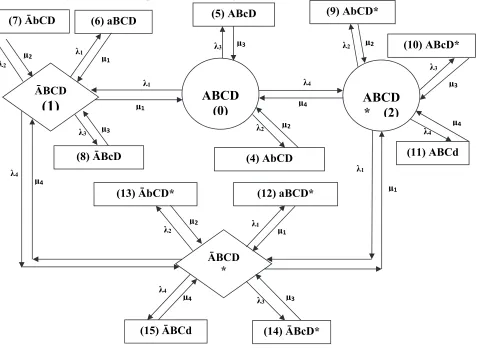
The notions associated with the Transition Diagram (Fig. 3.) are as follows:
A, B, C, D : Subsystems in good operating state.
Ā : indicates that A is working in reduced capacity.
D* : One unit of subsystem Dis in failed state and the system is working in full capacity with standby unit.
a, b, c, d : indicate the failed states of A, B, C, D.
λi : Mean constant failure rates from A, B, C, D to the states a, b, c, d.
µi : Mean constant repair rates from states a, b, c, d to the states A, B, C, D.
P0(t) : Probability of full working capacity (without standby unit).
P2(t) : Probability of full working capacity (with standby unit).
P1(t), P3(t) : Probability of reduced working capacity. P4(t) - P15(t) : Probability of failed states.
: System working at full capacity.
: System working at reduced capacity.
: System in failed state.
Based on above assumptions and notations the state transition diagram of fabric finishing system of a textile industry has been developed as shown in Fig. 3.
Fig. 3. Transition Diagram of Fabric Finishing System of a Textile Industry
3. Performance modeling
The mathematical modeling of the system based on Markov birth-death process is carried out using various probabilistic considerations. The first order Chapman-Kolmogorov differential equations associated with the state transition diagram shown in fig.3 are developed by using mnemonic rule as
stated by Khanduja et al. (2012).Various probability considerations generate the following sets of
differential equations:
P t K P t μ P t P t P t P t (1)
P t K P t μ P t μ P t λ P t (2)
2 λ 3 µ 3 λ 4 λ 4 µ 2
λ µ2
1 λ 1 µ 1 λ 1 µ 3 λ µ3
4 λ 4 µ 2 µ 2
λ µ2 λ1 µ1
4 λ
4
µ λ3 µ3
1 λ
1
µ 2
λ µ2
3 λ 3 µ 4 µ 4 λ
ABCD
(0)
(5) ABcDABCD
* (2)
(9) AbCD*
(10) ABcD*
(11) ABCd (4) AbCD
(12) aBCD* (13) ĀbCD*
ĀBCD *
(14) ĀBcD* (15) ĀBCd
(8) ĀBcD
ĀBCD
(1)
R. Kumar et al.
P t K P t μ P t μ P t λ P t (3)
P t K P t ∑ μ P t λ P t (4)
P t μ P t λ P t (5)
P t μ P t λ P t (6)
P t μ P t λ P t (7)
P t μ P t λ P t (8)
P t μ P t λ P t (9)
P t μ P t λ P t (10)
P t μ P t λ P t (11)
P t μ P t λ P t (12)
P t μ P t λ P t (13)
P t μ P t λ P t (14)
P t μ P t λ P t (15)
P t μ P t λ P t (16)
where
K λ λ λ λ K λ λ λ λ μ
K λ λ λ λ μ K λ λ λ λ μ μ
Since Textile Industry is process industry, it’s every subsystem should be available for long period of time. So, long run availability of the system is computed by taking t and d/dt 0 applying on set of first order differential equations and solving them recursively we get:
P L P P L P P L P P H P
P H P P H L P P H L P P H L P
P H L P P H L P P H L P P H L P
P H L P P H L P P H L P
where
H μλ H μλ H λμ H μλ
N μ μ μμ λ μμ μ N λ λμ λ λ λ μ λμ λ L
L μλ μ Lμ L L λ
P 1
P 1 L L L H H H L H L H L H L H L H L H L H L H L H L
Now, the Steady State Availability of the Fabric Finishing System may be obtained as the summation of all the working state probabilities, i.e.
A P P P P= 1 L L L P
4. Proposed advanced optimization algorithms
Two advanced optimization algorithms are considered in the present work for fabric finishing system’s parameters optimization and are described in the following sections.
4.1Teaching-learning-based optimization (TLBO)
TLBO is a teaching-learning process inspired algorithm proposed by Rao et al. (2011) based on the effect of influence of a teacher on the output of learners in a class. The algorithm mimics teaching-learning ability of teacher and learners in a classroom. Teacher and learners are the two vital components of the algorithm which describes two basic modes of the learning, through a teacher (known as teacher phase) and interacting with the other learners (known as learner phase).
The output in TLBO algorithm is considered in terms of results or grades of the learners which depend on the quality of the teacher. So, a teacher is usually considered as a highly learned person who trains learners so that they can have better results in terms of their marks or grades. Moreover, learners also learn from the interaction among themselves which also helps in improving their results.
TLBO is a population based method. In this optimization algorithm a group of learners is considered as a population; different design variables are considered as different subjects offered to the learners, and learners’ results are analogous to the ‘fitness’ value of the optimization problem. In the entire population the best solution is considered as the teacher. The working of TLBO is divided into two parts, ‘Teacher phase’ and ‘Learner phase’. The working of both phases is explained below.
4.1.1.Teacher phase
This is first part of the algorithm where learners learn through the teacher. During this phase a teacher tries to increase the mean result of the classroom from any value M1 to his or her level (i.e. TA). However, practically this is not possible and a teacher can move the mean of the classroom
M1to any other value M2which is better than M1, depending on his or her capability. Consider Mj to be
the mean and Ti to be the teacher at any iteration i. Now Tiwill try to improve existing mean Mjtowards
it so the new mean will be Ti designated as Mnew and the difference between the existing mean and new
mean is given by Rao et al. (2011),
Difference Meani = ri (Mnew – TFMj) (17)
where TFis the teaching factor which decides the value of mean to be changed, and riis a random number in the range [0, 1]. The value of TFcan be either 1 or 2 which is a heuristic step and it is decided randomly with equal probability as,
TF = round [1 + rand(0, 1){2 − 1}] (18)
R. Kumar et al.
Xnew,i = Xold,i + Difference Meani (19)
4.1.2. Learner Phase
This is the second part of the algorithm where learners increase their knowledge by interaction among themselves. A learner interacts randomly with other learners for enhancing his or her knowledge. A learner learns new things if the other learner has more knowledge than him or her. Mathematically, the learning phenomenon of this phase is expressed below:
At any iteration i, considering two different learners Xiand Xjwhere i≠j
Xnew,i = Xold,i + ri (Xi – Xj) If f (Xi) < f (Xj) (20)
Xnew,i = Xold,i + ri (Xj – Xi) If f (Xj) < f (Xi) (21)
Accept Xnew if it gives better function value. Implementation steps of the TLBO are summarized below.
Step 1: Initialize the population (i.e. learners) and design variables of the optimization problem (i.e. number of
subjects offered to the learner) with random generation and evaluate them.
Step 2: Select the best learner as a teacher and calculate mean result of learners in each subject.
Step 3: Evaluate the difference between current mean result and best mean result according to Equation (i) by
utilizing the teaching factor (TF).
Step 4: Update the learners’ knowledge with the help of teacher’s knowledge according to Equation (iii).
Step 5: Update the learners’ knowledge by utilizing the knowledge of some other learner according to Equations (iv)
and (v).
Step 6: Repeat the procedure from step 2 to 5 until the termination criterion is met.
5. Optimization results using TLBO algorithms
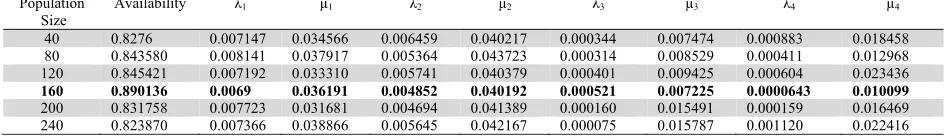
The performance behavior of the Fabric Finishing System (FFS) is highly influenced by the failure and repair parameters of each subsystem. These parameters ensure high performance of the Fabric Finishing System. The optimum value of system’s performance (Availability) is 89.01%, for which the best possible combination of failure and repair rates is λ1=0.0069, µ1=0.036191, λ2=0.004852, µ2=0.040192,
λ3=0.000521, µ3=0.007225,λ4=0.0000643 and µ4= 0.010099 at population size 160 as given in Table 1.
Table 1
Effect of Population Size on the Availability of FFS Using Teaching Learning Based Optimization (TLBO)
Population Availability λ1 µ1 λ2 µ2 λ3 µ3 λ4 µ4
Size
Fig. 4. Effect of Population Size on Fabric Finishing System Availability using TLBO
The effect of population size on availability of the Fabric Finishing System is shown in Fig.4. This Figure represents the optimal curve obtained by using the TLBO algorithm for availability and its comparison with the optimal curve obtained by using GA as shown in Fig. 5.
6. Performance optimization using genetic algorithm
Genetic Algorithm Technique (GAT) is hereby proposed to coordinate the failure and repair parameters of each subsystem for stable system performance, i.e., high availability. Here, the number of parameters is eight (four failure parameters and four repair parameters). The design procedure is described as follows: To use GAT for solving the given problem, the chromosomes are to be coded in real structures. Here, concatenated, multi-parameter, mapped, fixed point coding is used. Unlike, unsigned fixed-point integer coding parameters are mapped to a specified interval [Xmin, Xmax], where Xmin and Xmax are the maximum and minimum values of system parameters. The maximum value of the availability function corresponds to the optimum values of system parameters. These parameters are optimized according to the performance index, i.e., desired availability level. To test the proposed method, failure and repair rates are determined simultaneously for optimal value of unit availability. Effects of population size on the availability of fabric finishing system are shown in Tables 3. To specify the computed simulation more precisely, trial sets are also chosen for GA and system parameters.
Table 2
Failure and Repair Rate Parameter Constraints
Parameter λ1 µ1 λ2 µ2 λ3 µ3 λ4 µ4
Minimum 0.0069 0.0287 0.0052 0.0316 0.0001 0.0084 0.0005 0.0124
Maximum 0.0089 0.0387 0.0072 0.0416 0.0021 0.0184 0.0025 0.0224
The performance (availability) of the fabric finishing system is determined by the designed values of the system parameters as shown in Table 2.
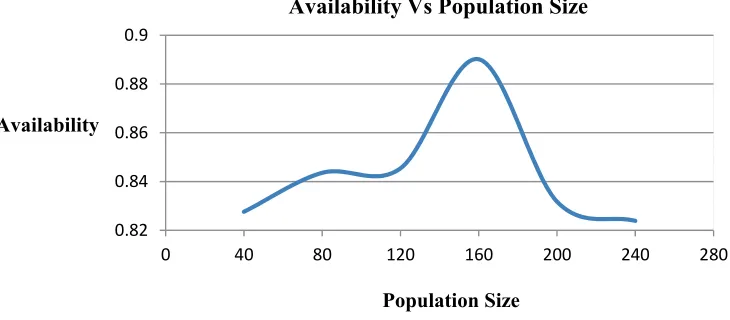
Here, real-coded structures are used. The simulation is done to a maximum number of population size, which is varying from 40 to 240. The effect of population size on availability of the fabric finishing system is shown in Fig. 5.
The optimum value of system’s performance (Availability) is 83.31%, for which the best possible
combination of failure and repair rates is λ1=0.006905, µ1=0.0387, λ2=0.005201, µ2=0.0416,
λ3=0.000103, µ3=0.0184,λ4=0.000507 and µ4= 0.0224 at population size 200 as given in Table 3.
0.82 0.84 0.86 0.88 0.9
0 40 80 120 160 200 240 280
Population Size Availability
R. Kumar et al.
Fig. 5. Effect of Population Size on Fabric Finishing System Availability using GA
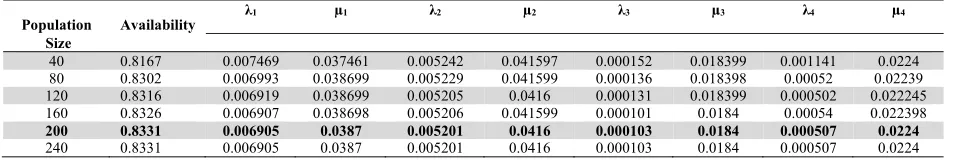
Table 3
Effect of Population Size on the Availability of FFS Using Genetic Algorithm
Population Availability λ1 µ1 λ2 µ2 λ3 µ3 λ4 µ4
Size
40 0.8167 0.007469 0.037461 0.005242 0.041597 0.000152 0.018399 0.001141 0.0224 80 0.8302 0.006993 0.038699 0.005229 0.041599 0.000136 0.018398 0.00052 0.02239 120 0.8316 0.006919 0.038699 0.005205 0.0416 0.000131 0.018399 0.000502 0.022245 160 0.8326 0.006907 0.038698 0.005206 0.041599 0.000101 0.0184 0.00054 0.022398
200 0.8331 0.006905 0.0387 0.005201 0.0416 0.000103 0.0184 0.000507 0.0224
240 0.8331 0.006905 0.0387 0.005201 0.0416 0.000103 0.0184 0.000507 0.0224 Number of Generations=100; Reproduction (Crossover Fraction) = 0.80; Fitness Scaling: Rank.
7. Conclusions
The present work demonstrates the successful application of the TLBO algorithm for the single objective optimization of fabric finishing system of a textile industry. A set of optimal points is obtained by using the normalized objective function with the considered algorithm. The ability of the proposed algorithm is demonstrated by using a fabric finishing system and the performance of the proposed algorithm is compared with the performance of genetic algorithm (GA) approach. Improvement in the availability corresponding to 83.31% to 89.01% is obtained using the proposed TLBO algorithm, as compared to the GA approach showing the improvement potential of the algorithm for such industrial maintenance optimization. Unlike other population-based optimization techniques, TLBO does not require any algorithm parameters to be tuned which makes the implementation of TLBO simpler and easier.
Acknowledgment
The authors are very thankful to the management of Auro Textile Mills, Baddi, Himachal Pradesh, for granting the permission of industrial visits and also for informative discussions with engineers, maintenance personnel essential to attain optimum level of availability of the system concerned.
References
Cafaro, G., Corsi, F., & Vacca, F. (1986). Multi state markov models and structural properties of the transition rate matrix. IEEE Transactions on Reliability, 35(2), 192-200.
Çekyay, B., & Özekici, S. (2015). Reliability, MTTF and steady-state availability analysis of systems
with exponential lifetimes. Applied Mathematical Modelling, 39(1), 284-296.
Chung, W.K. (1987). Reliability analysis of repairable parallel system with standby involving human error and common-cause failures. Microelectronics Reliability, 27(2), 269-271.
0.815 0.817 0.819 0.821 0.823 0.825 0.827 0.829 0.831 0.833 0.835
0 40 80 120 160 200 240 280
Population Size
Avail
abi
li
ty
Coit, D.W., & Smith, A.E. (1996). Reliability optimization of series parallel systems using genetic algorithm. IEEE Transactions on Reliability, 45(2), 254-260.
Fu, J.C. (1986). Reliability of large consecutive-K-out-of-N: F systems with k−1 step markov
dependence. IEEE Transactions on Reliability, 35(5), 602–606.
Fu, J.C., & Hu, B. (1987). On reliability of large consecutive-K-out-of-N: F systems with k-1 step markov dependence. IEEE Transactions on Reliability, 36(1), 75-77.
Garg, D., Kumar, K., & Meenu (2010). Availability optimization for screw plant based on genetic algorithm. International Journal of Engineering Science and Technology, 2(4), 658-668.
Garg, H., & Sharma, S.P. (2012). Behavior analysis of synthesis unit in fertilizer plant. International Journal of Quality & Reliability Management, 29(2), 217 – 232.
Goyal, A., & Gupta, P. (2012). Performance evaluation of a multi-state repairable production system – a case study. International Journal of Performability Engineering, 8(3), 330-338.
Gupta, P., Lal, A.K., Sharma, R.K., & Singh, J. (2005). Numerical Analysis of reliability and availability of the serial processes in butter-oil processing plant. International Journal of Quality & Reliability
Management, 22(3), 303 – 316.
Gupta, S., Tewari, P.C., & Sharma, A.K. (2009). Reliability and Availability analysis of ash handling unit of a steam thermal power plant. South African Journal of Industrial Engineering, 20(1), 147-158. Gupta, P. (2011). Markov modeling and availability analysis of a chemical production system-a case
study. Proceedings of the World Congress on Engineering, Vol. I, WCE -2011, July 6 - 8, 2011,
London, U.K.
Khanduja, R., Tewari, P.C., & Chauhan, R.S. (2009). Performance analysis of screening unit in a paper plant using genetic algorithm. Journal of Industrial and Systems Engineering, 3(2), 140-151.
Khanduja, R., Tewari, P.C., Chauhan, R.S. & Kumar, D. (2010). Mathematical modeling and
performance optimization for paper making system of a paper plant. Jordan Journal of Mechanical
and Industrial Engineering, 4(4), 487-494.
Khanduja, R., Tewari, P. C., & Chauhan, R.S. (2012). Performance modeling and optimization for the stock preparation unit of a paper plant using genetic algorithm. International Journal of Quality
Reliability and Management, 28(6), 688-703.
Khanduja, R., Tewari, P. C. & Gupta, M. (2012). Performance enhancement for crystallization unit of sugar plant using genetic algorithm technique. Journal of Industrial Engineering International, 28(6), 688-703.
Krishnanand, K. R., Panigrahi, B. K., Rout, P. K., & Mohapatra, A. (2011, December). Application of multi-objective teaching-learning-based algorithm to an economic load dispatch problem with
incommensurable objectives. In International Conference on Swarm, Evolutionary, and Memetic
Computing (pp. 697-705). Springer Berlin Heidelberg.
Kumar, D., Singh, I.P., & Singh, J. (1988). Reliability analysis of the feeding system in the paper industry. Microelectronics Reliability, 28(2), 213-215.
Kumar, D., Singh, J., & Pandey, P.C. (1989). Availability of a washing system in the paper industry. Microelectronics Reliability, 29(5), 775-778.
Kumar, D, Singh, J., & Pandey, P.C. (1990). Cost analysis of a multi-component screening system in the paper industry. Microelectronics Reliability, 30(3), 457-461.
Kumar, D., Singh, J., & Pandey, P.C. (1991). Behavioral analysis of a paper production system with different repair policies. Microelectronics Reliability, 31(1), 47-51.
Kumar, D., Singh, J., & Pandey, P.C. (1992). Availability of the crystallization system in the sugar industry under common-cause failure. IEEE Transactions on Reliability, 41(1), 85-91.
Kumar, R. (2014). Availability analysis of thermal power plant boiler air circulation system using
Markov approach. Decision Science Letters, 3(1), 65-72.
Kumar, P., & Tewari, P. (2017). Performance analysis and optimization for CSDGB filling system of a
beverage plant using particle swarm optimization. International Journal of Industrial Engineering
Computations, 8(3), 303-314.
Lai, C. D., Xie, M., Poh, K. L., Dai, Y. S., & Yang, P. (2002). A model for availability analysis of
R. Kumar et al.
Levitin, G., Xing, L., Amari, S. V., & Dai, Y. (2013). Reliability of non-repairable phased-mission
systems with propagated failures. Reliability Engineering & System Safety, 119, 218-228.
Modgil V., Sharma, S. K., & Singh, J. (2013). Performance modeling and availability analysis of shoe upper manufacturing unit. Int J Quality Reliability and Management, 30(8), 816-831.
Niknam, T., Fard, A.K. & Baziar, A. (2012). Multi-objective stochastic distribution feeder reconfiguration problem considering hydrogen and thermal energy production by fuel cell power plants. Energy,42, 563–573.
Niknam, T., Azizipanah-Abarghooee, R., & Narimani, M. R. (2012). An efficient scenario-based
stochastic programming framework for multi-objective optimal micro-grid operation. Applied
Energy, 99, 455-470.
Niknam, T., Azizipanah-Abarghooee, R., & Narimani, M. R. (2012). A new multi objective optimization approach based on TLBO for location of automatic voltage regulators in distribution
systems. Engineering Applications of Artificial Intelligence, 25(8), 1577-1588.
Niknam, T., Golestaneh, F., & Sadeghi, M. S. (2012). $\ theta $-Multiobjective
Teaching–Learning-Based Optimization for Dynamic Economic Emission Dispatch. IEEE Systems Journal, 6(2),
341-352.
Rao, R. V., Savsani, V. J., & Vakharia, D. P. (2011). Teaching–learning-based optimization: a novel
method for constrained mechanical design optimization problems. Computer-Aided Design, 43(3),
303-315.
Rao, R. V., Savsani, V. J., & Vakharia, D. P. (2012). Teaching–learning-based optimization: an
optimization method for continuous non-linear large scale problems. Information Sciences, 183(1),
1-15.
Rao, R., & Patel, V. (2012). An elitist teaching-learning-based optimization algorithm for solving
complex constrained optimization problems. International Journal of Industrial Engineering
Computations, 3(4), 535-560.
Venkata Rao, R., & Kalyankar, V. D. (2012). Parameter optimization of machining processes using a
new optimization algorithm. Materials and Manufacturing Processes, 27(9), 978-985.
Rao, R.V., & Kalyankar, V.D. (2012). Multi-objective multi-parameter optimization of the industrial LBW process using a new optimization algorithm. In Proceedings of the Institution of Mechanical Engineers, Part B: Journal of Engineering Manufacture, 226(6), 1018–1025.
Rao, R. V., & Kalyankar, V. D. (2013). Parameter optimization of modern machining processes using
teaching–learning-based optimization algorithm. Engineering Applications of Artificial
Intelligence, 26(1), 524-531.
Rao, R. V., & Patel, V. (2013). Multi-objective optimization of heat exchangers using a modified
teaching-learning-based optimization algorithm. Applied Mathematical Modelling, 37(3), 1147-1162.
Rao, R. V., & Patel, V. (2013). Multi-objective optimization of two stage thermoelectric cooler using a
modified teaching–learning-based optimization algorithm. Engineering Applications of Artificial
Intelligence, 26(1), 430-445.
Sabouhi, H., Abbaspour, A., Fotuhi-Firuzabad, M., & Dehghanian, P. (2016). Reliability modeling and
availability analysis of combined cycle power plants. International Journal of Electrical Power &
Energy Systems, 79, 108-119.
Singh, J., & Mahajan, P. (1999). Reliability of utensils manufacturing plant-a case study. Opsearch, 36(3), 260-269.
Tewari, P.C., Kumar, D., & Mehta, N.P. (2003). Decision support system of refining system of sugar plant. Journal of Institution of Engineers (India), 84, 41-44.
Togan, V. (2012). Design of planar steel frames using teaching–learning based optimization. Engineering Structure, 34, 225–232.
Wang, K.H., Yen, T.C., & Fang, Y.C. (2012). Comparison of availability between two systems with
warm standby units and different imperfect coverage. Quality Technology and Quantitative
Management, 9(3), 256-282.