Available online on 15.07.2019 at http://jddtonline.info
Journal of Drug Delivery and Therapeutics
Open Access to Pharmaceutical and Medical Research© 2011-18, publisher and licensee JDDT, This is an Open Access article which permits unrestricted non-commercial use, provided the original work is properly cited
Open Access
Research Article
Development and Validation of RP-HPLC Method for Estimation of Etizolam
in Bulk
Shubhangi L. Harde*, Ravindra B. Laware, Mahesh H. Kolhe
Department of Pharmaceutical Quality assurance, Pravara Rural College of Pharmacy, Pravaranagar, Tal – Rahata, Dist – Ahmednagar, India
ABSTRACT
The present research work describes a simple, accurate, precise, effective, stability indicating, RP-HPLC method for estimation of Etizolam in there tablet dosage form. A Reverse phase high performance chromatographic method was developed for estimation of Etizolam dosage. The separation was achieved by Cosmosil C18 (250mm×4.6ID, Particle size: 5 micron) and methanol: water in the proportion of 30:70v/v as mobile phase, at a flow rate 0.8ml/min. Detection was carried out at 242nm. For RP-HPLC method results of the validation indicate that the method was linear in the range of 100-600 µg/ml for Etizolam. The % recoveries for Etizolam obtained in the accuracy study were 99.77-99.51% respectively. The LOD for Etizolam were found to be 0.7877µg/ml. LOQ for Etizolam found to be 2.382µ/ml. Developed methods were found to be accurate, precise, rapid and stability indicating for estimation of Etizolam.
Keywords: Etizolam, RP-HPLC, tablet dosage form
Article Info:Received 19 May 2019; Review Completed 26 June 2019; Accepted 30 June 2019; Available online 15 July 2019 Cite this article as:
Harde SL, Laware RB, Kolhe MH, Development and Validation of RP-HPLC Method for Estimation of Etizolam in Bulk,
Journal of Drug Delivery and Therapeutics. 2019; 9(4):335-340 http://dx.doi.org/10.22270/jddt.v9i4.3057
*Address for Correspondence:
Shubhangi L. Harde, Department of Pharmaceutical Quality assurance, Pravara Rural College of Pharmacy, Pravaranagar, Tal – Rahata, Dist – Ahmednagar, India
1. INTRODUCTION
1.1 Drug Profile
Etizolam (ETI) belongs to an original chemical class of
diazepines, namely thienotriazolodiazepines with
antianxiety activity and chemically it is 4-(2-chlorophenyl)-2-ethyl-9-methyl-6H-thieno [3,2-f] [1,2,4] triazolo -[4,3-a] [1,4]diazepines 1)[1,2]. ECS is official in IP’10 and ETI is official in JP XV [3,4].
Literature survey also reports few HPLC [5] methods for estimation of Etizolam (ETI) individually or in combination with other drugs. Present work describes rapid, simple, sensitive, accurate and reproducible stability indicating method.
Structure :
IUPAC Name :
4-(2-chlorophenyl)-2-ethyl-9- methyl-6H-thieno[3,2- f][1,2,4triazolo[4,3-a][1,4]diazepine. Molecular
Formula:
C17H15ClN4S [8]
Molecular weight:
342.854 g/mol
Appearance : White powder
Melting Point : 145-148℃
Boiling Point : 545.3±60
Category : Amnesic, anxiolytic,
anticonvulsant, hypnotic, sedative and skeletal muscle relaxant.[6]
Solubility : No soluble in water. Soluble in
Mechanism of Action
Etizolam is selectively a full agonist at GABA receptor to increase GABAergic transmission and enhance GABA-induced Cl-currents[11]. It is reported to bind to the benzodiazepine binding site which is located across the interface between the alpha and gamma subunits [12]. The present study aimed to develop a simple, sensitive, short retention time and accurate, validation of RP-HPLC method for estimation of Etizolam in bulk and tablet dosage form.
2.
MATERIALS AND METHOD :
Etizolam is gift sampled by Macleods Pharmaceutical Ltd., Daman, Gujarat.
All solvents and other reagents were of HPLC grade. 2.1. Instruments and Apparatus:
System used for the research : HPLC Binary Gradient
system
Model no. : HPLC 3000 Series (Analytical
Technologies Ltd.)
Column : Cosmosil C18 (250mm×4.6ID, Particle size:
5 micron)
2.2. Preparation of Standard Solution -
Preparation of std stock solution of Etizolam –
(1000ppm)
Weighed accurately 10mg of pure drug and dissolved in 10ml of solvent (Methanol: water (50:50); this gives 1000ppm solution of Etizolam. From this 0.1ml was transferred to 10 ml volumetric flask to prepare solution of 100 ppm.
2.3. Selection of Wavelength for Estimation:
Standard solution of Etizolam of concentration 10µg/ml was scanned between 200-400 nm using methanol as blank. The peak was obtained at 248nm.
Fig : 1.Spectra of standard Etizolam for wavelength selection.
2.4 Trial batches for selecting optimum solvent system
Trial batches were run as per following chromatographic conditions by using methanol and water in the ratio of 90:10, 80:20 and 70:30 respectively.
Table 1: optimized chromatographic condition
Parameters Condition
Stationary Phase Cosmosil C18
(250mm×4.6ID, Particle size: 5 micron)
Mobile Phase Methanol : water
Pump Mode Reciprocating
Flow Rate (ml/min) 0.8ml/min
Run Rate (min) 9.79
Volume of Injection
(microliter) 20
Detection Wavelength 248
Retention time (min) 7.003
Table 2: System suitability parameters for final optimized chromatographic conditions
Parameters Data Obtained
70 : 30 80 : 20
Retention Time (Rt) 7.003 min 4.345 min
Resolution 0.00 0.00
Theoretical Plates (N) 3827 8695
---
Fig2. Chromatogram of standard showing separated peak of Etizolam.
From above findings, it was concluded that the most efficient resolution and peak symmetry for Etizolam achieved with the above chromatographic conditions and with a mobile phase composed of Methanol: water (70:30%v/v)
3. METHOD VALIDATION
The described method has been validated for linearity, accuracy, limit of detection, limit of quantification, and robustness, as per ICH guidelines.
3.1 Linearity
Linear relation was obtained between mean peak area and concentration of the drug in the range of 10-50µg/ml. The data of peak areas obtained with the respective concentration in microgram/ml are shown in Table 3 for Etizolam. The linearity curves for Etizolam shown in Fig 3.
Table 3: Data of peak area of Etizolam (10-50µg/ml)
Sr. No. Concentration (µg/ml) Peak area of Etizolam
1 10 601683
2 20 1253654
3 30 1865239
4 40 2415986
5 50 3093992
Fig 3: Calibration Curve for Etizolam. 3.2 Accuracy
Accuracy refers to closeness of the test results obtained by the method to the true value. Accuracy was performed by the standard addition methods. To a fixed amount of the pre-analysed mixture add a 50%, 100%, and 150% of the standard solution and % recovery was calculated. The results are shown in table 4.
(1
)
4
.3
4
5'
- 10 0 10 20 30 40 50 60 70 80 90 100 110 120 130 m V
2 4 6 8 10 12 14 16 18 m i n
(
1)
7.
003'
- 10 0 10 20 30 40 50 60 70 80 90 m V
2 4 6 8 10 12 14 16 18 m i n
y = 61470x + 2025.8 R² = 0.9991
0 500000 1000000 1500000 2000000 2500000 3000000 3500000
0 10 20 30 40 50 60
P
e
ak
Ar
e
a
Table 4: Recovery data for Etizolam
Sr. No % Composition Area of Standard Area of Sample % Recovery
1 50% Recovery 1865239 1861110 99.77863427
2 100% Recovery 2415986 2399110 99.30148602
3 150% Recovery 3093992 3078990 99.5151248
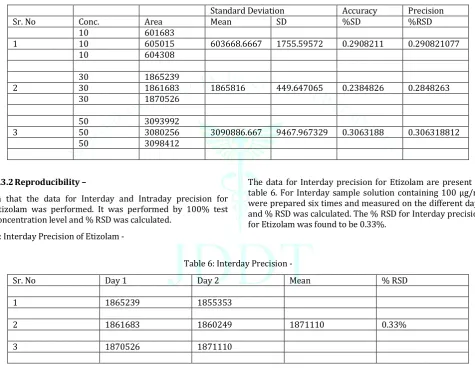
3.3. Precision
3.3.1 Repeatability –
It was performed by 100% test concentration level and % RSD was calculated. The data for repeatability for Etizolam is presented in table no. 5
Table 5 : Repeatability data for Etizolam
Standard Deviation Accuracy Precision
Sr. No Conc. Area Mean SD %SD %RSD
10 601683
1 10 605015 603668.6667 1755.59572 0.2908211 0.290821077
10 604308
30 1865239
2 30 1861683 1865816 449.647065 0.2384826 0.2848263
30 1870526
50 3093992
3 50 3080256 3090886.667 9467.967329 0.3063188 0.306318812
50 3098412
3.3.2Reproducibility –
In that the data for Interday and Intraday precision for Etizolam was performed. It was performed by 100% test concentration level and % RSD was calculated.
A: Interday Precision of Etizolam -
The data for Interday precision for Etizolam are present in table 6. For Interday sample solution containing 100 µg/ml were prepared six times and measured on the different days and % RSD was calculated. The % RSD for Interday precision for Etizolam was found to be 0.33%.
Table 6: Interday Precision -
Sr. No Day 1 Day 2 Mean % RSD
1 1865239 1855353
2 1861683 1860249 1871110 0.33%
3 1870526 1871110
B: Intraday Precision of Etizolam -
The data for Intraday precision for Etizolam shown in table 7. For Intraday sample solution of 100 µg/ml of Etizolam
were prepared six times and measured on the same day and % RSD was calculated. The % RSD for Intraday precision was found to be 0.23%.
Table 7: Intraday Precision -
Sr. No Morning Evening Mean % RSD
1 1865239 1870976
2 1861683 1867709 1868304 0.23%
3.4 Limit of Detection (LOD) and Limit of Quantification (LOQ) :
3.4.1: Limit of detection (LOD) –
Limit of detection is calculated by using formula, LOD = 3.3× (SD/Slope)
LOD = 3.3× (0.2384/0.999) LOD = 0.7875µg/ml.
3.4.2: Limit of Quantification (LOQ) –
Limit of Quantification is calculated by using formula, LOQ = 10× (SD/Slope)
LOQ = 10× (0.2384/0.999) LOQ = 2.3863 µg/ml.
3.5: Robustness
Robustness was calculated by using two methods, i.e; change in flow rate and change in wavelength.
3.5.1: The data for Robustness of Etizolam for change in flow rate is shown in table no.8.
Table 8: Robustness data for change in flow rate –
Sr. No Conc. Area Mean SD %SD
20 1250874
1. 20 1253654 1251021 2562.18 0.20480698
20 1248536
3.5.2: The data for Robustness of Etizolam for change in wavelength is shown in table no.9. Table 9: Robustness data for change in wavelength –
Sr. No Conc. Area Mean SD %SD
20 1253654
1. 20 1251683 1253657 1975 0.15753925
20 1255633
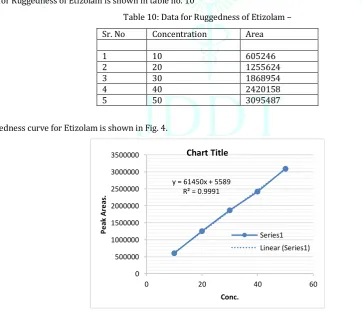
3.6: Ruggedness
The data for Ruggedness of Etizolam is shown in table no. 10
Table 10: Data for Ruggedness of Etizolam –
Sr. No Concentration Area
1 10 605246
2 20 1255624
3 30 1868954
4 40 2420158
5 50 3095487
The Ruggedness curve for Etizolam is shown in Fig. 4.
Fig 4. Ruggedness curve for Etizolam.
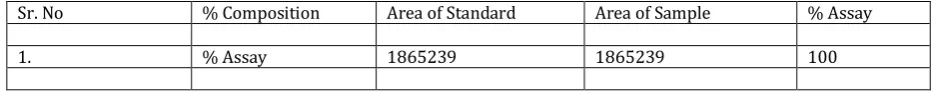
3.7: Assay
By using the standard areas from linearity of reported concentration the % assay was calculated. The data for assay of Etizolam is shown in table no. 11
y = 61450x + 5589 R² = 0.9991
0 500000 1000000 1500000 2000000 2500000 3000000 3500000
0 20 40 60
P
e
ak
Ar
e
as
.
Conc. Chart Title
Table 11: Data for assay of Etizolam –
Sr. No % Composition Area of Standard Area of Sample % Assay
1. % Assay 1865239 1865239 100
4. RESULTS AND DISCUSSION
4.1. Optimized chromatographic conditions
The optimized chromatographic conditions fig 1.The best peak shape and maximum separation was achieved with mobile phase Methanol : Water in the proportion of 70:30 %v/v, peak symmetry and reproducibility obtained on Cosmosil C18 (250mm*4.6ID, Particle size : 5 micron), optimum wavelength. For detecting analyte, ƛmax was found to be 248nm, A flow rate of 0.8ml/min yielded optimum separation and peak symmetry. Chromatogram of Etizolam fig 2 and optimized chromatographic condition is shown in table 1.
4.2. Linearity
Linear relation was obtained between mean peak area and concentration of the drug in the range of 10-50µg/ml for Etizolam. Shown in fig.3
4.3. Accuracy
The percentage recovery for Etizolam were 99.77–99.51%, shown in table 4 and 5
4.4. Precision
4.4.1. Interday –
The data for Interday precision for Etizolam is present in table.6. The % RSD for Interday was found to be 0.33%. 4.4.2. Intraday –
The data for Intraday precision for Etizolam is present in table.7. The % RSD for Intraday was found to be 0.23%.
4.5. LOD and LOQ
The LOD for Etizolam were found to be 0.7875µg/ml. LOQ for Etizolam were found to be 2.3863µg/ml.
4.6. Robustness
Result of the Robustness table no. 8. The %SD for Robustness for change in flow rate was found to be 0.2048%. Shown in table no.8.
The % SD for Robustness for change in wavelength was found to be 0.1575%. Shown in table no. 9.
4.7. Ruggedness
The result for Ruggedness curve for Etizolam is shown in fig. 4.
5. CONCLUSION
A simple, fast, accurate and precise RP-HPLC analytical method has been developed and validated for the Quantitative analysis of Etizolam in Bulk form. The results of stress testing undertake according to the ICH guidelines reveal that the method is specific and accurate.
REFERENCES
1. Sweetman SC. Martindale-The Complete Drug Reference, Pharmaceutical Press, London, (2009); 391,996.
2. Maryadele J. The Merck Index An Encyclopedia Of Chemicals, Drugs And Biologicals, USA: Merck Research Laboratories, (2006): 387-388,660.
3. Indian Pharmacopoeia, Government of India, Ministry Of Health and Family Welfare, Ghaziabad- The Indian Pharmacopoeial Commission, 2nd Volume (2010): 1293-1294.
4. Japanese Pharmacopoeia, Ministry of Health, Labour and Welfare, Japan, (XV):652.
5. Tanaka E, Masaru T, Misawa S and Wakasugi C. Simultaneous Determination Of Twelve Benzodiazepines In Human Serum Using A New Reversed-phase Chromatographic Column on A 2-microns Porous Microspherical Silica Gel, Journal Of Chromatography B Biomedical Application, 1996;682(1):173-178.
6. Indian Pharmacopoeia, Ghaziabad, India, Indian Pharmacopoeia Commission, Volume 2, 2010.
7. Granville GR, Propranolol, Anxiety and the Central nervous system. KBr J ClinPharmacol. 1974;1(5):361-363.
8. Sanna E, Busonero F, Talani G, Mostallino MC, Mura ML, Pisu MG, Maciocco E, Serra M, Biggio G. (2005) Low tolerance and dependence liabilities of Etizolam: molecular, functional, and pharmacological correlates. Eur J Pharmacol. 519: 31-42. 9. Monograph of Etizolam generated by The Drug Enforcement
Administration’s Special Testing and Research Laboratory; USA Department of Justice. http://www.swgdrug.org/Monographs/Etizolam.pdf). 10. Gupta S and Garg B. (2014) A case of etizolam dependence.
Indian J Pharmacol. 46: 655-656.
11. Sanna E, Pau D, Tuveri F, Massa F, Maciocco E, Acquas C, Floris C, Fontana SN, Maira G, Biggio G: Molecular and neurochemical evaluation of the effects of Etizolam on GABA receptors under normal and stress conditions! Arznimittelforschung. 1999 Feb; 49(2): 88-95.
12. 43. (2012). In Rang and Dale’s Pharmacology (7th ed., pp.