Research
Research
Research
Research
Research
Paper
Paper
Paper
Paper
Paper
Development and V
Development and V
Development and V
Development and V
Development and Validation of an HPLC Method for
alidation of an HPLC Method for
alidation of an HPLC Method for
alidation of an HPLC Method for
alidation of an HPLC Method for
Analysis of Etoricoxib in Human Plasma
Analysis of Etoricoxib in Human Plasma
Analysis of Etoricoxib in Human Plasma
Analysis of Etoricoxib in Human Plasma
Analysis of Etoricoxib in Human Plasma
U. MANDAL, D. SENTHIL RAJAN, A. BOSE, K. V. GOWDA, A. GHOSH AND T. K. PAL*
Bioequivalence Study Centre, Department of Pharmaceutical Technology, Jadavpur University, Kolkata-700 032, India.
A simple high-performance liquid chromatographic method for the determination of etoricoxib in human plasma has been developed. An aliquot quantity of 1 ml plasma sample was taken and 10 µµµµµl internal standard was added and mixed. Saturated borate solution of 0.3 ml was added to it and mixed for 1 minute followed by liquid-liquid extraction with ethyl acetate. Organic layer was separated and evaporated to dryness under nitrogen atmosphere at low temperature (below 50°). Residue was reconstituted with 150 µl of mobile phase. During the whole procedure the samples were protected from light. The assay was performed on Hypersil BDS, C18 (150×4.6 mm, 5 µµµµµ particle size) column, using 10 milimol ammonium acetate buffer:acetonitrile = 65:35 v/v as mobile phase with ultra violet detection at 235 nm. Lower limit of detection was 10 ng/ml and lower limit of quantitation was 20 ng/ml. Maximum between-run precision was 7.94%. Mean extraction recovery was found to be 79.53 to 85.70%. Stability study showed that after three freeze-thaw cycles the loss of three quality control samples were less than 10%. Samples were stable at room temperature for 12 h and at -20° for 3 months. Before injecting onto HPLC system, the processed samples were stable for at least 8 h. The method was used to perform bioequivalence study in human.
Non-steroid antiinflammatory drugs (NSAID) are widely absorption without affecting the extent of absorption of used in clinical practice for the treatment of pain, etoricoxib; therefore, Etoricoxib can be dosed inflammation and fever. The pharmacological effects of irrespective of food7.
these drugs are due to their ability to block prostaglandin
synthesis by inhibiting the enzyme cyclooxygenase The numbers of published method for analyzing (COX)1-4. COX exists in two isoforms in man, COX-1 and etoricoxib in plasma are very few. Matthews et al.8
COX-2. COX-1 is required for many physiologic described a solid phase extraction of etoricoxib from housekeeping functions, such as protection of the gastric plasma using a 96 well plate format followed by reverse-mucosa, maintenance of renal homeostatic and platelet phase HPLC in a system equipped with a post column aggregation. Conversely, COX-2 is responsible for the photochemical reactor and a fluorescence detector. So synthesis of prostaglandins, which mediate responses to there is still the need of simple, sensitive method for pathologic processes such as pain, fever and inflammation. analyzing the same in plasma. This paper describes a Etoricoxib is a selective inhibitor of COX-2 that is used method of analyzing etoricoxib in plasma, which is very for the treatment of osteoarthritis, rheumatoid arthritis and simple as well as sensitive using UV detector. The pain5. Etoricoxib is 5-chloro-6'-methyl-3-[4-(methyl - method was validated according to procedures and
sulfonyl) phenyl]-2, 3' -bipyridine. acceptance criteria based on FDA guidelines and recommendations of ICH9-10.
Etoricoxib administered as a tablet is rapidly and
completely absorbed and available; the absolute MATERIALS AND METHODS
bioavailability is estimated to be 100%. It is metabolized
extensively via oxidation 6' -methyl hydroxylation and 1'- Etoricoxib was obtained from Glenmark Pharmaceutical N-oxidation. These metabolites are excreted largely in Ltd., Mumbai and valdecoxib from Virdev Intermediate, the urine6. A high-fat meal decreased the rate of Surat. Acetonitrile and water for the mobile phase were
of chromatographic grade (Make-Qualigens Fine
*For correspondence Chemicals, Mumbai). All other reagents were of analytical
Chromatographic conditions:
The HPLC apparatus consisted of a Knauer (Germany) Model, K-1001 HPLC pump, K-2501 variable wave length UV detector and Eurochrom 2000 software. RP-HPLC analysis was performed using a BDS Hypersil C18 (average particle size 5 µ) column (150 mm, 4.6 mm). The mobile phase consisting of 65 volume of 10 milimol ammonium acetate buffer and 35 volume of acetonitrile. The mobile phase was filtered through 0.45 µm membrane filter. The eluent was monitored with a UV detector set at 235 nm with a flow rate of 1 ml/min and sample size of 20 µl was carried out at room temperature all over the study.
Sample preparation:
An aliquot quantity of 1 ml of plasma spiked with etoricoxib raw drug was taken in a stoppered test tube. To this 10 µl of 150 µg/ml of internal standard (valdecoxib in acetonitrile) was added and mixed well. Saturated borate solution of 0.3 ml was added to this and mixed for 1 min. This mixture was extracted with 6 ml of ethyl acetate by shaking for 10 min followed by centrifugation for three minutes at 3000 rpm. The organic layer was removed in a separate centrifuge tube with cap. The resulting organic layer was evaporated to dryness in water bath in presence of nitrogen atmosphere at low temperature (below 50°). The residue was reconstituted with 150 µl of mobile phase and the same was injected onto HPLC for chromatographic analysis. During the whole procedure the samples were protected from light.
Method validation:
Stock solutions of etoricoxib and internal standard were prepared in acetonitrile as 1 mg/ml for both and kept at -20°. Working solutions were prepared by diluting the stock solutions with mobile phase. For calibration curve eight different concentrations (20, 50, 100, 200, 500, 1000, 1500 and 2500 ng/ml) in plasma were prepared by adding required volume of working solution of analyte to blank plasma. For internal standard the final concentration in plasma was 1500 ng/ml. The plasma samples were subjected to the sample preparation procedure and injected onto HPLC. Plasma calibration curve was prepared by taking area ratio of analyte to internal standard as Y-axis and concentration of analyte (ng/ml) as X-axis. Six replicates of calibration curve were prepared taking each concentration for six times.
The limit of quantitation (LOQ) and limit of detection (LOD):
The limit of quantitation (LOQ) and Limit of detection
(LOD) were determined from the peak signal and noise level (S/N) as ten and three times the baseline noise, respectively.
Extraction recovery:
The extraction recovery of analyte was determined by measuring the peak areas of the drug from the prepared plasma quality control samples. 30 ng/ml, 1200 ng/ml and 2000 ng/ml plasma samples were taken as LQC (low quality control), MQC (medium quality control) and HQC (high quality control) samples respectively. The peak areas of extracted LQC, MQC and HQC were compared to the absolute peak area of the unextracted samples containing the same concentration of the drug as 100%. To obtain good extraction efficiency the extraction recovery of etoricoxib was determined using five replicates of each QC samples.
Accuracy and precision:
Precision and accuracy were also determined from LQC (30 ng/ml), MQC (1200 ng/ml) and HQC (2000 ng/ml). Five replicates of each concentration were analysed on the same day to determine the within-run accuracy and precision of the method. To confirm the between-run accuracy and precision five replicates of each concentration on the first day and four replicates of each concentration on second day and third day were analysed.
Stability study:
The stability of etoricoxib in plasma was evaluated with four studies; a short-term stability study, a long-term stability study, a freeze thaw study and stability in processed sample. Plasma blank samples were spiked with etoricoxib at concentration of 30 ng/ml (LQC), 1200 ng/ml (MQC) and 2000 ng/ml (HQC) and each concentration was carried out for five times. Plasma samples were extracted and subsequent HPLC analysis was carried out as described previously.
sample ready for injection was determined at three levels of concentration, 30 ng/ml (LQC), 1200 ng/ml (MQC) and 2000 ng/ml (HQC). The processed QC samples ready for injection were kept for 8 h before HPLC analysis.
Pharmacokinetic parameters:
The above mentioned bioanalytical method was used in bioequivalence study of etoricoxib. The study was approved by the ethics committee of Jadavpur University, Kolkata, India. It was an open, randomized crossover study to asses relative bioavailability of etoricoxib in twelve healthy male volunteers following single dose administration of etoricoxib 120 mg tablet.Test preparation was etoricoxib 120 mg tablet manufactured by Vivek Pharmachem (India) Ltd., Jaypur. Tablet Ebov containing 120 mg of etoricoxib, manufactured by Glenmark Pharmaceutical Ltd., Mumbai, was used as Reference preparation. The pharmacokinetic parameters like area under the plasma-concentration–time curve from time zero to the last measurable etoricoxib sample time and to infinity (AUC0-t and AUC0-inf), maximum concentration (Cmax), time to maximum concentration (Tmax), elimination rate constant (Kel) and elimination half-life(t1/2) were determined for the period of 0 to 120 h by non compartmental method.
RESULTS AND DISCUSSION
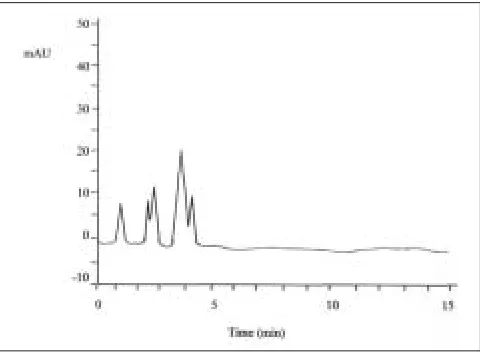
Representative chromatogram of blank plasma and plasma spiked with etoricoxib and internal standard are shown in figs. 1 and 2, respectively. Retention time for the etoricoxib and internal standard were 5.975 min and 11.015 min, respectively. No interfering peaks at these times were found in the chromatogram obtained from blank plasma. Good separation and baselines with low background noise were observed. The chromatographic run time was 15 minutes for plasma sample analysis. The linearity of the calibration curve was evaluated by calculating the r2 (regression coefficient) value. The
standard curves of etoricoxib in human plasma were linear over the ranges of 20 to 2500 ng/ml and the regression coefficients (r2) were over 0.998 from each
standard curve of six separate runs.
The limit of detection defined as three times the base noise was 10 ng/ml for this analytical method and the limit of quantitation defined as ten times the base noise was 20 ng/ml (n=13, SD=1.08)
Within- and between-run precision and accuracy of the method was assed by analyzing the QC samples spiked
Fig. 1: Representative chromatogram of blank plasma Representative chromatogram of blank plasma showing no peaks at 5.975 min and 11.015 min which indicates the absence of interfering substances in the retention time of etoricoxib and internal standard.
Fig. 2: Representative chromatogram of plasma spiked with etoricoxib and internal standard.
Representative chromatogram of plasma spiked with etoricoxib and internal standard showing the separation of etoricoxib at 5.975 min and internal standard at 11.015 min.
with known amount of etoricoxib according to the procedure described in the previous section. Results are shown in Table 1 and 2. The accuracy of this bioanalytical method for within- and between-run was from 99.86 to 101.93% and from 100.15 to 107.92%, respectively. The within- and between-run precision ranged from 0.38 to 1.38% and from 0.34 to 7.94%, respectively.
TABLE 1: WITHIN-RUN ACCURACY AND PRECISION OF THE ANALYTICAL METHOD FOR ETORICOXIB
Q. C. Samples LQC MQC HQC
Concentration spiked (ng/ml) 30 1200 2000
Concentration found 32.58 1198.43 2006.02
S.D. 0.02 16.59 7.65
C.V.% 0.65 1.38 0.38
% Nominal 101.93 99.86 100.30
LQC, MQC, HQC are low quality control, medium quality control, high quality control samples of 30, 1200 and 2000 ng/ml. Data obtained are average of five observations (n= 5) where SD means Standard Deviation, CV% (precision) means coefficient of variation calculated as (SD/Mean concentration found)×100 and% nominal means accuracy which is calculated as (Concentration found/ Concentration spiked)×00.
TABLE 2: BETWEEN-RUN ACCURACY AND PRECISION OF THE ANALYTICAL METHOD FOR ETORICOXIB
Q. C. Samples LQC MQC HQC
Concentration spiked (ng/ml) 30 1200 2000
Concentration found 32.38 1201.75 2005.16
S.D. 2.57 15.77 6.81
C.V.% 7.94 1.31 0.34
% Nominal 107.92 100.15 100.26
LQC, MQC, HQC are low quality control, medium quality control, high quality control samples of 30, 1200 and 2000 ng/ml. Data obtained are average of thirteen observations (n= 13) where SD means Standard Deviation, CV% (precision) means Coefficient of Variation calculated as (SD/Mean concentration found) ×100 and % nominal means accuracy which is calculated as (Concentration found/ Concentration spiked) ×100.
The stability of etoricoxib in plasma was determined under various conditions according to the procedure described in the earlier section. Short-term stability test performed at room temperature showed that three QC samples were stable for 12 h (mean recoveries were 93.46%, 98.69% and 95.23% at LQC, MQC and HQC, respectively).
The long- term stability results indicated that etoricoxib samples were stable during 2 months, with an average recovery of 94.08%. No significant decrease of etoricoxib concentration in plasma was detected after exposing samples to three freeze/thaw cycles and mean recovery was found to be 94.57%. Finally, the stability in the processed sample ready for injection was also determined. Result showed that three QC samples were stable at least for 8 h with loss not higher than 10%.
The above mentioned bioanalytical method was used in the plasma analysis of a bioequivalence study of etoricoxib as described in the earlier section. Fig. 3 shows the mean plasma level of etoricoxib for test and reference preparation after the oral administration of a single dose 120 mg of etoricoxib in 12 healthy human volunteers. Maximum plasma concentration (Cmax) ranged from 1946.39 to 2393.99 ng/ml at 1.042 to 1.250 h (tmax).
0 500 1000 1500 2000 2500
0 0.5 1 1.5 2 3 4 6 10 18 30 42 72 120
Time (h) E tor ic oxi b (ng/ m l)
Fig. 3: Mean plasma concentration-time curve for test (-♦♦♦♦♦-) and reference (-�-) preparation following single oral administration of etoricoxib 120 mg tablet in 12 healthy volunteers
The half life (t1/2) ranged from 29.26 to 33.91 h. Also the mean value of area under the concentration time curve (AUC0-t) obtained was 31342.32±5790.03 ng×h/ml and AUC0-inf was found to be 33672.37±7412.74 ngxh/ml. Relative bioavailability of test preparation was 98.03% to that of reference preparation and both the products were bioequivalent.
From the above discussion it is found that the analytical method for analysis of etoricoxib in plasma is simple, rapid and sensitive. The main advantage of this method is the use of liquid-liquid extraction procedure for sample preparation, which is easy and fast. It also uses UV detection, which is less costly than LC-MS (Liquid chromatography coupled with mass spectrometry). It can be used as a reliable assay method in the study of Pharmacokinetics of etoricoxib as well as bioavailability / bioequivalence study.
ACKNOWLEDGEMENTS
The authors would like to acknowledge the financial support by All India Council For Technical Education (AICTE), India to carry out this project through their Grant No. 1-10/NDF (PG)/JU (02)/2004-05.
REFERENCES
1. Donnely, M.T. and Hawkey C.J., Aliment Pharmacol. Ther., 1997, 11, 227.
2. Jouzeau, J.Y., Terlain, B. and Abid, A., Drugs, 1997, 53,563. 3. Mitchell, J.A., Akarasereenont, P. and Thiemermann, C., Proc. Natl.
Acad. Sci. USA, 1994, 90, 11693.
5. Riendeau, D. Percival, M.D. and Brideau, C., J. Pharmacol. Exp. 10. ICH Harmonised Tripartite Guidance for Validation of Analytical
Ther., 2001, 296, 558. procedures: Methodology, 1996.
6. Rodrigues, A.D., Halpin, A.R. and Geer, L.A., Amer. Soc.
Pharmacol. Exp. Ther., 2003, 31, 224.
7. Agrawal, N.G.B., Porras, A.G. and Matthews, C.Z., J. Clin.
Pharmacol., 2001, 41,1106. Accepted 25 July 2006
8. Matthews, C.Z., Woolf, E.J. and Lin, L., J. Chromatogr. B Revised 11 November 2005
9.
Biomed. Sci. Appl., 2001, 751, 237.
Bioanalytical Method validation guidance for Industry, CDER, FDA, US Department of Health and Human Services, Rockville, MD 2001.