ESTABLISHING A CORRELATION BETWEEN ABSOLUTE VISCOSITY
AND APPARENT VISCOSITY FOR A VISCOSITY GRADE UNMODIFIED
BITUMEN USED FOR ROAD CONSTRUCTION IN INDIA
Syed Mubashirhussain1, Venkaiah Chowdary21
1, 2 Transportation Division, Department of Civil Engineering, National Institute of Technology, Warangal, Telangana, India
Received 10 December 2018; accepted 6 January 2019
Abstract: Viscosity grading is currently being practiced in India for the construction of roads where absolute viscosity at 60°C is used as the prime parameter to grade the unmodified bituminous binders apart from other basic properties. It is well known that the unmodified bituminous binders exhibit non-Newtonian characteristics at 60°C. This study focuses on determining the absolute viscosity and the apparent viscosity of a particular grade of bitumen sampled from three different bitumen barrels. The absolute viscosity was measured in accordance with Bureau of Indian standards by a vacuum capillary viscometer using three different tubes including one original Cannon-Manning tube, and two other locally manufactured tubes that were calibrated using the original Cannon-Manning tube. Most of the tubes currently being used in India were manufactured locally and were calibrated with the original Cannon-Manning tube. This resulted in higher variability across the absolute viscosity measured using various tubes. This work tries to quantify such variability and also correlates the absolute viscosity with the apparent viscosity measured using a rotational viscometer. Further, a specific test protocol was adopted to eliminate the time dependency of the binder.
Keywords: absolute viscosity, apparent viscosity, bitumen, Cannon-Manning tube, road construction, viscosity grading.
2 Corresponding author: [email protected]
1. Introduction
The demand for road transportation is increasing at a faster rate in India and the current transport sector is not able to keep pace with the rise in demand which in turn is affecting the economy (World Bank, 2018). This is mainly due to the fact that the current length of National Highway network in India is only 115,435 km (NHAI, 2018). Even though these National Highways constitute to only two percent of the total road network,
fractional distillation of crude oil (Sorensen and Wichert, 2012). It is a hydro carbon and is refined to form a stable substance which is semi solid in nature at room temperature. Bitumen has been extensively used in the construction of the pavements (Krishnan and Rajagopal, 2003). Initially, bitumen was graded and labelled as hard or soft by chewing a small amount of the material. This process of grading the bitumen as hard or soft was highly subjective because the response of a material as being hard or soft upon chewing depends upon the perception of a person grading the bitumen and this perception changes from person to person. Later, at the start of the 20th century, penetration
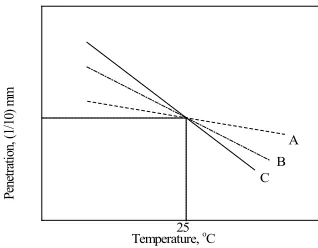
grading of bitumen was developed by the American Society of Testing and Materials (ASTM) by forming a committee known as ASTM D 04 (ASTM, 2018). The penetration test consists of measuring the vertical distance a standard needle with a load of 100 grams penetrates the bitumen sample maintained at 25°C for a period of 5 seconds. This distance is then expressed in one tenth of a mm. Penetration test is empirical in nature and has its problems. Figure 1 shows a typical problem one can encounter when different sources of bitumen binders (A, B, and C) that are graded with penetration method. Here, the samples A, B and C exhibit the same penetration value at 25°C but have considerable variations at higher and lower temperatures. Later, in the 1960’s, grading of bitumen was done based upon the viscosity measured at 60 °C using the Cannon-Manning vacuum capillary viscometer. Viscosity is defined as the internal friction between the molecules of a material. This viscosity was termed as the absolute viscosity measured at 60 °C. The viscosity grading was first adopted in India in the year 2006 (IS 73, 2006) and subsequently
these specifications were later modified in the year 2013 (IS 73, 2013). Currently in the United States, grading of bituminous binders is done based on the Superpave performance grading specifications that in turn are based upon several rheological properties of the bitumen binders. Since the performance grading of bitumen binders is not followed in India as of now and some of the researchers (Reashma et al., 2014; Reashma et al., 2017) are working rigorously towards the introduction of performance grading in India, this study deals only with the intricacies of grading bitumen binders by the method of viscosity grading. Bitumen is highly temperature susceptible material where the response characteristics vary drastically from a solid-like behaviour to a f luid-like behaviour with rise in temperature. ASTM D6373 (2015) specifies measuring the viscosity of the binders at 135°C using number 21 spindle at 20 RPM for soft binders and number 27 spindle at 20 RPM for stiffer binders. Specification of the spindle number and shear rates even at 135°C indicates the possible non-Newtonian characteristics. However, IS:73 (2013) specifies measuring the absolute viscosity of the bitumen using vacuum capillary viscometer at 60°C, that is, the expected maximum pavement temperature. At 60°C, bituminous binders exhibit non-Newtonian response where the viscosity depends also on the applied shear rate (Chowdary et al.,
25
B C
Pe
ne
tra
tion,
(1/
10)
m
m
Temperature, oC
A
Fig. 1.
Variation of Penetration of Same Grade Binders at High and Low Temperatures
2. Experimental Work
2.1. Materials
VG20 grade bitumen sampled from three different barrels was used for this study. Henceforth, these three binders will be termed as B-1, B-2 and B-3. Where, “B” represents the barrel and the numeral represents the particular barrel number.
2.2. Determination of Absolute Viscosity
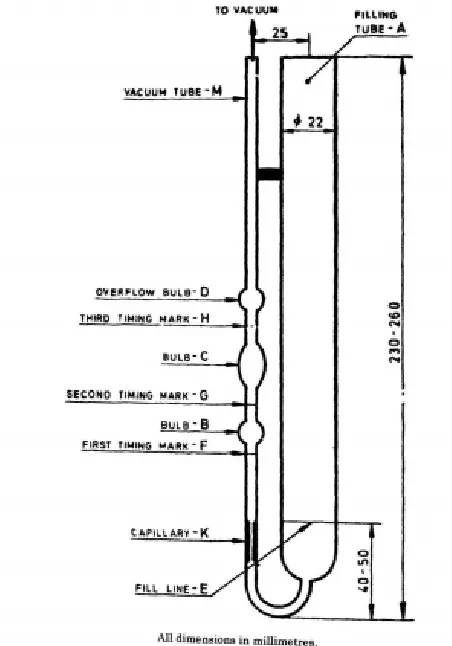
The absolute viscosity of the three VG20 binders was determined in accordance with Bureau of Indian Standards test protocol IS-1206 (1978) by a vacuum capillary viscometer. This method is similar to the protocol specified by ASTM D2171 (2010). The absolute viscosity of bitumen at 60°C is the measure of the time taken for bitumen in the U-tube to move through a fixed position under a pressure of 300 mm of Hg. In order to measure the absolute viscosity using the vacuum capillary viscometer, three different sets of U-tubes were used. A typical representation of the vacuum capillary viscometer U-tube is shown in Figure 2. Out of the three tubes used in this study,
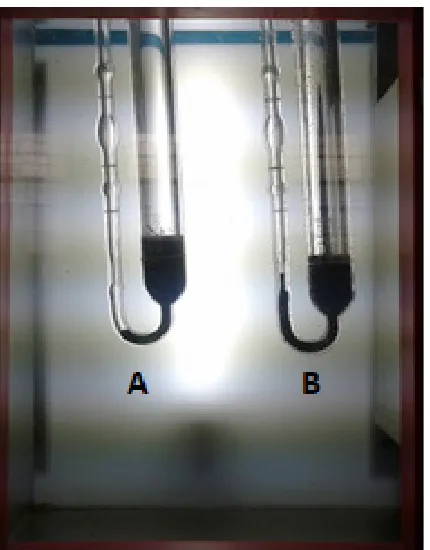
one tube is the original Cannon-Manning tube whereas the remaining two tubes shown in Figure 3 were manufactured locally and were calibrated by the same manufacturer using the original Cannon-Manning tube. Hereafter, these two locally manufactured tubes will be termed as Tube-A and Tube-B. It is important to note here that, most of the users in India depend on the locally manufactured U-tubes as these tubes are priced very low and can easily be replaced due to accidental breakage. The calibration factors for each U-tube provided by the local manufacturer are questionable as there is significantly higher variability observed for a specific tube size (any of 10 to 14 tube sizes) for the same grade of bitumen sampled from the same barrel.
2.3. Determination of Apparent Viscosity
SC4-27 spindle for a duration of 85 seconds. The shear rates were selected such that the resulting torque was between 10% and 95%. The spindle was carefully inserted and the sample was allowed to equilibrate to the test temperature for a period of 15 minutes after the insertion of the spindle. Enough care was taken while inserting the spindle into the bitumen sample at 60°C as the binder viscosity would be substantially higher.
Sufficiently longer duration of time was given such that the spindle penetrates into the bitumen sample to the required depth on its own self weight without application of any external pressure. The 85 seconds of shearing duration was determined after a trial and error procedure. All the three binders (B-1, B2, and B-3) achieved steady state of shear stress after a shearing duration of 85 seconds.
Fig. 2.
Fig. 3.
Locally Manufactured Vacuum Capillary U-Tubes Source: (Own Source)
Fig. 4.
3. Results and Discussion
3.1. Absolute Viscosity Test Results
The results obtained using the original Cannon-Manning viscometer tube are shown in Table 1 and the results obtained using the calibrated U-tubes are shown in Table 2. The permissible range of absolute viscosity for VG20 binders as per IS:73 (2013) is 1600 to 2400 Poise. Here, VG represents the viscosity grade and the index “20” represents the absolute viscosity of 2000 Poise. A tolerance of ±20% is considered in IS:73 (2013) resulting in the corresponding absolute viscosity tolerance of ±400 Poise for VG20 bitumen and the subsequent range is 1600 to 2400 Poise. From the Table 1, it is clear that the absolute viscosity measured using the original Cannon-Manning tube satisfied the VG20 grading specification as discussed above. It can be seen from Table 1 that the absolute viscosity is highest for B-3 followed by B-2 and B-1. However, the trends observed for these three VG-20 binders (B-1, B-2, and B-3) are completely different when measured using the locally manufactured U-tubes as shown in Table 2. If the absolute viscosities obtained using a particular tube as shown in Table 2 are carefully observed, it can be seen that the absolute viscosities for a particular tube are very close. This clearly shows that the locally manufactured tubes could not differentiate between the absolute viscosities obtained from the three different barrels of the same grade. Further, there is no specific trends observed in absolute viscosities measured using the locally manufactured tubes as observed clearly for the original Cannon-Manning tube. It is also to be noted from Table 2 that there is a considerable difference in the absolute viscosities measured by both
Table 1
Absolute Viscosity obtained from the Original Cannon-Manning Viscometer Binder Absolute viscosity, Poise
B-1 1606
B-2 1873
B-3 2026
Table 2
Absolute Viscosity obtained from the Calibrated U-Tubes
Binder Absolute viscosity, Poise
Tube -A Tube -B
B-1 1255 1785
B-2 1249 1708
B-3 1321 1758
3.2. Apparent Viscosity Test Results
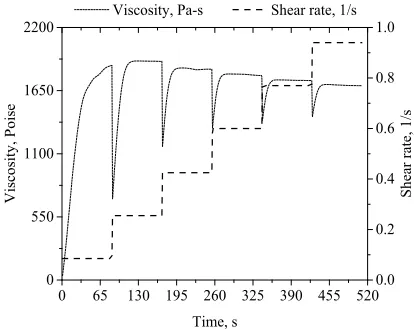
The apparent viscosity measured using the rotational viscometer for all the three VG20 binders sampled from three different barrels B-1, B-2, and B-3 at various shear rates are shown in Figures
5 to 7, respectively. It can be seen that the viscosity values stabilized for all the three VG20 binders much before the shearing time reached 85s. It is to note here that for the shear rates shown in Figures 5 to 7, the minimum and maximum torques varied between 9.4% to 94.8%.
0 65 130 195 260 325 390 455 520 0
550 1100 1650
2200 Viscosity, Pa-s Shear rate, 1/s
Time, s
V
is
co
si
ty
, P
oi
se
0.0 0.2 0.4 0.6 0.8 1.0
Sh
ea
r ra
te
, 1
/s
Fig. 5.
0 170 340 510 680 0
500 1000 1500 2000 2500
Viscosity, Pa-s Shear rate, 1/s
Time, s
V
is
co
si
ty
, P
oi
se
0.0 0.1 0.2 0.3 0.4 0.5 0.6 0.7
Sh
ea
r ra
te
, 1
/s
Fig. 6.
Variation of Shear Rate and Viscosity as a Function of Time for B-2 Binder
0 170 340 510 680
0 700 1400 2100
2800 Viscosity, Pa-s Shear rate, 1/s
Time, s
V
is
co
si
ty
, P
oi
se
0.0 0.1 0.2 0.3 0.4 0.5 0.6 0.7
Sh
ea
r ra
te
, 1
/s
Fig. 7.
Variation of Shear Rate and Viscosity as a Function of Time for B-3 Binder
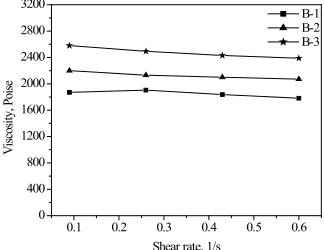
In order to check the shear dependency of the VG20 binders at 60°C, viscosities at 85s shearing time from Figures 5 to 7 were extracted for various shear rates and the variation in viscosity as a function of shear rates is shown in Figure 8. It can be seen from Figure 8 that the maximum variation in viscosities is observed to be 4.30% for
common shear rates of 0.09 1/s (0.25 RPM), 0.26 1/s (0.75 RPM), 0.43 1/s (1.25 RPM), and 0.60 1/s (1.75 RPM) are consolidated in Table 3. It can be observed from Table 3 that the apparent viscosities of B-1 and B-2 binders satisfied the specification limits of IS:73 (2013) whereas, the B-3 binder has apparent viscosity exceeding the upper limit at all the shear rates except at 0.60 1/s. It is important to note here that the logical trends as observed for absolute viscosities (see Table 1) measured using the vacuum capillary viscometer with original Cannon-Manning tube could be observed even for the apparent viscosities measured using the
rotational viscometer (see Table 3). That is, the apparent viscosity of B-3 is always higher followed by B-2 and B-1 binders. Similar to the absolute viscosity trends measured using the vacuum capillary viscometer equipped with original Cannon-Manning tube, the rotational viscometer also could clearly differentiate between the viscosities of the binders of same grade sampled from three different barrels. This shows that there is a correspondence between the absolute viscosities measured using the vacuum capillary viscometer with original Cannon-Manning tube and the apparent viscosities measured using the rotational viscometer.
0.1 0.2 0.3 0.4 0.5 0.6
0 400 800 1200 1600 2000 2400 2800 3200
Vis
co
sity
, P
ois
e
Shear rate, 1/s
B-1 B-2 B-3
Fig. 8.
Variation of Viscosity as a Function of Shear Rates for All the VG20 Binders
Table 3
Apparent Viscosity of the Three Binders from Rotational Viscometer
Shear rate, 1/s Apparent viscosity at 60°C, Poise
B-1 B-2 B-3
0.09 1870 2200 2580
0.26 1904 2130 2493
0.43 1837 2100 2430
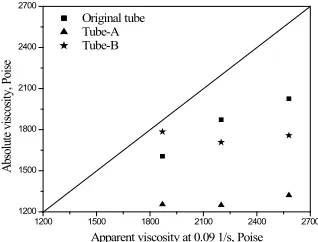
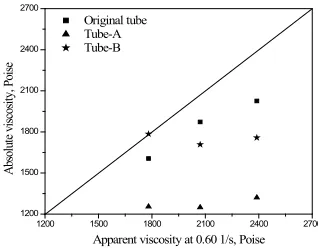
In order to check the correlations between the absolute viscosity measured used the vacuum capillary viscometer and the apparent viscosity measured using the rotational viscometer at various shear rates including 0.09 1/s, 0.26 1/s, 0.43 1/s, 0.60 1/s, and at all the shear rates together, plots are generated as shown in Figures 9 to 13, respectively. The Mean Absolute Percentage Error (MAPE) between the absolute viscosity and apparent viscosities at various shear rates are consolidated in Table 4. Ideally, if the data points shown
in Figures 9 to 13 falls on the 45° line with same x-axis and y-axis scales, then a perfect correlation exists between the absolute and the apparent viscosities. However, it can be seen from Table 4 that the MAPE decreased with increase in shear rates especially for the original Cannon-Manning tube and a lowest MAPE of 13.13% is observed at a shear rate of 0.60 1/s. It is important to recall here that the apparent viscosities are well within the specification limits of IS:73 (2013) for the VG20 binder including the B-3 binder at a shear rate of 0.60 1/s.
1200 1500 1800 2100 2400 2700 1200
1500 1800 2100 2400 2700
Abs
olut
e vi
sc
os
ity
, P
ois
e
Apparent viscosity at 0.09 1/s, Poise Original tube
Tube-A Tube-B
Fig. 9.
Correlation between Absolute Viscosity and Apparent Viscosity at a Shear Rate of 0.09 1/S
1200 1500 1800 2100 2400 2700 1200
1500 1800 2100 2400 2700
Abs
olut
e vi
sc
os
ity
, P
ois
e
Apparent viscosity at 0.26 1/s, Poise Original tube
Tube-A Tube-B
Fig. 10.
1200 1500 1800 2100 2400 2700 1200
1500 1800 2100 2400 2700
Abs
olut
e vi
sc
os
ity
, P
ois
e
Apparent viscosity at 0.43 1/s, Poise Original tube
Tube-A Tube-B
Fig. 11.
Correlation between Absolute Viscosity and Apparent Viscosity at a Shear Rate of 0.43 1/S
1200 1500 1800 2100 2400 2700 1200
1500 1800 2100 2400 2700
Abs
olut
e vi
sc
os
ity
, P
ois
e
Apparent viscosity at 0.60 1/s, Poise Original tube
Tube-A Tube-B
Fig. 12.
Correlation between Absolute Viscosity and Apparent Viscosity at a Shear Rate Of 0.60 1/S
1200 1500 1800 2100 2400 2700 1200
1500 1800 2100 2400 2700
Abs
olut
e vi
sc
os
ity
, P
ois
e
Apparent viscosity, Poise Original tube
Tube-A Tube-B
Fig. 13.
Table 4
MAPE between Absolute Viscosity and Apparent Viscosity
Viscometer tube 0.09 0.26 Shear rate, 1/s0.43 0.60 All
Original tube 16.82 15.48 13.34 13.13 14.29
Tube-A 41.64 40.82 39.28 43.12 39.93
Tube-B 19.59 18.51 16.38 16.92 17.30
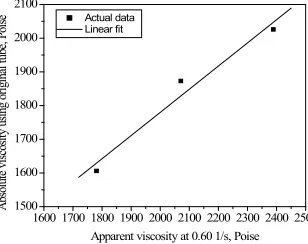
Considering the lowest MAPE, a relationship is developed between the absolute viscosity measured using the vacuum capillary viscometer equipped with the original Cannon-Manning U-tube and the apparent viscosity measured using the rotational viscometer at a shear rate of 0.60 1/s as shown in Figure 14. A strong correlation with a coefficient of correlation of 0.98 exists between the absolute viscosity and apparent viscosity as represented by Equation (1). Further, to check the influence of the shear dependency of the material, a correlation is established between the absolute viscosity measured using the vacuum capillary viscometer and the apparent viscosity measured using the rotational viscometer at all the shear rates as shown in Figure 13. Here, the overall MAPE is obtained as 14.29% which is slightly higher than that observed at a specific shear rate of 0.60 1/s. Thus, another relationship is developed between the absolute viscosity measured using
the vacuum capillary viscometer equipped with the original Cannon-Manning U-tube and the apparent viscosity measured using the rotational viscometer at all the shear rates as shown in Figure 15. A relatively less-strong correlation with a coefficient of correlation of 0.95 exists between the absolute viscosity and apparent viscosity as represented by Equation (2). The advantage of Equation (2) is that it is independent of the applied shear rates. Thus, using Equations (1) and (2), if the apparent viscosity is measured using the rotational viscometer, the corresponding absolute viscosity can be obtained that conforms with IS:73 (2013) specifications.
Absolute viscosity = 404.93 + 0.69 x Apparent viscosity at 0.60 1/s. (1) Absolute viscosity = 477.85 + 0.63 x
Apparent viscosity. (2)
1600 1700 1800 1900 2000 2100 2200 2300 2400 2500 1500
1600 1700 1800 1900 2000 2100
Abs
olut
e vi
sc
os
ity
us
ing or
igi
na
l t
ube
, P
ois
e
Apparent viscosity at 0.60 1/s, Poise Actual data
Linear fit
Fig. 14.
1600 1700 1800 1900 2000 2100 2200 2300 2400 2500 2600 1500
1600 1700 1800 1900 2000 2100
Abs
olut
e vi
sc
os
ity
us
ing or
igi
na
l t
ube
, P
ois
e
Apparent viscosity at all shear rates, Poise Actual data
Linear fit
Fig. 15.
Linear Relationship between Apparent Viscosity at All Shear Rates and Absolute Viscosity Measured Using Vacuum Capillary Viscometer with Original Cannon-Manning Tube
4. Conclusions
The original Cannon-Manning U-tube grades all the three binders (B-1, B-2 and B-3) as VG20. Moreover, the original Cannon-Manning U-tube showed that there is a considerable difference in the absolute viscosity among the three binders with the binder B-3 having the highest absolute viscosity followed by B-2 and B-1 respectively. This result shows that there would be a considerable difference in the various other rheological properties of bituminous binders even though they may represent the same grade.
The results obtained from the locally manufactured U-tubes, however, are completely different. Both the locally ma nu fac t u red t ubes a re u nable to differentiate between the three binders. Also, only the Tube-B was able to grade the binders as VG20 whereas the Tube-A resulted in absolute viscosity conforming to neither VG10 nor VG20. Both these findings indicate the inability of the locally calibrated U-tubes to accurately determine the absolute viscosity of the bituminous binders, however the latter is of utmost concern since the two
tubes were manufactured and calibrated by the same manufacturer.
Because of a strong underlying relationship that is established between the absolute viscosity determined using the original Cannon-Manning viscometer and the apparent viscosity determined using the rotational viscometer at 60°C, the equations proposed in this study helps the users to calculate the absolute viscosity of the binder from the apparent viscosity. Thus, suitable grade of binder can be selected for the construction of roads depending upon the local climatic conditions.
Acknowledgements
The authors gratefully acknowledge the support provided by Prof. J. Murali Krishnan, Department of Civil Engineering, Indian Institute of Technology Madras, Chennai, Tamil Nadu, India for cross checking the bitumen properties at their laboratory.
References
ASTM D2171. 2010. Standard Test Method for Viscosity of Asphalts by Vacuum Capillary Viscometer. ASTM International, 100 Barr Harbor Drive, West Conshohocken, PA, USA.
ASTM D4402M. 2015. Standard Test Method for Viscosity Determination of Asphalt at Elevated Temperatures Using a Rotational Viscometer. ASTM International, 100 Barr Harbor Drive, West Conshohocken, PA, USA.
ASTM D6373. 2015. Standard Specification for Performance Graded A sphalt Binder. ASTM International, 10 0 Barr Harbor Drive, West Conshohocken, PA, USA.
ASTM. 2018. History of ASTM Committee D04 on Road and Paving Materials, 1903-2003. Available from internet: <https://www.astm.org/SNEWS/ SEPTEMBER_2003/kandhal_sep03.html>.
Chowdary, V.; Thushara, K.T.; Asif, K.A.; Krishnan, J.M. 2007. Experimental verification of the evolution of internal structure of asphalt and modified asphalt [CD]. In Proceedings of 4th International SIIV Congress on Advances in Transport Infrastructures and Stakeholders Expectations.
IS 1206. 1978. Methods for Testing Tar and Bituminous Materials: Determination of viscosity - Part II Absolute Viscosity. Bureau of Indian Standards. Manak Bhavan, 9 Bahadur Shah Zafar Marg, New Delhi.
IS 73. 2006. Paving Bitumen – Specifications, Bureau of Indian Standards, Third revision. Manak Bhavan, 9 Bahadur Shah Zafar Marg, New Delhi.
IS 73. 2013. Paving Bitumen – Specifications, Bureau of Indian Standards, Fourth revision. Manak Bhavan, 9 Bahadur Shah Zafar Marg, New Delhi.
Krishnan, J.M.; Rajagopal, K.R. 2003. A review of the uses and modelling of bitumen from ancient to modern times, ASME Applied Mechanics Review 56(2): 149-214.
NHAI. 2018. National Highways Authority of India. Available from internet: <http://www.nhai.org/about-nhdp.htm>.
Reashma, P.S.; Nivitha, M.R.; Veeraragavan, A.; Krishnan, J.M. 2014. Development of unmodified binder specifications for India, Journal of the Association of Asphalt Paving Technologists 83: 653-669.
Reashma, P.S.; Nivitha, M.R.; Veeraragavan, A.; Sikdar, P.K.; Krishnan, J.M. 2017. Development of unmodified binder specifications for India, Transportation in Developing Economies 3(2): 12.
Sorensen, A.; Wichert, B. 2012. Asphalt and Bitumen. Wiley-VCH Verlag GmbH & Co., KGaA, Weinheim, Germany.