Sharif University of Technology
Scientia IranicaTransactions A: Civil Engineering www.scientiairanica.com
Comparison of three-dimensional and two-dimensional
axisymmetric nite element analyses of a corner section
of a tailings dam
M. Auchar Zardari
a;, H. Mattsson
b, S. Knutsson
band L. Ormann
ca. Department of Civil Engineering, Quaid-e-Awam University of Engineering Science and Technology, Nawabshah, Pakistan. b. Department of Civil, Environmental and Natural Resources Engineering, Lulea University of Technology, SE-97187 Lulea,
Sweden.
c. Fortum, Power Division, Renewable Energy, Vaxnasgatan 10, Box 2087, SE-65002 Karlstad, Sweden. Received 9 December 2015; received in revised form 14 May 2016; accepted 8 August 2016
KEYWORDS Tailings dam; Corner; Finite element analysis; Internal erosion; Consolidation; Slope stability.
Abstract. This paper presents three-dimensional (3D) and two-dimensional (2D) axisymmetric nite element analyses of a corner of a tailings dam. The analyses were performed to: (i) locate tension and/or low-compression zones and evaluate slope stability during sequential raising of the dam corner, and (ii) nd whether the results of 2D axisymmetric analyses could be reliable for the dam corner. The corner is a potentially weak section of the dam, where tension and/or low-compression zones may develop. Development of such zones inside the dam corner can lead to cracks and initiation of internal erosion. The results of both the 3D and 2D axisymmetric analyses indicated that (i) tension and/or low-compression zones were located in vicinity of surface of the dam corner mainly above the phreatic level, and (ii) the dam corner was stable up to the planned height if it was gradually strengthened with rockll berms on the downstream side. The results of 2D axisymmetric analyses showed a fairly good agreement with those of 3D analyses. It is concluded that 2D axisymmetric analyses are appropriate for this dam corner. This implies that signicant computational time can be saved by utilizing 2D analyses instead of 3D analyses.
© 2017 Sharif University of Technology. All rights reserved.
1. Introduction
A corner of the Aitik tailings dam is the subject of this study. The dam is situated in the north of Sweden. The dam corner is being raised with an upstream construction method (see e.g. [1]). The deposited tailings exert horizontal pressure on the inside of the curvature of the dam corner. This horizontal pressure
*. Corresponding author. Tel.: 00923331225200
E-mail addresses: [email protected] (M. Auchar Zardari); [email protected] (H. Mattsson); [email protected] (S. Knutsson);
[email protected] (L. Ormann) doi: 10.24200/sci.2017.4157
is expected to increase due to additional raisings of the dam corner in future. Consequently, there may be a risk of developing tension zones and/or low-compression zones in the dam corner.
Cracks are likely to occur at tension zones and/or low-compression zones in the dam corner (see e.g. [2,3]). If the cracks appear in the transverse direction (i.e., perpendicular to the length of the dam corner), they can create a path for leakage through the embankment. Cracks in the dam corner can facilitate the process of internal erosion. The development of such cracks at internal portions of the dam corner can pose a potential risk to the stability of the dam corner.
It is pertinent to mention here a failure of the corner of the Ajka tailings pond in Hungary on October
4, 2010. In this incident, 0.6 million cubic meters of a mixture of red mud and water were released. As a consequence, ten people were killed and about 120 people were injured [4]. One possible cause of this failure was development of cracks at tension zones in the corner [5].
Three-dimensional (3D) nite element analyses and two dimensional (2D) axisymmetric nite element analyses were performed on the corner of the Aitik tailings dam. These analyses were carried out to locate tension zones and/or low-compression zones and to evaluate slope stability of the dam corner. The particular aim of these analyses was to compare the results of the 2D axisymmetric analyses with those of the 3D analyses in order to nd out the reliability of the 2D axisymmetric analyses.
It should be noted that there are some case studies about nite element analyses of tailings dams presented in the literature, (e.g., [6-17]. To the authors' knowledge, the validity of 2D axisymmetric analyses for a dam corner has not been addressed before.
Three-dimensional analyses are generally consid-ered to be useful for corners of embankments (see, e.g., [18-21]). A nite element program for three-dimensional models PLAXIS 3D [22] was utilized to simulate gradual raisings of the corner of Aitik tailings dam up to a height of 76 m. The gradual raisings of the dam corner were simulated in various stages. Each stage consisted of a raising phase and a consolidation phase.
The 3D analyses of the dam corner consumed much computational time. For this reason, the dam corner was also analysed with a 2D axisymmetric nite element model in the program PLAXIS 2D [23] in order to save computational time. The 2D axisymmetric model was chosen on the assumption that the dam corner resembled a nearly circular structure. This study was specically performed to validate the results of the 2D axisymmetric analyses.
2. The Aitik tailings dam
Aitik is a copper mine, which is located at about 15 km from Gallivare in the north of Sweden. The mine is owned by Boliden Mineral AB and is today one of the largest copper mines in Europe and the largest open pit mine in Sweden. The mining activities started in 1968. The annual production at the Aitik mine was about 34.3 million tonnes of ore in year 2012.
Tailings are the waste materials, which are pro-duced in slurry form during extraction of minerals from the ore. At Aitik, the tailings are pumped to the disposal area, where they are discharged by spigotting from the dam embankments. Based on the particle size, the tailings in the vicinity of embankments of the Aitik dam can be classied as silty ne sands according to
the European Standard EN ISO 14688-1:2002 [24] and as silty sands according to the unied soil classication system [25].
Figure 1 shows the tailings impoundment, which is spread over an area of 13 square kilometers. This impoundment consists of four dams A-B, C-D, E-F (including E-F2 extension), and G-H.
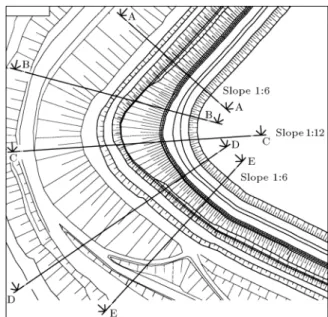
Figure 2 presents a plan view of the corner E-F/G-H, which is the subject of the study. The dam corner is being progressively raised in stages. The dam corner was 37 m high in year 2012. It is planned to raise the dam corner gradually up to a height of 76 m in year 2026. The corner ranges between the sections AA and EE (cf. Figure 2). The dam becomes almost straight after the two outer sections AA and EE. The downstream slope of the corner has been gradually attened out from 1:6 (at sections AA and EE) to 1:12 at the central section CC. For simplication, both the 3D analyses and 2D axisymmetric analyses were performed on the corner with a downstream slope of 1:6, which gives a conservative estimate for slope stability.
Figure 1. Aerial view of Aitik tailings dam and impoundment, amended from Google images [26].
3. The nite element models
The nite element programs PLAXIS 3D [22] and PLAXIS 2D [23] were utilized to analyse the dam cor-ner to identify tension zones and/or low-compression zones and to determine slope stability for gradual raisings of the dam. The 3D and 2D nite element models, construction schedule, and material properties of the dam corner are described below.
3.1. 3D nite element model
The region BBDD of the corner (cf. Figure 2), with some modications, has been chosen for the 3D analyses. Geometrically, this region is considered to be the most sensitive to the potential development of tension zones and/or low-compression zones compared to the other parts of the dam.
The dierent material zones are illustrated in the cross section of the dam corner in Figure 3. It was mentioned before that the tailings material zones 2, 4, 5, 6, 7, and 8 (cf. Figure 3) could be categorized as silty sands according to the unied soil classication system [25].
The elevation of the dam corner was +390 m in year 2012 (Figure 3). It was planned to raise the dam corner in several stages at the rates of (i) 3 m per year from level +376 m to +409 m and (ii) 2.5 m per year from level +409 m to +429 m (Figure 3). As per site conditions, every year, the raising of a particular section of the Aitik dam is carried out in about 10 days and the remaining 355 days are allowed for consolidation process to take place. The sequential raisings of the dam corner were simulated in 19 stages. Each stage consisted of a raising phase over 10 days followed by a consolidation phase over 355 days.
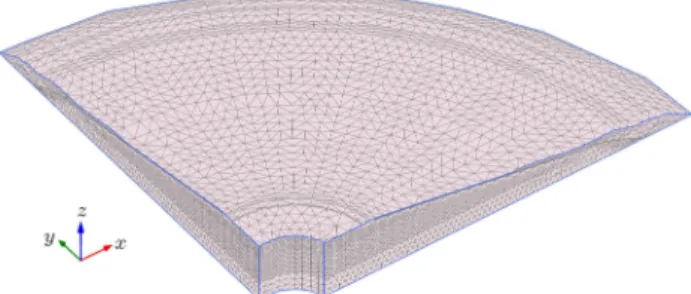
The 3D nite element mesh of the dam corner including future raisings (up to level +429 m) is presented in Figure 4. In the nite element mesh, 10 noded tetrahedral elements are used. These elements give a second-order interpolation of displacements [22]. The 3D mesh is suciently rened to obtain reliable results from the analyses.
The following boundary conditions are used in the 3D nite element model of the dam corner [22]:
1. The vertical model boundaries with their normal in
Figure 4. 3D nite element mesh of dam corner.
x direction (parallel to the yz plane) are xed in x direction and free in y and z directions;
2. The vertical model boundaries with their normal in y direction (parallel to the xz plane) are xed in y direction and free in x and z directions;
3. The vertical model boundaries with their normal neither in x nor in y direction are xed in x and y directions and free in z direction;
4. The model bottom boundary is xed in all x, y, and z directions;
5. The surface of the model is free in all x, y and z directions;
6. Groundwater ow and/or consolidation are re-stricted to occur across: the bottom, the left verti-cal boundary, the right vertiverti-cal boundary, and the curved boundary between the left and right vertical boundaries (Figure 4). All the other boundaries are open where groundwater ow and/or consolidation can occur.
3.2. 2D nite element model
The dam corner has a complex three-dimensional ge-ometry. For simplication, the dam corner was anal-ysed in a two-dimensional space with an axisymmetric model, which could be used for circular structures with a nearly uniform radial cross section and load distribution around the central axis. Figure 5 shows a 2D axisymmetric model in which the x-coordinate represents the radius and the y-coordinate denotes the axial line of symmetry [27].
Figure 6 shows the 2D nite element mesh of the dam corner (up to level +429 m). The nite elements
Figure 5. Axisymmetric model in two-dimensional space [27], with permission from PLAXIS bv, Delft, the Netherlands.
Figure 6. 2D nite element mesh of dam corner.
utilized in the mesh are triangular in shape with 15 nodes. These elements give a fourth-order (quartic) interpolation for displacements [23]. The 2D mesh was also gradually rened to obtain results with sucient accuracy.
In the 2D nite element model of the dam corner, water can ow through all boundaries except at the left vertical boundary and the base. It is assumed that horizontal displacements are zero along the left vertical boundary. There is a dense and impervious moraine layer between the bottom of the dam and the bedrock. It was estimated that the average depth of
the moraine layer was about 8 m. Initially, an analysis was performed on the dam with an 8 m thick moraine foundation. From this analysis, it was concluded that the moraine deposit had only a slight inuence on the safety factors and associated slip surfaces. Therefore, for convenience, it was assumed that the foundation of the dam on the moraine was rigid and the moraine layer was not included in the analysis presented in this study. However, it may be necessary to include the moraine layer in the nite element model if the dam is to be raised further in the future.
3.3. Material properties
The Mohr-Coulomb (MC) model was utilized to rep-resent the constitutive behaviour of all the material zones in the dam corner. The MC model is a simple linear elastic perfectly plastic model, which requires ve input parameters, i.e. Young's modulus, Poisson's ratio, friction angle, cohesion, and dilatancy angle. These parameters can be determined from basic soil tests [22,23]. In addition to the parameters required for the MC model, other soil parameters such as unit weight and hydraulic conductivity are also needed for the analyses [22,23].
Field and laboratory tests were performed on the tailings material to evaluate the values of the parameters: Young's modulus, friction angle, cohesion, unit weight, and hydraulic conductivity [28,29]. On the other hand, suitable values of these parameters for other material zones (moraine, lter, and rockll) were obtained from the following references [30-34].
Table 1 presents the above-mentioned parameters for all the material zones in the dam corner [28-34].
For each material zone of the dam corner, the value of the Poisson's ratio is assumed to be 0.33, which is a suitable value for this type of analysis [22,23]. It is
Table 1. Material properties of various zones in the dam corner [28-34]. Material
zone
Material type
unsat
kN/m3
sat
kN/m3
kx = ky
m/s
kz
m/s
E kN/m2
c0
kN/m2
'0
(deg)
1 Moraine (initial dike) 20 22 1 10 7 5 10 8 20000 1 35
2 Layered sand tailings 17 19 5 10 7 5 10 8 9300 10 22
3 Moraine (dikes) 20 22 5 10 8 1 10 8 20000 1 37
4 Compacted sand tailings 16 19 1 10 6 1 10 7 8800 13 26
5 Soft sand tailings 18 18 1 10 7 1 10 8 3100 6 18
6 Compacted sand tailings (dikes) 16 19 1 10 6 1 10 7 7200 13 26
7, 8 Layered sand tailings 17 19 5 10 7 5 10 8 3900 10 22
9 Filter 18 20 1 10 3 1 10 3 20000 1 32
10, 11 Rockll (berms + external
erosion protection) 18 20 1 10
1 1 10 1 40000 1 42
Note: unsatis the unit weight above phreatic level, satis the unit weight below phreatic level, kx and kyare the hydraulic conductivity in horizontal direction, kz is the hydraulic conductivity in vertical direction, E is the Young's modulus, c0is the eective cohesion, and '0is the eective friction angle.
assumed that the angle of dilatancy is zero for all the material zones of the dam corner [22,23]. This is an appropriate assumption because the use of a positive dilatancy angle may lead to unrealistically large tensile pore pressures (suction) and the use of a negative dilatancy angle may lead to unreasonably high pore pressures [22,23].
Laboratory experiments were conducted with Per-meameter to determine the hydraulic conductivity of the tailings [28]. Because of the layered nature of the tailings, it was assumed that the hydraulic conductivity values in the horizontal direction were 10 times greater than the values in the vertical direction [30].
Tailings of the Aitik dam were categorized as loose and dense based on the tip resistance of the Cone Penetration Test. The tailings were termed as loose where tip resistance was less than 2 MPa, whereas dilatant tailings exhibited tip resistance of 4-6 MPa.
For loading conditions of soils, PLAXIS manu-als [27] recommend to use the secant modulus at 50% strength as the Young's modulus (Figure 7). The val-ues of Young's moduli of dierent material zones were determined from drained triaxial tests as illustrated in Figure 7. The Young's modulus of soils increases with the conning pressure. The experimental range of the conning eective stress is about 450 kPa when the dam reaches the level of 429 m. The magnitude of Young's moduli for both loose and dilatant tailings material at three dierent values of eective conning stresses were evaluated from drained triaxial tests. Eqs. (1) and (2) [28] were obtained by curve tting from the plotted values of Young's moduli versus eective conning stresses:
Loose tailings E = 1 + 320
3 MPa; (1)
Dilatant tailings E = 6 + 300
3 MPa; (2)
where 0
3is the eective conning stress in MPa.
Material zones 4 and 6 comprise of dense tailings; 2, 7, and 8 are the mixture of both loose and dense tailings; 5 consists of loose tailings (cf. Figure 3). For a representative value of the eective stress, a value of the Young's modulus for (i) material zone 5 was evaluated using Eq. (1), (ii) material zones 4 and 6 were evaluated using Eq. (2), and (iii) material zones 2, 7, and 8 were evaluated by taking average of the values obtained from Eqs. (1) and (2) (cf. Table 1 and Figure 3) since these material zones contained both loose and dense tailings. For the zones 2, 5, and 7, the values of the Young's moduli (cf. Table 1) were kept constant until the dam level reached 409 m. On additional raisings of the dam from level +409 m to +429 m, the values of the previous Young's moduli of the tailings material zones 2, 5, and 7 (cf. Figure 3) were re-calculated because the eective stress was increased in the already deposited tailings.
Figure 7. Evaluation of Young's modulus from drained triaxial test [27], with permission from PLAXIS bv, Delft, the Netherlands.
Figure 8. Overestimation of undrained shear strength of normally consolidated soils using the Mohr Coulomb model [27], with permission from PLAXIS bv, Delft, the Netherlands.
The new increased values of the Young's moduli of the tailings material zones 2, 5, and 7 (cf. Table 1 for previous values of the Young's moduli) were about 17400 kPa, 12300 kPa, and 8000 kPa, respectively.
It is to be noted that eective strength parameters were utilized in the numerical analyses presented in this paper. The MC model overestimates the undrained shear strength of normally consolidated soils (e.g., clay and peat) if the eective strength parameters are used, as illustrated in Figure 8 [27]. This is because the MC model, in a stress path diagram, gives constant mean eective stress up to failure line (Figure 8). On the other hand, for normally consolidated soils, the mean eective stress decreases signicantly due to pore pressures [22,23]. Consequently, the MC model overestimates the value of deviatoric stress (Figure 8). This implies that the MC model predicts greater value of the mobilized shear strength than that of available undrained shear strength.
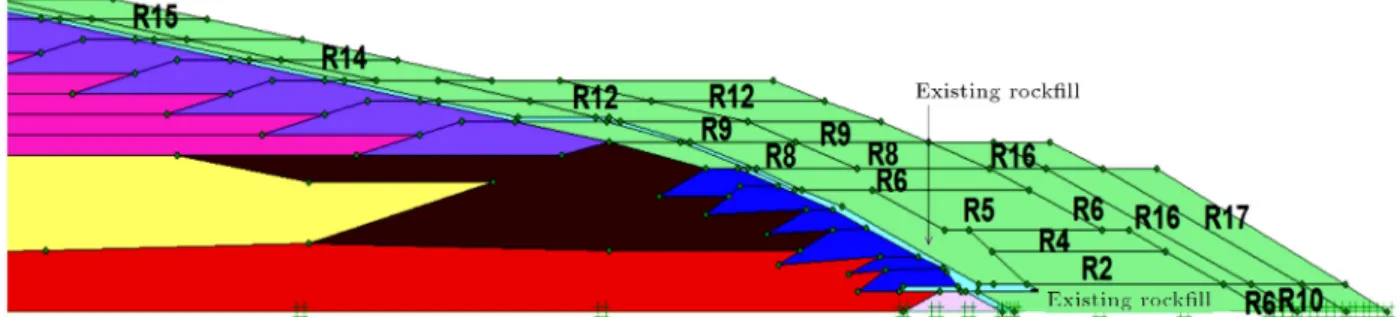
In order to check whether the MC model over-estimates the undrained shear strength of the tailings material mentioned in this paper, the results of the undrained direct shear tests on the tailings were com-pared with the corresponding results simulated with the MC model and a fair agreement was observed. Hence, it can be deduced that the MC model does not overestimate the undrained shear strength of the tailings material in the analyses described in this paper. 3.4. Slope stabilization with rockll berms It is relevant to mention here that the downstream side of the dam corner has been gradually strengthened with rockll berms as shown in Figure 9. The rockll berms were placed during various raising phases to increase slope stability. The rockll berms are marked with the capital letter R followed by a number (Figure 9). For example, R2 (Figure 9) indicates that this rockll berm has been placed during the second raising. The volume of the rockll berms, utilized in the present analyses of the corner, was adopted from another study performed by the authors on the straight dam section E-F [6]. The reason for using the same volume of rockll is that both the dam parts, i.e. the dam E-F and the dam corner, are almost identical in terms of material zones, rate of raising, and time for raising and consolidation phases. For the sake of uniformity and ease of construction, it is also practical to use the same volume of rockll in both parts of the dam.
4. Results
Coupled deformation and consolidation analyses [22,23, 35-36] were carried out to simulate the gradual raisings of the dam corner. These analyses were conducted to estimate the development and dissipation of excess pore pressures, as a function of time, in the dam corner.
As mentioned before, the purpose of the analyses of the dam corner was to identify tension zones and/or low-compression zones where cracks and internal ero-sion might occur. The magnitudes of the minor eective principal stresses were used as a criterion to locate potential tension zones and/or low-compression
zones. A tension zone is dened as a zone where the minor eective principal stresses are in tension. On the other hand, a low-compression zone is described as a zone where the magnitudes of the compressive minor eective principal stresses are reduced to small values near zero. It is assumed that cracks may develop in the dam corner at tension zones and/or low-compression zones.
It is also interesting to observe the directions of the minor eective principal stresses so as to know in which direction the potential cracks may develop and progress. A crack in a dam may appear in a direction roughly perpendicular to the direction of the minor eective principal stress. If minor eective principal stresses located in the longitudinal direction of the dam are of small magnitude, it is likely that cracks may develop in the transverse direction. From stability point of view, the cracks in the transverse direction of the dam are more dangerous than those in the longitudinal direction.
Analyses of safety were also performed by com-puting safety factors for slope stability and by ob-serving the potential failure zones for each raising of the dam corner. The results (minor eective principal stresses and safety factors) obtained with 3D analyses and 2D axisymmetric analyses of the dam are explained and compared with each other. For the sake of brevity, the minor eective principal stresses computed from the 3D analyses and the 2D axisymmetric analyses are referred to as 3D minor eective principal stresses and 2D minor eective principal stresses, respectively. The following sign convention is used in this paper, the compressive stresses are denoted by a positive sign, and the tensile stresses are indicated with a negative sign. The sign convention adopted here is opposite to the sign convention utilized in the nite element programs PLAXIS 3D and PLAXIS 2D [22,23].
4.1. Minor eective principal stresses
The magnitudes of 3D minor eective principal stresses and 2D minor eective principal stresses in the dam corner after the 18th raising are shown in Figures 10 and 11, respectively. The magnitudes of both the
Figure 9. Placement of rockll berms on the downstream side to increase slope stability of the dam corner. Here the term R indicates a rockll berm and the number species the raising during which the rockll berm was placed.
Figure 10. Distribution of the magnitude of 3D minor eective principal stresses in the dam corner after the 18th raising. For visibility, the height of the gure is enlarged twice the original height.
Figure 11. Distribution of the magnitude of 2D minor eective principal stresses in the dam corner after the 18th raising. For visibility, the height of the gure is enlarged twice the original height.
3D and 2D minor eective principal stresses indicate that tension zones and/or low-compression zones are located in the vicinity of the surface of the dam corner primarily above the phreatic level (Figure 11). Internal erosion is not likely to occur through the embankments because no ow of water occurs above the phreatic level and there is a lter zone along the slope of the dam corner (see, e.g. [37]).
As expected, the magnitudes of both the 3D and 2D compressive minor eective principal stresses (Figures 10 and 11) gradually increase from the surface to the bottom of the dam. This implies that a zone located in the lower part of the dam corner is more compressed than the zones which lie above that zone. The increase in the magnitudes of both the 3D and 2D compressive minor eective principal stresses along the depth of the dam corner suggests that cracks are not likely to develop in the interior of the dam corner.
It can be observed that the distribution of magni-tude of 2D minor eective principal stresses (Figure 11) closely matches the distribution of magnitude of 3D minor eective principal stresses (Figure 10).
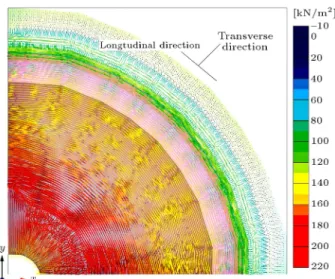
Figure 12 illustrates the magnitude and directions of 3D minor eective principal stresses in the dam at the level of +376 m. It can be seen that 3D minor eective principal stresses are largely located in the longitudinal direction. It is to be noted that the 3D
Figure 12. Magnitudes and directions of 3D minor eective principal stresses in the dam corner after the 18th raising at level +376 m. Here, the directions of the lines indicate the directions of the minor eective principal stresses and the colour of the lines represents the magnitude of the minor eective principal stresses.
minor eective principal stresses in the whole dam body are mainly located in the longitudinal direction, except at the bottom part of the dam (from level +353 m to +361 m), where the 3D minor eective principal stresses are mainly in the transverse direction. The directions of 2D minor eective principal stresses are observed to be consistent with the directions of 3D minor eective principal stresses.
From the above results, it is deduced that trans-verse cracks are not likely to develop in the interior of the dam because of the high magnitude of the minor eective principal stresses at those locations. The interpretation that cracks are not likely to occur in the interior of the dam implies that there is no increased risk of internal erosion in the dam corner. The reason is that the process of internal erosion in an embankment dam is frequently associated with the development of cracks within the dam (see, e.g., [37]).
It was mentioned above that there was a close similarity between the magnitudes of the 3D minor eective principal stresses and the 2D minor eective principal stresses. However, the quantitative dierence in magnitude between the 3D and 2D minor eective principal stresses was also evaluated with the help of an absolute norm and a relative norm. The absolute norm Nabsgives the dierence between the minor
eec-tive principal stresses obtained from 2D axisymmetric analyses and 3D analyses and is dened as:
Nabs= 302D 033D; (3)
where 0
32D represents the minor eective principal
and 0
33D symbolizes the minor eective principal
stresses from the 3D analyses.
The relative norm Nrelshows increase or decrease,
in percentage, of the 2D minor eective principal stresses compared to the 3D minor eective principal stresses and is expressed as:
Nrel= (302D 033D)=033D: (4)
If the values of the absolute norm are small, it may give impression that there is a negligible dierence between the 2D and 3D minor eective principal stresses. However, the dierence might be signicant, if it is evaluated in percentage. In order to avoid this type of misjudgment, the relative norm is computed to quantify the dierence in percentage. A drawback of the relative norm is that the norm value can be absurdly high even for small absolute deviations if the value of the 3D minor eective principal stress approaches zero (cf. Eq. (4)). Obviously, both norms are needed.
The magnitudes of the 2D minor eective princi-pal stresses were computed at the Gauss points in the 2D nite element mesh. The Gauss points in the 2D mesh were dierent from those in the 3D mesh. It is necessary to compare the magnitudes of the 2D and 3D minor eective principal stresses at the same locations in the dam. Therefore, an interpolation technique was employed to compute the magnitudes of the 3D minor eective principal stresses at those points where the magnitudes of the 2D minor eective principal stresses were obtained.
The values of the absolute norm and the relative norm of the minor eective principal stresses were mainly observed in the range of 0 to 10 kPa and 0 to 10%, respectively. For convenience, only the above-mentioned range of the values of the absolute norm and the relative norm of the minor eective principal stresses is presented here.
The absolute norm and the relative norm of the minor eective principal stresses, after 18th raising of the dam corner, are presented in Figures 13 and 14, respectively. The absolute norm (Figure 13) indicates that in comparison with the 3D minor eective princi-pal stresses, the 2D minor eective principrinci-pal stresses were (i) overestimated about 0 to 10 kPa in major portions of the dam, and (ii) underestimated about 0 to 10 kPa in remaining parts of the dam.
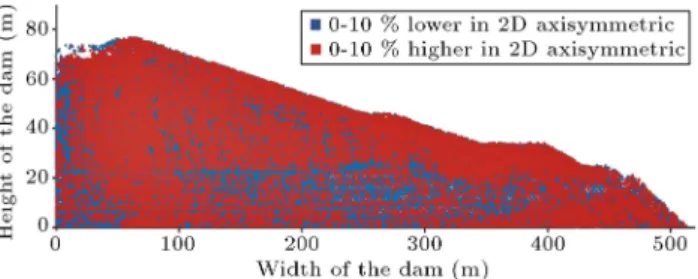
The relative norm (Figure 14) showed the similar trends to those of the absolute norm (Figure 13). The relative norm illustrates that in comparison with the 3D minor eective principal stresses, the 2D minor eective principal stresses were (i) about 0-10% high in major portions of the dam, and (ii) about 0-10% low in remaining parts of the dam.
From the norm values discussed above, it is inter-preted that there is not a signicant dierence between
Figure 13. Absolute norm of the minor eective principal stresses after the 18th raising of the dam corner. For visibility, the vertical axis in the gure is enlarged compared to the horizontal axis.
Figure 14. Relative norm of the minor eective principal stresses after the 18th raising of the dam corner. For visibility, the vertical axis in the gure is enlarged compared to the horizontal axis.
the 2D and 3D minor eective principal stresses in the dam corner. It leads to the conclusion that 2D axisymmetric analyses are suitable for this dam corner. This is an important nding, because 2D axisymmetric analyses require much less computational time than 3D analyses do.
4.2. Slope stability
It was described previously that the raisings of the dam corner were simulated in stages. In each stage, the dam corner was raised in 10 days followed by a consolidation period of 355 days. Moreover, the dam corner was progressively strengthened with rockll berms on the downstream side (cf. Figure 9).
The stability of the dam corner was evaluated in terms of factors of safety. The safety factor in the nite element programs PLAXIS 3D [22] and PLAXIS 2D [23] was computed by means of a strength reduction method [38]. In this method, the strength parameters, i.e. tangent of the friction angle and the cohesion of the soil, are gradually decreased in the same proportion until failure of the structure occurs [22,23,38]. The factor of safety is dened as the ratio of available shear strength of soil to the minimum shear strength required to maintain a just equilibrium state. The factor of safety is mathematically expressed as [22]:
Safety factor=S Savailable
needed for equilibrium=
c+0 ntan '
cr+n0tan 'r;(5)
where S is the shear strength; c and ' are the input values and cr and 'r are the reduced values of the
Figure 15. Comparison of safety factors computed with 3D analyses and 2D axisymmetric analyses. Here, the terms R and C stand for raising and consolidation phases, respectively.
cohesion and friction angle of the soil, respectively; and 0
n is the eective normal stress. It is to be noted that
the denition of the safety factor becomes the same in the strength reduction method as in conventional limiting equilibrium methods [38].
The safety factors computed with the 3D analyses and 2D axisymmetric analyses are here referred to as 3D safety factors and 2D safety factors, respectively. Figure 15 shows the 3D safety factors and the 2D safety factors for all the raising phases and associated consolidation phases. It is seen that the factors of safety increase gradually during the consolidation period due to dissipation of excess pore pressures and increase in eective stresses.
The dam corner is considered to be safe with respect to slope stability according to Swedish tailings dams' safety guidelines document GruvRIDAS [30], which states that a safety factor of 1.5 is needed for a tailings dam to be declared as stable during normal operation conditions.
The 2D safety factors were greater than 1.5 during all the raising phases, except for the rst raising where the magnitude of the safety factor was about 1.44, which was close to 1.5. This was interpreted as a sucient stability during the rst raising.
The 2D safety factors for each raising phase and the associated consolidation phase were lower than the corresponding 3D safety factors (Figure 15). This is because in a 3D analysis, xity and soil strength in the third dimension are taken into account and, as a result, the magnitude of the 3D safety factor is higher than that of the 2D safety factor (see, e.g., [39]). This implies that the slope stability results of the dam corner computed with the 2D axisymmetric analyses
Figure 16. Illustration of the most likely 3D failure mechanism of the dam corner after the 18th raising.
Figure 17. Illustration of the most likely failure mechanism of the dam corner in the two-dimensional xz plane after the 18th raising (taken from 3D analysis).
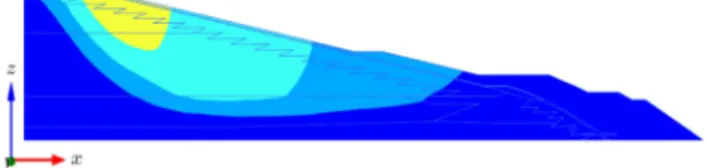
Figure 18. Illustration of the most likely failure mechanism of the dam corner after the 18th raising (obtained with 2D axisymmetric analysis).
were conservative (i.e., more on the safe side) compared to the corresponding results obtained with the 3D analyses.
The possible 3D failure mechanism of the dam corner after the 18th raising is displayed in Figure 16. The most likely slip surface occurred along the light blue shape, which indicated that the slip surface was nearly symmetric in the xz and yz planes. It can be seen that the failure zone was deep and wide (Figure 16). The corner was not exactly symmetric; therefore, large deformations were observed in the yz plane as compared to the xz plane (Figure 16). It is to be noted that in slope stability analyses, it is important to observe the shape of the failure zone and it is not relevant in a strength reduction method to describe the actual magnitudes of the deformations in the failure zone [22,23].
The failure mechanism of the dam corner after the 18th raising, obtained from 3D analysis, is presented in the two-dimensional xz plane (Figure 17) in order to make a comparison with the corresponding failure mechanism taken from 2D axisymmetric analysis (Fig-ure 18). It can be observed that both the slip surfaces were almost similar in width and depth.
5. Conclusions
A corner section of a tailings dam was analysed with both a 3D nite element model and a 2D axisymmetric nite element model. The analyses were carried out
to identify tension zones and/or low-compression zones and to evaluate slope stability of the dam corner during sequential raisings. A relative comparison was presented for the results (the magnitudes and the directions of the minor eective principal stresses, and factors of safety) obtained with the 3D analyses and the 2D axisymmetric analyses. The comparison showed that the results of the 2D axisymmetric analyses were consistent with those of the 3D analyses.
The results of both the 3D analyses and 2D axisymmetric analyses indicated that the tension zones and/or low-compression zones were observed in the vicinity of the surface of the dam corner, mostly above the phreatic level. It is interpreted that internal erosion is not likely to occur through the embankment because there is a lter zone along the slope of the dam corner and no ow of water occurs above the phreatic level. The results of both the 3D and 2D stability analyses showed that the dam corner could be raised safely up to a height of 76 m if the dam corner was gradually strengthened with rockll berms on the downstream side. As expected, the safety factors computed with the 3D analyses were greater than those computed with the 2D axisymmetric analyses.
A fairly good agreement was observed in the magnitudes and directions of the minor eective prin-cipal stresses computed with the 3D analyses and the 2D axisymmetric analyses of the dam corner. This, together with the conservative values of the safety factors obtained, implies that the 2D axisymmetric analyses are suitable for this particular dam corner. A signicant amount of computational time can be saved by performing 2D axisymmetric analyses of the dam corner instead of 3D analyses.
It is recommended to include a dense moraine layer as the base of the dam in the nite element model if it is intended to raise the height of the dam corner above 76 m, since the compressibility of the moraine may then have inuence on the mechanical behaviour of the dam.
Acknowledgements
The authors would like to express their sincere thanks to Boliden AB, Sweden, for giving them an opportunity to carry out the presented study regarding the tailings dams at the Aitik mine and its disposal facilities and for giving access to site information. Ms. Kerstin Pousette at Lulea University of Technology, Sweden, and Mr. Fredrik Jonasson at SWECO Infrastructure AB, Sweden, are to be acknowledged for performing laboratory tests and providing information from eld tests for evaluation of material parameters.
The rst author would like to thank Lars Erik Lundbergs Foundation, Sweden, for granting him a scholarship to conduct some part of his PhD research.
The \IRIS" project within the EU Fp7 frame-work, together with Lulea University of Technol-ogy, Boliden AB, and \Swedish Hydropower Centre| SVC," is acknowledged for nancial support, which made the work possible. SVC has been established by the Swedish Energy Agency, Elforsk and Svenska Kraftnat together with Lulea University of Technology, The Royal Institute of Technology, Chalmers Univer-sity of Technology, and Uppsala UniverUniver-sity.
Participating hydro power companies are: An-dritz Hydro Inepar Sweden, AnAn-dritz Waplans, E.ON Vattenkraft Sverige, Fortum Generation, Holmen Energi, Jamtkraft, Karlstads Energi, Linde En-ergi, MalarenEn-ergi, Skelleftea Kraft, Sollefteaforsens, Statkraft Sverige, Statoil Lubricants, Sweco Infrastruc-ture, Sweco Energuide, SveMin, Umea Energi, Vatten-fall Research and Development, VattenVatten-fall Vattenkraft, VG Power, and WSP.
References
1. Vick, S.G., Planning, Design and Analysis of Tailings Dams, BiTech Publishers Ltd, Vancouver (1990). 2. Bui, H.N., Tandjiria, V., Fell, R., Song, C. and Khalili,
N. \Two and three dimensional numerical analysis of the potential for cracking of embankment dams", UNICIV report No. R- 438, The University of New South Wales Sydney Australia (2005).
3. Bui, H.N., Song, C. and Fell, R. \Two and three dimensional numerical analysis of the potential for cracking of embankment dams during construction", UNICIV report No. R- 426, The University of New South Wales Sydney Australia (2004).
4. World information service on energy. \The Kolontar red mud dam failure in Hungary", available from: http://www.wise-uranium.org/mdafko.html (2013). 5. Zanbak, C. \Failure mechanism and kinematics of
Ajka tailings pond Incident", The Red mud project, available from http://www.redmud.org/Files/2010-ZANBAK Ajka%20Pond%20Failure-10%20Dec.pdf (2013).
6. Ormann, L., Zardari, M.A., Mattsson, H., Bjelkevik, A. and Knutsson, S. \Numerical analysis of strength-ening by rockll embankments on an upstream tailings dam", Can. Geotech. J., 50(4), pp. 391-399 (2013). DOI: 10.1139/cgj-2012-0255.
7. Zardari, M.A., Mattsson, H. and Knutsson S. \3D nite element analyses of a corner at Aitik tailings Dam in Sweden", In Proceedings of the 13th Int. Symposium on Environmental Issues and Waste Management in Energy and Mineral Production (SWEMP), New Delhi, India, pp. 444-453 (2012).
8. Ormann, L., Zardari, M.A., Mattsson, H., Bjelkevik, A. and Knutsson, S. \Numerical analysis of curved mebankment of an upstream tailings dam", Elec. J. of Geotech. Eng., 16/I, pp. 931-944 (2011).
9. Saad, B. and Mitri, H. \Hydromechanical analysis of upstream tailings disposal facilities", J. of Geotech. and Geoenviron. Eng., 137(1), pp. 27-42 (2011). 10. Saad, B. and Mitri H. \Staged construction analysis
of surface tailings disposal facilities", Int. J. of Min., Reclam. and Environ., 24(1), pp. 44-63 (2010). 11. Zandarn, M.T., Oldecop, L.A., Rodrguez, R. and
Zabala, F. \The role of capillary water in the stability of tailing dams", Eng. Geol., 105(1-2), pp. 108-118 (2009).
12. Psarropoulos, P.N. and Tsompanakis, Y. \Stability of tailings dams under static and seismic loading", Can. Geotech. J., 45(5), pp. 663-675 (2008).
13. Saad, B. \Transient coupled analysis of upstream tailings disposal facilities construction", Ph.D Thesis, Department of Mining and Materials Engineering, McGill University, Montreal, Canada (2008).
14. Gens, A. and Alonso, E.E. \Aznalcollar dam failure. Part 2: Stability conditions and failure mechanism", Geotechnique, 56(3), pp. 185-201 (2006).
15. Priscu, C. \Behavior of mine tailings dams under high tailings deposition rates", Ph.D Thesis, Department of Mining and Metallurgical Engineering, McGill Univer-sity, Montreal, Canada (1999).
16. Priscu, C., Mitri, H., Keira, H. and Jacobsz, S.W. \Evaluation of mine tailings dams behaviour - A case study", In Proceedings of the Sixth Int. Conf. on Tailings and Mine Waste `99, Fort Collins, Colorado, A.A Balkema Publishers, Rotterdam, the Netherlands, pp. 325- 334 (1999).
17. Desai, C.S., Shao, C., White, D. and Davis, S. \Sta-bility analysis for consolidation and dynamic response of mine tailing dam", In Proceedings of the Fifth Int. Conf. on Tailings and Mine Waste '98, Fort Collins, Colorado, A.A Balkema Publishers, Rotterdam, the Netherlands, pp. 193-200 (1998).
18. Zhang, Y., Chen, G., Zheng, L., Li, Y. and Zhuang, X. \Eects of geometries on three-dimensional slope stability", Can Geotech J., 50(3), pp. 233-249 (2013). DOI: 10.1139/cgj-2012-0279.
19. Nian, T., Huang, R., Wan, S. and Chen, G. \Three-dimensional strength-reduction nite element analysis of slopes: Geometric eects", Can. Geotech. J., 49(5), pp. 574-588 (2012). DOI: 10.1139/t2012-014.
20. Hungr, O., Salgado, F.M. and Byrne, P.M. \Evalua-tion of a three dimensional method of slope stability analysis", Can. Geotech. J., 26, pp. 679-686 (1989). DOI: 10.1139/t89-079.
21. Xing, Z. \Three dimensional stability analysis of con-cave slopes in plan view", J. Geotech. Eng., 114(6), pp. 658-671 (1988). DOI.org/10.1061/(ASCE)0733-9410(1988)114:6(658).
22. Brinkgreve, R.B.J., Engin, E. and Swolfs, W.M. \PLAXIS 3D manuals", PLAXIS b.v., the Netherlands (2011).
23. Brinkgreve, R.B.J., Swolfs, W.M. and Engine, E. \PLAXIS 2D manuals", PLAXIS bv, the Netherlands (2011).
24. The European Standard EN ISO 14688-1. \Geotechni-cal investigation and testing - Identication and classi-cation of soil - Part 1: Identiclassi-cation and description" (2002).
25. Wagner, A.A. \The use of the unied soil classication system by the bureau of reclamation", In Proceedings of the Fourth Int. Conf. SMFE, 1, Butterworths, London, pp. 125-134 (1957).
26. Google. \Satellite view of Aitik tailings dam near Gallivare, Sweden", Available at http://maps. google.com (2011).
27. Brinkgreve, R.B.J., Kumarswamy, S. and Swolfs, W.M. \PLAXIS 2D reference and material models manuals", PLAXIS bv, the Netherlands (2016). 28. Jonasson, F. \Geotechnical sampling of tailings at dam
EF and GH Aitik" [Geoteknisk provtagning av an-rikningssand damm EF och GH Aitik], SWECO VBB, Lulea, Sweden, Uppdragsnummer 2473649 (2007). 29. Pousette, K. \Laboratory tests on tailings from Aitik"
[Laboratorieforsok pa anrikningssand fran Aitik], In-ternal working document, Lulea University of Tech-nology, Lulea, Sweden (2007).
30. GruvRIDAS \The Swedish mining industry guide for dam safety" [Gruvindustrins riktlinjer for dammsa-kerhet], Svensk Energi AB/SveMin, Stockholm (2007). 31. Statens vattenfallsverk \Earth and rockll dams"
[Jord-och stenfyllningsdam-mar], Stockholm (1988). 32. Stal, T., Wedel, P. and Aven, S. (editors)
\Geotech-nical construction handbook" [Handboken Bygg Geoteknik] LiberForlag Stockholm (1984).
33. Bergdahl, U., Ottosson, E. and Malmborg, B.S. \Shal-low foundations" [Plattgrundlaggning], AB Svensk Byggtjanst och Statens Geotekniska Institut, Stock-holm (1993).
34. Vagverket. Bro \The Swedish road administration guidelines for construction and improvement of bridge" [Vagverkets allmanna tekniska beskrivning for nybyg-gande och forbattring av broar], Borlange (2004). 35. Potts, D.M. and Zdravkovic, L., Finite Element
Anal-ysis in Geotechnical Engineering. Theory, Thomas Telford Ltd, London (1999).
36. Britto, A.M. and Gunn, M.J., Critical State Soil Me-chanics Via Finite Elements, Ellis Horwood Limited, West Sussex, England (1987).
37. Fell, R., MacGregor, P., Stapledon, D. and Bell, G., Geotechnical Engineering of Dams, Balkema, Leiden (2005).
38. Brinkgreve, R.B.J. and Bakker, H.L. \Non-linear nite element analysis of safety factors", In Proceedings of Seventh Int. Conf. on Computer Methods and Advances in Geomechanics, Cairns, Australia; A.A Balkema publishers, Rotterdam, the Netherlands, pp. 1117-1122 (1991).
39. Griths, D.V. and Marquez, R.M. \Three-dimensional slope stability analysis by elasto-plastic nite ele-ments", Geotechnique, 57(6), pp. 537-546 (2007). DOI: 10.1680/geot.2007.57.6.537.
Biographies
Muhammad Auchar Zardari is Assistant Professor in the Department of Civil Engineering at Quaid-e-Awam University of Engineering Science and Technol-ogy, Nawabshah, Pakistan. His main research interests are numerical modelling of geotechnical structures, design of deep foundations, stability of hydropower dams, and reinforced baked clay as a low-cost material for building construction.
Hans Mattsson is Associate Professor in the Depart-ment of Civil, EnvironDepart-mental and Natural Resources Engineering at Lulea University of Technology, Lulea,
Sweden. His main research interests are geotechnical modelling, numerical analysis, hydropower dams, tail-ings dams, and internal erosion.
Sven Knutsson is Professor in the Department of Civil, Environmental, and Natural Resources Engineer-ing at Lulea University of Technology, Lulea, Sweden. His main research interests are frost, frost action, thaw weakening, permafrost, snow mechanics, water reten-tion dams, stability of tailings dams, internal erosion, mechanical properties of coarse grained material, use of industrial by-products, and dredging and deposition of dredged sediments.
Linda Ormann is Geotechnical Engineer at Fortum, Power Division, Renewable Energy, Karlstad, Sweden. She has earned an MSc in Civil Engineering in Sweden. Her research interests are safety of dams and numerical modelling of dams.
![Figure 5. Axisymmetric model in two-dimensional space [27], with permission from PLAXIS bv, Delft, the Netherlands.](https://thumb-us.123doks.com/thumbv2/123dok_us/8376636.2225092/4.892.141.388.150.392/figure-axisymmetric-model-dimensional-permission-plaxis-delft-netherlands.webp)
![Figure 8. Overestimation of undrained shear strength of normally consolidated soils using the Mohr Coulomb model [27], with permission from PLAXIS bv, Delft, the Netherlands.](https://thumb-us.123doks.com/thumbv2/123dok_us/8376636.2225092/5.892.461.797.499.727/overestimation-undrained-strength-normally-consolidated-coulomb-permission-netherlands.webp)