Performance Evaluation of Hypervisors in the Private Cloud based
on System Information using SIGAR Framework and for System
Workloads using Passmark
P. Vijaya Vardhan Reddy* and Dr. Lakshmi Rajamani
Department of CSE, UCE,
OU, Hyderabad, India
.
[email protected]
Abstract
Hypervisors using virtualization technology enable multiple operating systems to run on one physical server. Cloud computing model is less expensive because it streamlines the delivery of services by providing a stage for optimizing complex IT resources in a scalable manner with the help of virtualization technology and hypervisors. Selecting a suitable hypervisor for their organization’s private cloud is herculean task for modern CIOs. Hypervisor vendors do claim that they have negated virtualization overhead completely compare to native system, but still there exists minute virtualization overhead because virtual machines have to communicate with middle-layer hypervisor to access the underlying physical hardware and also there is an impact of other virtual machines running on the same hypervisor. Hypervisors are developed using different virtualization techniques like full virtualization, para-virtualization and hybrid model virtualization. This paper evaluates the performance of three hypervisors ESXi, XenServer and KVM using SIGAR framework for system information and Passmark for system workloads in the private cloud environment. Private cloud has been designed using open source cloud computing software CloudStack. Hypervisors are deployed as hosts in the CloudStack. This paper recommends best suited hypervisors for respective workloads in the private cloud based on the performance of system information and system workloads.
Keywords: CloudStack, Hypervisor, Virtualization, Passmark, Private cloud, SIAGR
1. Introduction
Cloud computing as a model enables on demand access to servers, networks, applications and provides the option to pay as you use manner [1]. The major benefits of cloud computing are flexible and scalable infrastructures, reduced implementation and maintenance costs, IT department transformation and increased availability of high performance applications.
Cloud computing model encourages availability and is composed of four deployment models. In which, Private Clouds are deployed behind the firewall of a company and the cloud infrastructure is operated solely for an organization. Private cloud deployment model creates proprietary computing architecture behind a firewall with full control over infrastructure. This paper uses private cloud model for experiment.
Virtualization is a technology that combines or divides computing resources to present many operating environments using methodologies like hardware and software partitioning, machine simulation, emulation, timeshari ng and etc., [2].
Cloud computing allows customers to reduce the cost of the hardware by allowing resources on demand. The SLA (Service Level Agreement) between the providers of cloud and the customers ensures that service will be delivered accurately [3].
Hypervisor using virtualization technique provides an infrastructural support to multiple virtual machines above it by virtualizing physical hardware resources. Hypervisors are categorized in to three models full virtualized hypervisor, para -virtualized hypervisor and hybrid model hypervisor based on virtualization techniques which are used in their development. VMware ESXi hypervisor uses full virtualization [4] technique as every virtual machine has a virtual BIOS and an emulated PC infrastructure. All emulated hardware for the virtual machines is emulated by the ESXi kernel to give near native performance. Citrix XenServer uses Para -virtualization [4] technique which involves explicitly modifying the operating system so that it is aware of being virtualized. KVM (Kernel-based Virtual Machine) is another open-source hypervisor which uses full virtualization apart from VMware and also as a kernel driver added into Linux thus effectively uses hardware assisted virtualization hence depicts as a hybrid model.
This intent of this paper is to evaluate the performance of three hypervisors VMware ESXi 4.1, Citrix Systems Xen Server 6.0 and KVM (Ubuntu 12.04 Server) for system information and system workloads in the private cloud environment using SIGAR [5] framework and Passmark [6] respectively. Private cloud is created using open source cloud computing software CloudStack [7]. Based on the evaluated performances, this paper recommends best suited hypervisors for private cloud.
The discussion in this paper should help modern CIOs and end users to choose the right virtualized hypervisor for the respective workloads in their private cloud environments. And also should help the hypervisor vendors to notice and mitigate virtualization overhead compare to native system.
2. Hypervisor Models
All three hypervisors that are used in the experiment are briefly described along with their virtualization technique.
2.1. Paravirtualized Hypervisor
XenServer - Citrix XenServer is server virtualization platform built on the Xen Hypervisor. Xen [8] uses para-virtualization technique. Para-virtualization modifies the guest operating system. XenServer is a virtual infrastructure solution that gives the flexibility of management console, and the tools needed to move applications, de sktops, and servers from a physical to a virtual environment [9]. XenServer hypervisor claims that it completely negates virtualization overhead gives near native application performance.
2.2. Full virtualized Hypervisor
ESXi Server - VMware ESXi is a Hypervisor designed for server virtualization environments capable of live migration of Virtual Machine (VM) using VM motion. VMware ESXi supports full virtualization [10]. The hypervisor implements shadow versions of system structures such as page tables and maintain consistency with the virtual Tables by trapping every instruction that attempts to update these structures. Therefore, an extra level of mapping is in the page Table. The virtual pages are mapped to physical pages throughout the guest operating system‘s page Table [11]. The
Hypervisor then translates the physical page to the machine page, which ultimately is the right page in physical memory. This helps the ESXi server to manage the overall memory and enhance the overall system performance [12].
2.3. Hybrid Methods
KVM - KVM (Kernel-based Virtual Machine) is another open-source Hypervisor which also uses full virtualization. And also as a kernel driver added into Linux, KVM enjoys all advantages of the standard Linux kernel thus depicting hybrid m odel. KVM introduces virtualization capability by augmenting the traditional kernel and user modes of Linux with a new process mode named guest, which has its own kernel and user modes and answers for code execution of guest operating systems [ 13]. KVM manages guest Operating systems with kill command and /dev/kvm. User -space takes charge of I/O operation‘s virtualization. KVM also provides a mechanism for user -space to inject interrupts into guest operating systems.
3. Related Work
The related work has been divided into following four categories.
In the first category the papers which are studied uses standard benchmarks for evaluation of hypervisors. ‘A Performance Comparison of Hypervisors’ [14] paper by VMware conducts different performance tests to mea sure the performance and scalability of two hypervisors ESX and Xen. ‘A Performance Comparison of Commercial Hypervisors’ [15] paper by XenSource also conducts same performance tests to evaluate the performance of both hypervisors ESX and Xen. In the experiments, to evaluate CPU performance of two hypervisors for CPU intensive applications, they have used Standard Performance Evaluation Corporation’s (SPEC) SPECcpu2000 [16]. To evaluate CPU and Memory performance of hypervisors for typical system workloads they have used Passmark benchmark. They have used SPECjbb2005 to evaluate hypervisors performance for an application server’s workload and SPECcpu2000 INT to assess the two hypervisors performance for development workloads. They have also used Netperf to evaluate network performance of both hypervisors. In the results, they compared both hypervisors with native and claimed that both hypervisors give near native performance except ESX scoring slightly over Xen.
In the second category the studied paper uses standard benchmarks with consolidated workloads. ‘Benchmark Overview – vServCon’ a white paper by Fujitsu PRIMERGY Servers [17] talks about ‘vServCon’ benchmark which was developed for their internal purpose to measure and assess performance of virtualized servers. According to them vServCon is not a new benchmark but a framework that consolidates already established benchmarks, as workloads, in order to simulate the load of a virtualized consolidated server environment. Three applications database, applica tion server, webserver executed in each virtual machine and all these applications are stressed with load generators through established benchmarks. All individual results are summarized in to one result and they named it as score for the performance capab ility of a virtualized environment.
In the third category different tools are used to evaluate hypervisors performance. Different hypervisors such as XEN, KVM and VMware ESX [18-21] performances have been evaluated to measure the overhead of virtualization with different toolkits. Menon used a toolkit called Xenoprof (system-wide statistical profiling toolkit for Xen virtual machine environment similar lines of OProfile for Linux) to evaluate the
performance overhead of network I/O devices. Menon [20] had used Xenoprof to debug Xen and been able to improve the network performance. Menon claims from his research that domain0 performance is close to native but guest operating system performance degrades considerably because of high CPU utilization as virtualiz ation increases the number of instructions that are to be handled by CPU. Jianhua [19] used LINPACK benchmark tool to test processing efficiency on floating point. Jianhua observed that windows XP gives better performance than fedora 8 on Xen. Jianhua clarifies it as Xen owns certain enhancement packages for windows XP than fedora. Jianhua used LMbech to evaluate memory virtualization of Xen and KVM and noticed that Xen’s performance is better than that of KVM. Jianhua used IOzone to compare file system performance among Xen and KVM. Jianhua found that without intel -VT processor the performance of Xen and KVM is significantly slower than that of native. With intel-VT processor Xen performance is significantly improved but not of the KVM because KVM does not exploit the functionalities of the intel-VT processor.
In the fourth category micro benchmarks are used for evaluation. ‘Virtual Machine Benchmarking’, by Kim Thomas Moller [22] talks about creation of a novel benchmarking suite VMbench and how it evaluates the performance of virtual machine environments. VMbench uses three stages of analysis. After defining hypervisor performance signature with micro and nano-benchmarks a virtual machine exercises defined operations, so that the performance of virtualization-specific functional primitives are accurately measured. Second stage uses best -case predictions for realistic applications using linear model. After introducing virtual machine interference with concurrent VMs the performance is measured for non-optimal conditions. VMbench follows a latency-oriented approach.
After analyzing the relevant work on hypervisors performance we have chosen SIGAR (System Information Gatherer and Reporter) framework to evaluate CPU, Memory, Disk and I/O performances of respective hypervisors based on system information. We have chosen Passmark to evaluate CPU, Memory, Disk and I/O performances of respective hypervisors for system workloads.
4. Experiment Design – Private Cloud: CloudStack with Hypervisors
The experimental design contains private cloud infrastructure created using CloudStack. CloudStack is an Infrastructure as a service (IaaS) cloud based software which builds private cloud environments. CloudStack supports multiple hypervisors. CloudStack has the ability to build cloud environments with different hypervisors with web interface for users and administrators. CloudStack is open source software written in java that is designed to deploy and manage large networks of virtual machines as a highly available, scalable cloud computing platform. CloudStack provides a web interface, command line to manage the cloud environment.
Two machines are needed to implement private cloud using CloudStack. One machine is Management Server, runs on a dedicated server or a VM. It contr ols allocation of virtual machines to hosts and assigns storage and IP addresses to the virtual machine instances. The Management Server runs in a Tomcat container and requires a MySQL database for persistence. In the experiment, Management Server (a Virtual Machine with hardware configuration of 4GB RAM and 100GB hard disk) is installed on Ubuntu (12.04 64-bit) operating system. Second machine is the host machine where hypervisors are installed on a bare metal with hardware configuration of AMD FX 8150 – 8 Core 3.6 GHz processor, 32 GB RAM, 1 TB hard disk and 2 NICs for the test environment. Front end will be any base machine to launch CloudStack UI
using web interface (with any browser software IE, Google Chrome) to provision the cloud infrastructure by creating zone, pod, cluster and host in the sequential order.
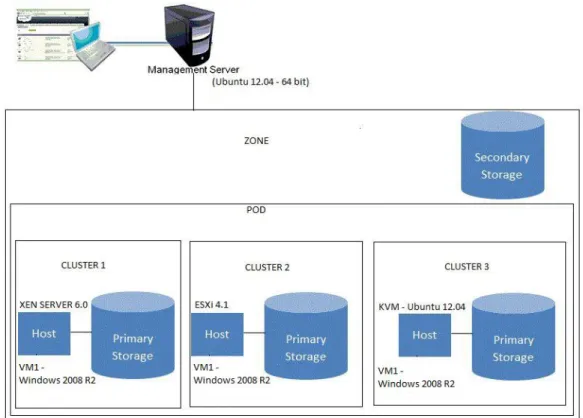
In our test environment XenServer 6.0, ESXi 4.1 and KVM (Ubuntu 12.04) hypervisors are deployed as hosts and virtual machine (VM1 - Windows 2008 R2) is installed on all three hypervisors in the private cloud as depicted in Figure 1.
Figure 1. Experiment Design – Private Cloud (CloudStack with Multiple hypervisors)
The virtual machine (VM1) Windows 2008 R2 is installed on each hypervisors and system information performance is gathered using SIGAR a nd system workloads performance evaluated in detail using Passmark.
After the Windows VM is installed on all three hypervisors, CPU, Memory, Disk I/O and Network performances are measured using SIGAR Framework. SIGAR (System Information Gatherer and Reporter) is a platform independent tool for accessing system level information in Java and other programming languages. In the experiment, Java program has written to gather system information using SIGAR API by deploying sigar -amd64-winnt.dll for Windows.
Passmark, a synthetic suite of benchmarks intended to isolate various aspects of system performance, was selected to represent system workloads. For generated system workloads, CPU, Memory, Disk I/O and Network performances are evaluated using Passmark. After evaluating hypervisors performance with both system information and system workloads, this paper recommends best suited hypervi sors for respective workloads.
5. Results
This section provides the detailed results of all the performance tests which are executed on three hypervisors using SIGAR API and Passmark. Detailed results are outcome of each of the benchmarks run. All of the results have been normalized to native performance measures. Native performance is normalized at 1.0 and all other various benchmark results are shown relative to that number. Hence benchmark results of 90% of the native performance would be shown as 0.9 on the scale in the graph. Higher numbers indicate better performance of the particular virtualization platform, unless indicated otherwise. Near-native performance also indicates that more virtual machines can be deployed on a single physical server, resulting in higher consolidation ratios.
5.1. Sigar
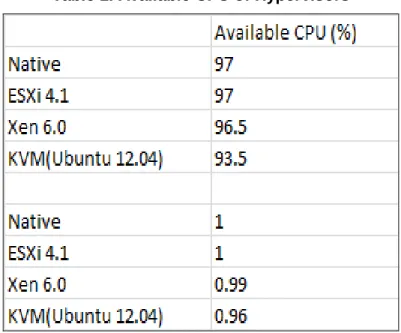
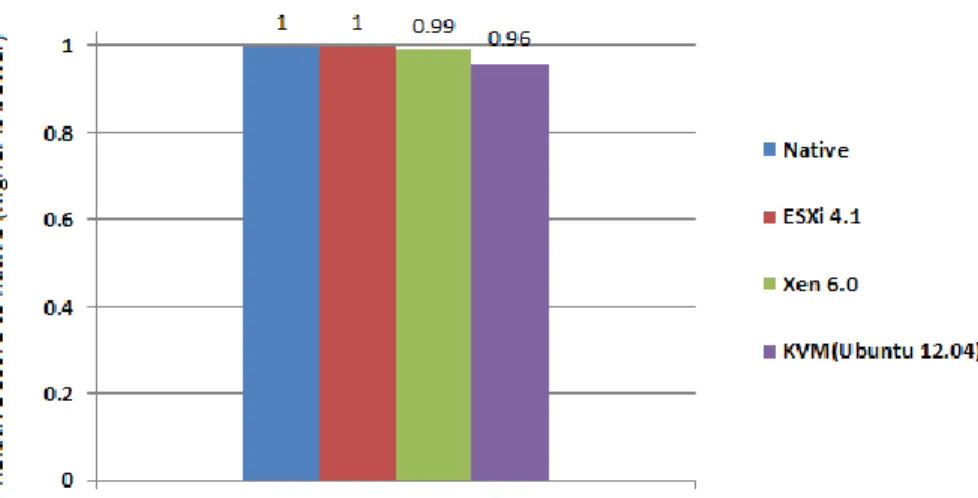
Available CPU details are captured through java program using SIGAR API on t he virtual machine operating system for each hypervisor. CPU availability close to native indicates the better performance for a hypervisor. The below T able 1 indicates available CPU performances for native and respective hypervisors.
Table 1. Available CPU of Hypervisors
ESXi with windows virtual machine (VM) as guest operating system shows available CPU equal to native without any virtualization overhead. XenServer with windows VM shows 1% available CPU overhead compare to native. KVM with windows VM s hows 4% available CPU overhead compare to native. ESXi exhibits better CPU availability compare to other two hypervisors as depicted in Figure 2.
Figure 2. Available CPU Captured using SIGAR (Higher Value is Better) From CPU performance perspective ESXi delivers better performance for system information compare to other two hypervisors.
Available Memory details are captured through java program using SIGAR API on the virtual machine operating system for each hypervisor. Memory availability close to native indicates the better performance for a hypervisor. The below T able 2 indicates available memory performances for native and respective hypervisors.
Table 2. Available Memory of Hypervisors
ESXi with windows virtual machine (VM) as guest operating system shows 3% available memory overhead compare to native. XenServer with windows VM shows 17% memory overhead compare to native. KVM with windows VM shows 24% memory overhead compare to native. ESXi exhibits better memory availability compare to other two hypervisors as shown in the Figure 3.
Figure 3. Available Memory Captured using SIGAR (Higher Value is Better) From memory performance perspective ESXi delivers better performance for system information compare to other two hypervisors.
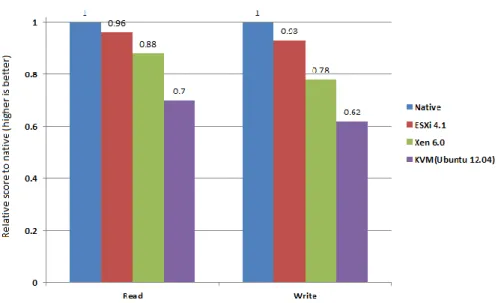
The following Table 3 shows results gathered for Disk I/O read write tests. The size of the test file we used is 16 GB which is half of the server’s RAM (32 GB). Read Write performance results are captured using Java program with SIGAR API on the guest operating system on each hypervisor. Read Write performances close to native indicates the better performance for a hypervisor.
Table 3. Disk I/O performance of Hypervisors
ESXi with windows virtual machine (VM) as guest operating system shows 4% overhead of read performance and 7% overhead of write performance compare to native. XenServer with windows VM shows 12% overhead of read performance and 22% overhead of write performance compare to native. KVM with windows VM shows 30% overhead of read performance and 38% overhead of write performance compare to native. ESXi exhibits better read write performance compare to other two hypervisors as shown in the Figure 4.
Figure 4. Disk I/O Read-Write Performance Captured using SIGAR (Higher Value is Better)
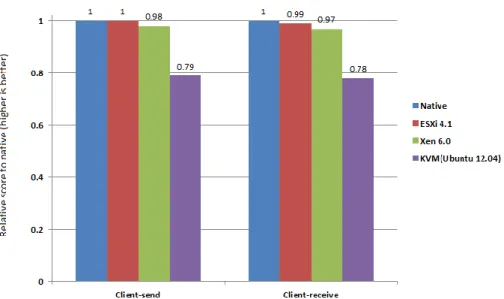
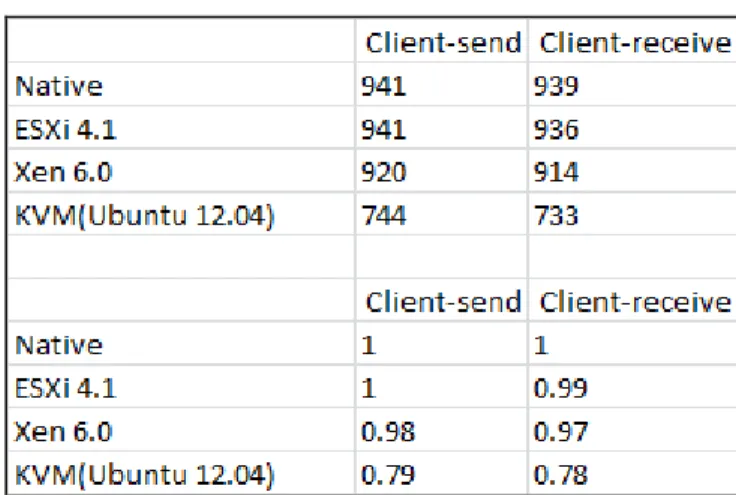
The following Table 4 shows results gathered for network send-receive tests. Network send-receive performance results are captured using Java program with SIGAR API on the guest operating system on each hypervisor . Network send-receive performances close to native indicates the better performance for a hypervisor.
Table 4. Network Performance of Hypervisors
The following Figure 5 shows results gathered for Network performance test for client-send and receive tests. Client-send and client-receive tests are conducted on the guest operating system on each hypervisor. ESXi with windows virtual machine (VM) as guest operating system shows equal to native performance on network send test and 1% overhead of network receive performance compare to native. XenServer with windows VM shows 2% overhead of network send performance and 3% overhead of
network receive performance compare to native. KVM with windows VM shows 21% overhead of network send performance and 22% overhead of network receive performance compare to native. ESXi exhibits better network send receive performance compare to other two hypervisors.
Figure 5. Network Send-Receive Performance Captured using SIGAR (Higher Value is Better)
5.2. Passmark
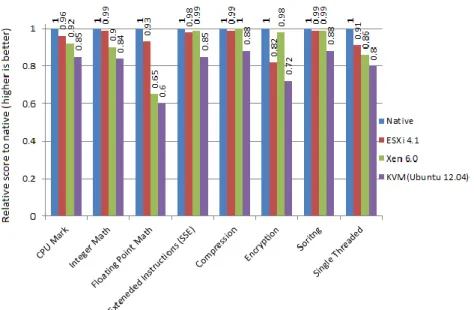
CPU performance test results of each hypervisor are captured on the win dows guest operating system. CPU mark and respective CPU performance details are captured using passmark benchmark on the virtual machine operating system for each hypervisor. CPU mark and other CPU performance results close to native indicate better performance for a hypervisor. The below Table 5 indicates CPU performances for native and respective hypervisors.
Table 5. CPU Performance of Hypervisors
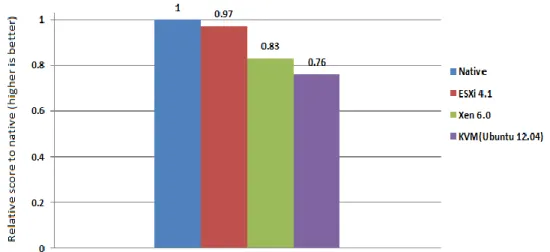
From passmark benchmark results for CPU, ESXi shows 4% overhead compare to native on overall CPU Mark whereas XenServer shows 8% overhead compare to native and KVM shows 15% overhead compare to native. In sorting test both ESXi and XenServer exhibits equal performance with 1% overhead to native. In Integer Math, Floating Point Math, and Single Threaded tests ESXi performs better than XenServer and KVM. In Extended Instructions, Compression and Encryption XenServer performs
better than ESXi and KVM. The results are depicted in graphical format in the following Figure 6.
Figure 6. CPU Performance Captured using PASSMARK (Higher Value is Better)
With Passmark benchmark, In Integer Math test ESXi shows 1% overhead compare to native, whereas XenServer shows 10% overhead and KVM shows 16% overhead compare to native. In Floating Point Math test ESXi shows 7% ov erhead compare to native, whereas XenServer shows 35% overhead and KVM shows 40% overhead compare to native. In Extended Instructions test ESXi shows 2% overhead compare to native, whereas XenServer shows 1% overhead and KVM shows 15% overhead compare to native. In Compression test ESXi shows 1% overhead compare to native, whereas XenServer exhibits equal to native performance without any overhead and KVM shows 12% overhead compare to native. In Encryption test ESXi shows 18% overhead compare to native, whereas XenServer shows 2% overhead and KVM shows 28% overhead compare to native. In Sorting test ESXi shows 1% overhead compare to native, whereas XenServer also shows 1% overhead and KVM shows 12% overhead compare to native. In Single Threaded test ESXi shows 9% overhead compare to native, whereas XenServer shows 14% overhead and KVM shows 20% overhead compare to native.
Even though XenServer exhibits slightly better performance than ESXi in Extended Instructions, Compression and Encryption tests but in remaining all other tests ESXi gives better performance compare to other two hypervisors used in the experiment. On overall CPU Mark ESXi exhibits better performance with just 4% overhead compare to native on the other hand XenServer shows 8% overhead and KVM shows 15% overhead compare to native.
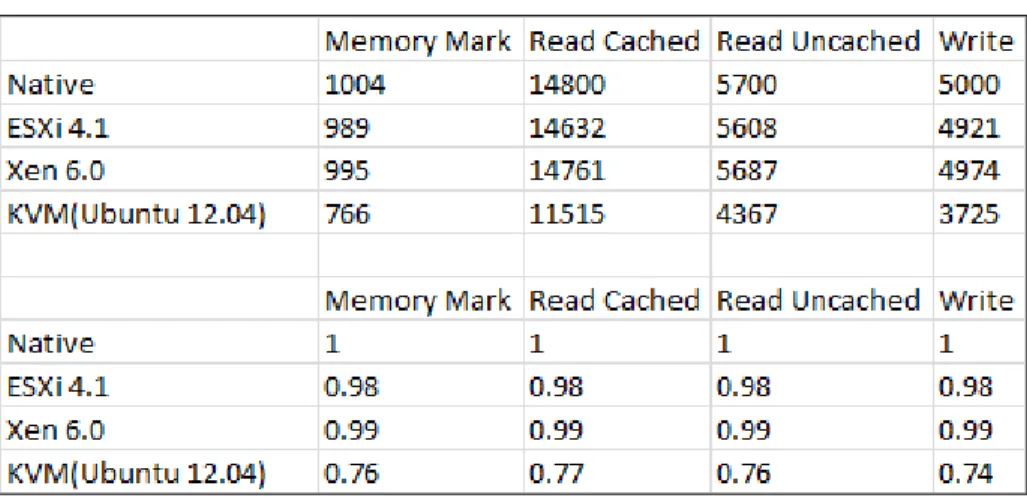
Memory performance test results of each hypervisor are captured on the windows guest operating system. Memory mark and respective memory performance details are captured using passmark benchmark on the virtual machine operating system for each hypervisor. Memory mark and other memory performance results close to native
indicate better performance for a hypervisor. The below T able 6 indicates memory performances for native and respective hypervisors.
Table 6. Memory Performance of Hypervisors
From passmark benchmark results for memory, ESXi shows 2% overhead compare to native on overall memory mark whereas XenServer shows 1% overhead compare to native and KVM shows 24% overhead compare to native. On overall memory performance XenServer performs better than ESXi and KVM. The results are depicted in graphical format in the following Figure 7.
Figure 7. Memory Performance Captured using PASSMARK (Higher Value is Better)
With Passmark benchmark, in Read Cached test ESXi shows 2% overhead compare to native, whereas XenServer shows 1% overhead and KVM shows 23% overhead compare to native. In Read Uncached test ESXi shows 2% overhead compare to native, whereas XenServer shows 1% overhead and KVM shows 24% overhead compare to native. In Write test ESXi shows 2% overhead compare to native, whereas XenServer shows 1% overhead and KVM shows 24% overhead compare to native.
In memory performance test XenServer exhibits better performance compare to other hypervisors with just 1% overhead to compare native, on the other hand ESXi exhibits 2% overhead compare to native and KVM exhibits 24% overhead compare to native.
Disk I/O performance test results of each hypervisor are captured on the windows guest operating system. Disk mark and respective disk I/O performance details are captured using passmark benchmark on the virtual machine operating system for each hypervisor. Disk mark and other disk I/O performance results close to native indicate better performance for a hypervisor. The below Table 7 indicates disk I/O performances for native and respective hypervisors.
Table 7. Disk I/O Performance of Hypervisors
From passmark benchmark results for disk I/O, ESXi shows 4% overhead compare to native on overall disk mark whereas XenServer shows 3% overhead compare to native and KVM shows 33% overhead compare to native. On overall disk I/O performance XenServer performs better than ESXi and KVM. The results are depicted in graphical format in the following Figure 8.
Figure 8. Disk I/O Performance Captured using PASSMARK (Higher Value is Better)
With Passmark benchmark, in Sequential Read test ESXi shows 5% overhead compare to native, whereas XenServer shows 4% overhead and KVM shows 35% overhead compare to native. In Sequential Write test ESXi shows 7% overhead compare
to native, whereas XenServer shows 6% overhead and KVM shows 36% overhead compare to native.
In disk I/O performance test XenServer exhibits better performance compare to other hypervisors with 3% overhead to compare native, on the other hand ESXi exhibits 4% overhead compare to native and KVM exhibits 33% overhead compare to native.
Network performance test results of each hypervisor are captured on the windows guest operating system. Network Send, Receive performance details are captured using passmark benchmark on the virtual machine operating system for each hypervisor. Network performance results close to native indicate better performance for a hypervisor. The below Table 8 indicates network performances for native and respective hypervisors.
Table 8. Network Performance of Hypervisors
From passmark benchmark results for network performance, ESXi shows equal to native on client-send test and 1% overhead on client-receive test compare to native. XenServer shows 2% overhead compare to native in client-send test and 3% overhead in client-receive test compare to native. KVM shows 21% overhead compare to native in client-send test and 22% overhead in client-receive test compare to native. On overall network performance ESXi performs better than XenServer and KVM. The results are depicted in graphical format in the following Figure 9.
Figure 9. Network Performance Captured using PASSMARK (Higher Value is Better)
In network performance test ESXi exhibits better performance comp are to other hypervisors with less overhead to compare native. XenServer also exhibits equal performance with ESXi as very close performance compare to native but KVM falls behind two other hypervisors and native as well.
6. Conclusion
The intent of this paper is to evaluate the performance of three hypervisors, VMWare ESXi Server, XenServer and KVM for system information using SIGAR and for system workloads using Passmark in the private cloud environment. Virtual machine (VM) windows 2008 R2 is deployed on each hypervisor in the private cloud. CloudStack is used to create a private cloud. Once entire experiment setup is ready, system information is gathered using SIGAR API to compare the performance of three hypervisors. Among three hypervisors, for system information, VMWare’s ESXi shows better performance in available CPU, available memory, disk I/O and network performance compare to other two hypervisors. KVM needs to improve in all four system resources performance point of view. For system workloads Pa ssmark is used to evaluate three hypervisors performance. Among three hypervisors, for system workloads, VMWare’s ESXi shows better performance in CPU mark, and network performance compare to other two hypervisors. XenServer shows better performance in memory mark, and disk I/O performance compare to other two hypervisors. KVM needs to improve in all four system resources performance from system workloads point of view. System workload environment and hardware configuration is same for all three hypervisors hence the hypervisors which are lacking in the respective system resources performance need an improvement. Hypervisor vendors may concentrate on the loopholes exhibited in respective performance tests and may improve their products to mitigate virtualization overhead which are captured at system information level. This system information indicates the gap which should be filled for improvement of hypervisors.
For system information test using SIGAR, ESXi exhibits better performance compare to other hypervisors, hence it is most recommended hypervisor. For system workloads test using Passmark, ESXi exhibits better performance for CPU and network hence it is most recommended hypervisor for those workloads. XenServer shows better performance in memory and disk I/O tests hence it is most recommended hypervisor for those respective workloads. From our experimentation KVM lacks in all performance tests hence it is moderately recommended hypervisor for respective workloads.
Experimentation setup was challenging and collecting information through SIGAR API was a new idea. For all three hypervisors with system workloads, performance results are captured through Passmark. From the results ESXi hypervisor, which uses full virtualization technique exhibits better performance in CPU utilization and Network speed. XenServer, a para-virtualized hypervisor exhibits better performance in memory utilization and disk I/O speed. On the other hand KVM hypervisor needs to improve compare to other two hypervisors. Over all three hypervisors perform close to each other in all tests for system workloads and system information. Cloud computing is evolving at rapid pace more and more research is required in this area and as a future work more hypervisors can be evaluated from performance perspective in the public cloud environment.
References
[1] P. Mell and T. Grance, “The NIST Definition of Cloud Computing”, National Institute of Standards and Technology, Information Technology Laboratory,Version 15, (2009) October 7.
[2] S. Nanda and T. Chiueh, “A Survey on Virtualization Technologies”, Technical report, Department of Computer Science, SUNY at Stony Brook, New York, (2005), pp. 11794-4400.
[3] R. Buyya, C. S. Yeo, S. Venugopal, J. Broberg and I. Brandic, “Cloud computing and emerging IT platforms: Vision, hype, and reality for delivering computing as the 5th utility”, in: Future Generation Computer Systems, Elsevier B. V., (2009).
[4] “VMware Understanding Full Virtualization, Paravirtualization and Hardware Assist. VMware”, white paper,
(2007) November 10.
[5] “SIGAR”, [Online] https://support.hyperic.com/display/SIGAR/Home. [6] “Passmark”, [Online] http://www.passmark.com/products/pt.htm. [7] “CloudStack”, [Online] http://cloudstack.apache.org.
[8] “Xen―How does Xen work”, Xen Organization, (2009).
[9] “Fujitsu Technology Solutions”, Data Sheet Citrix Xen Server.
[10]“Hostway UK VMware ESXi Cloud Simplified”, Comprehensive explanation of the features and benefits of VMware ESXi Hypervisor.
[11]P. Barham, B. Dragovic, K. Fraser, S. Hand, T. Harris, A. Ho, R. Neugebauer, I. Pratt and A. Warfield, “Xen and the art of virtualization”, Proceedings of the Nineteenth ACM Symposium on Operating systems Principles, ACM Press, New York, (2003), pp. 164–177.
[12]“VMware, ―The Architecture of VMware ESXi”, white paper, (2007).
[13]J. Che, Q. He, Q. Gao and D. Huang, “Performance Measuring and Comparing of Virtual Machine Monitors”, College of Computer Science, Zhejiang University, Hangzhou 310027, China, IEEE/IFIP International Conference on Embedded and Ubiquitous Computing, (2008).
[14]“VMware (2007) A Performance Comparison of Hypervisors VMware”, White paper, (2007) February 1. [15]“XenSource (2007) A Performance Comparison of Commercial Hypervisors. XenEnterprise vs. ESX
Benchmark Results”, XenSource, (2007).
[16]“Standard Performance Evaluation Corporation (SPEC)”, [Online] http://www.spec.org/cpu2000/. [17]“FUJITSU”, Benchmark Overview-vServCon, white paper, (2010) March.
[18]P. Apparao, S. Makineni and D. Newell, “Virtualization (2006) Characterization of network processing overheads in Xen”, Technology in Distributed Computing, VTDC, (2006).
[19]C. Jianhua, H. Qinming, G. Qinghua and H. Dawei, “Performance Measuring and Comparing of Virtual Machine Monitors”, Embedded and Ubiquitous Computing, EUC '08, (2008).
[20]A. Menon, et. al., “Diagnosing Performance Overheads in the Xen Virtual Machine Environment”, Conference on Virtual Execution Environments (VEE'05), (2005).
[21]Z. Shan and H. Qinfen, “Network I/O Path Analysis in the Kernel-based Virtual Machine Environment through Tracing”, Information Science and Engineering (ICISE), (200p).
[22]K. T. Moller, “Virtual Machine Benchmarking”, Diploma Thesis, Karlsruhe Institute of Technology, (2007).
Authors
P. Vijaya Vardhan Reddy, he is IEEE member. For the past 14 years he has been working in the IT industry. He had worked in Tokyo (2001) for CSFB Project and in London (2005-06) for ADP Freedom Payroll Project in Java/J2EE Technologies. He had actively involved in the design of web based multi-tier applications. He has experience in SDLC and project management methodologies like agile/scrum. His research areas include distributed computing, grid computing and cloud computing.
Lakshmi Rajamani, is a retired professor. She has many papers published in journals across the world. She had served as a head of the department for computer science department from 2010 to 2012.