Architectural Implications on the Performance and Cost of
Graph Analytics Systems
Qizhen Zhang†,∗, Hongzhi Chen∗, Da Yan§,∗, James Cheng∗, Boon Thau Loo†, and Purushotham Bangalore§ †
University of Pennsylvania ∗The Chinese University of Hong Kong §University of Alabama at Birmingham
ABSTRACT
Graph analytics systems have gained significant popularity due to the prevalence of graph data. Many of these systems are designed to run in a shared-nothing architecture whereby a cluster of machines can process a large graph in parallel. In more recent proposals, others have argued that a single-machine system can achieve better performance and/or is more cost-effective. There is however no clear consensus which approach is better. In this paper, we classify existing graph analytics systems into four categories based on the architectural differences, i.e., processing infrastructure (centralized vs distributed), and memory consumption (in-memory vs out-of-core). We select eight open-source systems to cover all categories, and perform a comparative measurement study to compare their performance and cost characteristics across a spectrum of input data, applications, and hardware settings. Our results show that the best performing configuration can depend on the type of appli-cations and input graphs, and there is no dominant winner across all categories. Based on our findings, we summarize the trends in performance and cost, and provide several insights that help to illu-minate the performance and resource cost tradeoffs across different graph analytics systems and categories.
CCS CONCEPTS
•Information systems→Data management systems; • Com-puter systems organization→Distributed architectures;
KEYWORDS
Graph analytics systems, experiments, performance, resource cost
ACM Reference Format:
Qizhen Zhang†,∗, Hongzhi Chen∗, Da Yan§,∗, James Cheng∗, Boon Thau Loo†, and Purushotham Bangalore§. 2017. Archi-tectural Implications on the Performance and Cost of Graph Analytics Systems. InProceedings of SoCC ’17, Santa Clara, CA, USA, September 24–27, 2017,12 pages.
https://doi.org/10.1145/3127479.3128606
Permission to make digital or hard copies of all or part of this work for personal or classroom use is granted without fee provided that copies are not made or distributed for profit or commercial advantage and that copies bear this notice and the full citation on the first page. Copyrights for components of this work owned by others than ACM must be honored. Abstracting with credit is permitted. To copy otherwise, or republish, to post on servers or to redistribute to lists, requires prior specific permission and/or a fee. Request permissions from [email protected].
SoCC ’17, September 24–27, 2017, Santa Clara, CA, USA © 2017 Association for Computing Machinery. ACM ISBN 978-1-4503-5028-0/17/09. . . $15.00 https://doi.org/10.1145/3127479.3128606
1
INTRODUCTION
In recent years, there have been a proliferation of graph analyt-ics systems that aim to perform complex graph analytanalyt-ics, such as shortest-paths and clustering algorithms efficiently on large graphs. One of the first systems, Pregel [21], uses a distributed vertex-centric computation framework to partition a large graph into groups of vertices for parallel processing. Recent graph an-alytics system proposals that aim to enhance Pregel’s model can be taxonomized along two dimensions. First, these systems can ei-ther bedistributed(in a cluster) orcentralized(in a single machine). For example, systems such as Galois [24] show that if one can fit an entire graph dataset into the memory of a single machine, its performance may even outperform a cluster for some workloads. Second, in memory usage, these systems can either bein-memory orout-of-core. To work around memory limitations, systems such as GraphChi [18] and Pregelix [6] resort to out-of-core execution. In this paper, we aim to carry out a comprehensive evaluation of various open-source graph analytics systems that are publicly available. As input data, we consider five well-known datasets from Twitter, Youtube, Orkut, Friendster and road network, with the largest dataset up to billions of edges. We use four represen-tative graph analytics applications that have different execution characteristics in the number of iterations and cost of each itera-tion. Using the input data and applications, we benchmarked eight different graph analytics systems (Galois [24], GraphChi [18], Pow-erGraph [12], Giraph [3], X-Stream [28], Pregelix [6], GraphD [40], Chaos [27]) with different settings on centralization vs distribution, and in-memory vs out-of-core operations.
In our study, performance is not the only dimension to consider when evaluating graph analytics systems. In many organizations, cost is also a consideration, and one often has to find tradeoffs between cost and performance. Unfortunately, there is no one-size-fits-all solution, as the cost/performance ratio of each system is also dependent on the applications and data. As an example, a distributed graph analytics system may have higher throughput, but if the entire graph can fit into the memory of one machine, in-memory centralized systems may be a better option for some workloads given the low cost of memory today. In other cases, users may be less concerned about timeliness, and are willing to allow batch jobs to complete over a longer period, negating the need to run on high-end hardware. In a pay-as-you-go cloud model, execution times become more important than initial sunk-cost of equipment.
Unlike prior studies [7, 10, 11, 14, 16, 20, 30], our study is signifi-cantly broader in the scope of data and applications being evalu-ated, the breadth of systems selected and hardware configurations used. We observe that there is no one-size-fits-all solution, as the
cost/performance ratio of each system is also dependent on the input applications and data, suggesting the need for an automated tool to help data scientists determine the best deployment option for their workloads. Specifically, the paper makes the following contributions:
Graph analytics system taxonomy.We surveyed existing graph analytics systems and taxonomized them along the dimensions of centralized vs distributed, and in-memory vs out-of-core. In some cases, a system may belong to more than one category. We further summarize the characteristics of each category as well as each of these systems surveyed.
Performance measurements.Using a wide range of datasets and applications, we carried out a comprehensive evaluation study of the above systems with different hardware configurations. We observed that graph analytics system performance can vary sig-nificantly based on the input graphs and queries of interest. Our performance results are illuminating, and in some cases surprising. For example, for workloads that require many iterations where each iteration is fairly simple, in-memory execution on a single machine is preferable to running in a distributed environment. On the other hand, for workloads that require a small number of iterations where each iteration is an expensive operation, an in-memory distributed approach often provides the best perfor-mance. Within workloads that require a small number of iterations, there are further distinctions in performance based on whether each iteration is bandwidth or computation intensive. We further observe that out-of-core centralized approaches are desirable for small datasets, while in-memory distributed approaches work best for large datasets.
Cost/performance analysis.We next conducted our performance evaluation by taking cost of hardware into consideration. We de-fined a new performance-aware cost (PAC) metric, that allows us to normalize performance based on cost. The PAC metric takes into account resource cost and execution time, and serves as a frame-work that can be customized as cost varies in future. Our results here are also illuminating. While in-memory approaches will result in better performance than out-of-core approaches, once cost is factored in, this may no longer be true. We observed that there is no clear winner in the cost/performance analysis, and the choice of graph analytics systems is often highly dependent on the nature of the workload. For example, for applications with large number of iterations, centralized in-memory approaches continue to have the best performance given the PAC metric. However, for applications with small number of iterations, centralized out-of-core approaches are actually the most preferred option, outperforming distributed approaches, when the input graph is under billion scale. Surpris-ingly, even taking cost into account, out-of-core distributed systems are less desirable compared to in-memory distributed systems due to long execution times.
This paper is presented as follows. Section 2 gives a taxonomized analysis on existing graph analytics systems. Section 3 surveys the most representative systems in each category. Section 4 details the benchmark for our evaluation. Sections 5 and 6 present the evaluation results and our analysis. Section 7 describes the novelty of our work to related studies and explains our system selection. Section 8 concludes the work.
2
TAXONOMIZED ANALYSIS
Our work studies general-purpose graph systems that are used for developing scalable solutions for a wide range of graph analytics tasks, rather than specialized systems that are designed for a par-ticular graph task. These systems share the common features of (1)programming simplicityand (2)transparent scalability. With (1) and (2), a user only needs to specify how a vertex should interact with other vertices and update its own state, and the computation can automatically scale, either out (for distributed systems) or up (for centralized systems), to handle graphs of arbitrary size without the need to change the user’s code/algorithm.
The APIs of existing general-purpose graph systems mainly fall into the following two types. (1)Message passing, where vertices communicate with each other by sending messages. The computa-tion is often iterative and synchronized at each iteracomputa-tion to eliminate race conditions. (2)Shared-memory abstraction, where a vertex can directly access the data of its adjacent neighbors/edges. This incurs race conditions and data values need to be synchronized among all replicas. However, asynchronous execution can be supported to bring faster convergence, and this programming model is more suitable for a centralized system.
We studied the design and implementation of existing graph sys-tems, and categorized them based on their hardware requirements and data access patterns. We classify an existing system according to (i) whether it is designed to run on a single machine, or on a cluster of machines, and (ii) whether the entire graph data reside in memory during the computation, or are streamed on disk(s). Accordingly, we obtain four categories of graph systems:
• In-memory centralized (IC) systems[24, 25, 33, 34], typi-cally running on a high-end server with large memory space (e.g., 1TB) in order to hold a big graph;
• In-memory distributed (ID) systems[3, 8, 12, 13, 15, 17, 21, 29, 32, 35–37, 39, 44], which are run on a cluster of ma-chines whose aggregate memory space can accommodate a big graph;
• Out-of-core centralized (OC) systems[9, 18, 28, 38, 45], which are typically run on a desktop PC (or a laptop) that has sufficient disk space to hold a big graph;
• Out-of-core distributed (OD) systems[6, 27, 40], which are run on a cluster of machines whose aggregate disk space can accommodate a big graph.
Next, we analyze the strengths and limitations of the systems in each category, with a summary of the results given in Table 1.
• Hardware resource cost. Out-of-core centralized systems have the lowest hardware resource cost (often a commodity
Centralized Distributed
In-memory Galois, GraphChi-IM PowerGraph, Giraph Out-of-core GraphChi, X-Stream Pregelix, GraphD, Chaos
Category Machine Cost Scalability ToleranceFault OverheadStartup Expressi-veness
IC High Low Medium High
ID High High Low High
OC Low Medium High Medium
OD Medium High Low Medium
Architectural Implications on the Performance and Cost of Graph Analytics Systems SoCC ’17, September 24–27, 2017, Santa Clara, CA, USA
PC or a laptop is sufficient). In contrast, in-memory central-ized systems require a high-end server with large memory, and such a machine is still considerably more expensive and less commonly available to most companies/institutes. Distributed systems usually require a relatively high initial investment on the hardware, e.g., to purchase a cluster of servers/PCs along with network components, although for many companies/institutes a commodity cluster commonly exists for their own operational tasks.
•Scalability. Distributed graph systems become popular thanks to their horizontal scalability: one may increase the aggregate memory (and disk) space in a cluster by simply adding more machines, in order to process a bigger graph. Since the memory (resp. disk) of all machines are accessed (resp. streamed) concurrently, distributed graph systems can utilize the memory (resp. disk) bandwidth from all machines. However, network communication among the machines of-ten becomes the performance bottleneck of such systems, especially for data-intensive tasks, because commodity clus-ters are more common today and they are equipped with Gigabit Ethernet only. Furthermore, additional resources are required to buffer and manage messages, leading to larger total memory (and/or disk) consumption than a centralized system.
Centralized systems, on the other hand, are constrained by the limitation of the graph size that they can handle with the available memory (resp. disk) space. Moreover, while net-work communication is avoided, the performance of these systems is often limited by the memory (resp. disk) band-width of a single machine, leading to long execution time for computation-intensive tasks on big graphs.
•Fault tolerance. A centralized system is a single point of failure. In contrast, distributed systems are designed to be fault tolerant: if any machine fails, its data/results can be recovered from checkpoints/logs.
•Data loading/dumping overhead. Large-scale data load-ing is much faster in distributed systems than in centralized systems as the cost is shared by all machines in the cluster. An out-of-core centralized system does not need to load the entire graph into memory but stream the disk-resident graph in each iteration; however, often expensive pre-processing is required to reorganize the graph representation on disk so that the data access pattern can be as sequential as possible. Similarly, large-scale data dumping is also much faster in distributed systems than in centralized systems.
•Expressiveness. Some out-of-core systems are less expres-sive than in-memory systems, because efficient data stream-ing in out-of-core systems requires vertex state and edge value to have fixed size. For example, in triangle counting, a vertex needs to obtain the adjacency lists of its neighbors, and since the length of adjacency lists is not fixed, it is not clear how one can implement efficient triangle counting in such a system. Some out-of-core systems such Pregelix [6] relax this restriction by organizing vertices using B-tree structures, but additional overhead is incurred by the access and maintenance of the B-tree structure.
Centralized Distributed In-memory Galois, GraphChi-IM PowerGraph, Giraph Out-of-core GraphChi, X-Stream Pregelix, GraphD, Chaos
Table 2: Representative systems
In Sections 5 and 6, we will analyze all categories in details regarding their system performance and resource cost for processing various applications and datasets.
3
GRAPH ANALYTICS SYSTEM SURVEY
Given the long list of existing graph analytics systems, it is imprac-tical to enumerate every one of them. In this section, we briefly describe some of the most representative systems in each category (details can be found in the full version1), as summarized in Table 2. The emphases of our selection are availability, efficiency and de-ployability. Some of them are state-of-the-art [27], and some are widely used [3] in industry. We also use this list in our compara-tive study in Sections 5 and 6. More systems and related work are mentioned in Section 7.
3.1
In-Memory Distributed Systems
Pregel [21].Pregel [21] pioneered the idea of vertex-centric com-putation for graph analytics. With the vertex-centric model, a user thinks like a vertex and only needs to specify the computation logic of a vertex in a user-defined function (UDF),compute(msgs), and the system automatically executes thecomputefunction on all vertices. A Pregel program proceeds in iterations, and a vertex can be either activeorinactiveduring processing. When the current iteration has no active vertex and no message to be processed, then the program terminates.
Giraph [3].Apache Giraph is the open-source implementation of Pregel, which we used in our experimental study. Giraph was initially developed by Yahoo! and then optimized by Facebook re-searchers, who improved CPU utilization of Giraph by multithread-ing and reduced memory consumption by serializmultithread-ing vertex/edge and message objects into byte arrays.
PowerGraph [12].PowerGraph partitions a graph by the edges and adopts a new computation model calledGather-Apply-Scatter (GAS). In theGatherphase, a vertex collects data from its adjacent vertices and edges. The gathered data are then aggregated and used to update the value of the vertex in theApplyphase. In the Scatterphase, the vertex may activate its neighbors (to perform computation) along the adjacent edges.
3.2
Out-of-Core Centralized Systems
GraphChi [18].In GraphChi, vertices communicate with each other by putting and getting values on adjacent edges. To process a large graph using limited memory, GraphChi pre-partitions the vertices in multipleshards, where each shard also stores the value of each incoming edge of its vertices. Shards are loaded into memory for processing one after another. GraphChi also supports a selective
mode to avoid loading a shard if there is no active vertex in the shard.
X-Stream [28].X-Stream adopts an edge-centric scatter-gather model. Like in GraphChi, vertices are partitioned so that each par-tition fits in memory. An X-stream program has two phases in each iteration: scatter and gather. In both phases, each memory-resident partition itself is further partitioned into cache-resident chunks for parallel processing to improve cache locality. The weakness of X-Stream is that there is no mechanism like the selective mode of GraphChi.
3.3
Out-of-Core Distributed Systems
Pregelix [6].Pregelix is an out-of-core distributed system. It mod-els the Pregel API as a logical query plan, which is executed on a parallel dataflow engine called Hyracks [4]. In each iteration, the generated messages are joined with the set of vertices on the desti-nation vertex ID, and then each vertex callscompute(.) to process its received messages, update its value and generate new outgoing messages. To efficiently support sparse computation where vertices are managed by B-tree structures.
Chaos [27].Chaos [27] is the distributed version of X-Stream that attempts to use the aggregated disk bandwidth in a cluster. Edge scattering and gathering workloads are distributed among multiple machines, and work stealing is adopted for load balancing. To achieve desirable performance, Chaos requires that machines should be connected by high-speed network (e.g., 40GigE). GraphD [40].GraphD is an out-of-core Pregel-like system de-signed to run in a cluster of commodity machines connected by Gigabit Ethernet. It only requires each machine to keep the state information in memory, while the corresponding adjacency lists and incoming/outgoing messages are streamed on local disk. It skips inactive vertices to save disk IO, and message streams are organized into chunks to allow concurrent sending and appending. It claims to achieve similar performance to those of in-memory systems.
3.4
In-Memory Centralized Systems
Galois [24].Galois keeps the graph in memory and adopts a domain-specific language (DSL) to fully exploit the parallelism of all cores. The DSL followsamorphous data-parallelism(ADP) model [26] that supports speculative execution. Galois also sched-ules the computation of vertices in a machine-topology-aware man-ner.
GraphChi-IM.The GraphChi system described in Section 3.2 also supports an in-memory mode that keeps the array of vertex values in main memory. In this case, there is no need to write values to edges, since a vertex can directly obtain its in-neighbors’ values from memory to update its own value. We denote the in-memory mode of GraphChi byGraphChi-IM, and include it in our experi-ments by running it on a high-end server.
Algorithm Vertex Access Pattern Edge Direction
# of Iterations
SSSP Always low access rate requirementNo Linear to diameter HashMin High access rate at first, drastically decreasing Undirected Linear to diameter PageRank Always high access rate requirementNo Fixed
Triangle Counting
Always high access rate,
with random accesses Undirected Fixed
Table 3: Applications used for system evaluation
4
EVALUATION SETUP
In this section, we describe the setup for our comparative study, including the applications and datasets, the hardware environments and the metrics of evaluation.
4.1
Applications
To comprehensively evaluate the performance of the various sys-tems we described in Section 3, we select four applications that exhibit very different but representative vertex access patterns during their execution, which are summarized in Table 3. Those applications are either classic graph algorithms or frequently used in production. Among them, in every iteration,SSSPonly accesses a fraction of vertices, while bothPageRankandTriangle Counting access all vertices. The difference betweenTriangle Countingand PageRankis that, the former requires every vertex to fetch the adjacency lists of its neighbors for computation, and thus a large amount of random accesses to adjacency list data are inevitable. Finally,HashMinaccesses every vertex in the first iteration, but the fraction of vertices that are accessed decreases rapidly in each subsequent iteration. We now describe these four applications in more details.
4.1.1 SSSP.The SSSP algorithm finds the shortest-path distance from a user-specified source vertexsto every vertexvin the input graph, which is recorded as an attribute ofv, i.e.,d(v). Initially, d(s)is set to 0 andd(v)is set to+∞for every vertexv ,s, and onlysis activated. In each iteration, every active vertexvsends
(d(v)+w(v,u))to each out-neighboru, wherew(v,u)is the weight of edge(v,u). Then, when a vertexureceives the distance values from its in-neighbors, it checks whether the smallest valuemin is less thand(u); if so,d(u)is updated asmin, anduis activated for the next iteration. This process converges when every vertex vhas its shortest-path distance fromsind(v). In each iteration of SSSP, only vertices at the distance-propagation frontier perform computation.
4.1.2 HashMin.HashMin computes the connected components of an undirected graph by letting every vertexv propagate the smallest vertex ID thatvhas received, which is recorded as an attribute ofv, i.e.,min(v). Initially, every vertexvinitializesmin(v) as its own ID, and all vertices are activated for ID propagation. In each iteration, each active vertexvpassesmin(v)to its neighbors.
Architectural Implications on the Performance and Cost of Graph Analytics Systems SoCC ’17, September 24–27, 2017, Santa Clara, CA, USA
Then, when a vertexureceives the ID values from its neighbors, it checks whether the smallest valueminis less thanmin(u); if so, min(u)is updated asminanduis activated for the next iteration. This process converges when every vertexvhasmin(v)equal to the minimum vertex ID inv’s connected component. In each iteration of HashMin, only those vertices whose attributes are not converged perform computation.
4.1.3 PageRank. This algorithm [5] computes PageRank value for every vertexv(denoted bypr(v)), based on the graph topol-ogy. All vertices are active during the entire computation, and initiallypr(v)is set to 1 for every vertexv. In each iteration, each vertexvdistributespr(v)to its out-neighbors evenly by sending pr(v)/deд(v)to each neighbor, wheredeд(v)is the out-degree of v; each vertexvthen sums all received values, denoted bysum, and updatespr(v)as((1−d)+d·sum), wheredis the damping factor typically set to 0.85. This process stops either when the sum of PageRanks of all vertices converges, or when a pre-specified maximum iteration number is reached.
4.1.4 Triangle Counting.Let us denote the adjacency list of a vertexvbyΓ(v). The algorithm counts the number of triangles in an undirected graph. Specifically, each vertexvobtainsΓ(u)from each neighboru, to compute their common neighborsΓ(u)∩Γ(v). The number of triangles that involvevis computed by summing
|Γ(u)∩Γ(v)|of all neighborsu ∈ Γ(v). Note that each triangle
△vivjvkis counted three times, byvi,vjandvk, respectively. To
avoid duplicate counting, we may useΓ>(v)={u∈Γ(v)|u>v}
in place ofΓ(v), so that each triangle△vivjvk (w.l.o.g., assume vi <vj <vk) will only be counted byvi. Note that some
out-of-core systems (e.g., GraphChi [18] and X-Stream [28]) fix the size of the data passed from one vertex to another, and thus this particular triangle counting algorithm cannot be implemented in those systems.
4.2
Environment Setup and Datasets
Our experiments were run under three hardware settings available in our institution to evaluate the systems described in Section 3. The settings are listed as follows.
•Setting#1: A desktop PC with 4GB DDR3 RAM, a 3.2GHz CPU and 1TB 7.2K rpm hard drive. OS is 64 bit Ubuntu 14.04 LTS with Linux kernel 3.10.
•Setting#2: A server with 1TB DDR3 RAM, eight 2.2GHz CPUs and 600GB 15K rpm hard drive. OS is CentOS 7.3 with Linux kernel 3.10.
•Setting#3: A cluster of 21 servers (1 master and 20 slaves), each with 42GB DDR3 RAM, two 2.0GHz Intel Xeon E5-2620 CPUs and a 2TB 10K rpm hard drive, and OS is CentOS 6.5 with Linux kernel 2.6. The machines are connected by Gigabit Ethernet.
These settings are selected to cover the hardware required by the systems described in Section 3. We ran in-memory centralized systems in Setting #2 with 1TB RAM, so that a big graph can be kept in memory for processing. We ran out-of-core centralized systems in Setting #1 since those systems are designed to run on a cheap commodity PC [18]. Finally, distributed systems were run on
Category Setting NormalizePrice
IC #2 100
OC #1 1
Category Setting NormalizePrice
ID #3 200
OD #3 200
Category IC ID OC OD
Setting #2 #3 #1 #3
Table 4: Hardware used for each system category
Dataset Youtube USA Road Orkut Twitter Friendster Type undirected undirected undirected directed undirected
|V| 1.1M 24M 3.1M 52.6M 65.6M
|E| 3M 58.3M 117.2M 2B 3.6B
Max Degree 28.8K 9 33.3K 780K 5214
Avg Degree 5.27 2.4 76.28 37.3 55.1
Diameter 20 6142 10 18 32
File Size 46.8MB 715.4MB 1.7GB 13.7GB 30.6GB Table 5: Datasets (B = 1,000M, M = 1,000K, K = 1,000)
the cluster of Setting #3. Although we ran both out-of-core and in-memory distributed systems in Setting #3, we monitored the actual resources consumed during execution, to calibrate the resource costs (e.g., memory space) of various systems. Table 4 summarizes the settings used for each category of systems.
We used five real-world graph datasets in our experiments: Youtube2,USA Road3,Orkut4,Twitter5, andFriendster6. These graphs have different scales and characteristics (e.g., average degree, diam-eter), which are summarized in Table 5.
4.3
Performance Metrics
We next introduce the performance metrics that we adopt to report our experimental results.
• Running Time (seconds): This metric measures the end-to-end execution time a system takes to complete a job, in-cluding the time of loading a graph from disk(s) to memory, and that of dumping the result to disk(s). Note that all the systems we evaluated are open-source projects, and there are online tutorials about how to compile, execute and tune their performance. While we used the default configuration of each system to test their performance, we also carefully set other parameters to maximally utilize our hardware re-sources, for example, full cores were used and sufficient memory was allocated.
• Performance-Aware Cost (PAC): This metric combines resource cost and running time together, so that a job that takes longer to run on the same hardware will have a higher PAC. The details on the PAC definition are described below. The PAC metric is defined in terms of the resource cost of a job, which is as follows:
ResourceCost =|CPU| ×Pricecpu+|Mem| ×Pricemem,
where|CPU|is the number of CPUs used,|Mem|is the unit of memory consumed,Pricecpuis the price of each CPU of that
set-ting andPricememis the price of per unit memory.ResourceCost 2https://snap.stanford.edu/data/com-Youtube.html
3http://www.dis.uniroma1.it/challenge9/download.shtml 4http://konect.uni-koblenz.de/networks/orkut-links 5http://konect.uni-koblenz.de/networks/twittermpi 6http://snap.stanford.edu/data/com-Friendster.html
Instance A1 A2 A3 A4 A5 A6 A7
# of Cores 1 2 4 8 2 4 8
RAM (GB) 1.75 3.5 7 14 14 28 56
Price ($/h) 0.09 0.18 0.36 0.72 0.33 0.66 1.32 Table 6: Pricing of Microsoft Azure Standard Tier VMs [1]
indicates the hardware capacity in order to handle the workload, which is related to instance prices (per time unit) in commercial cloud platforms. We do not include cost of local disk storage as they tend to be significantly cheaper than memory and CPU. In our calculations ofResourceCost, we use the maximum number of CPU cores as the degree of job parallelism permits. Likewise, we use the maximum memory consumption by a job for|Mem|, since this is what one needs to do in a cloud platform to run the job. Also, we assume that the memory expense is proportional to|Mem|, which is in accordance with the existing cloud services.
Since the hardware used in our experiments is not exactly identi-cal to an existing public cloud, we plug in values that are consistent with the pricing models of public clouds, yet reflect the relative price differences across different hardware that we use. For each hardware setup in our experiments, we use the publicly available pricing information to set the value ofPricecpuandPricemem. This
is a tunable parameter in our framework and can be updated in future as prices change. Note that ourResourceCostformulation is in line with pricing models in public clouds. For example, in Mi-crosoft Azure, the instance pricing of Standard Tier VMs is shown in Table 6, where the price is proportional to the RAM size when the number of cores is fixed.
The PAC metric is proportional to both the running time and the resource cost.
PAC=RunninдTime×ResourceCost.
Intuitively, the PAC metric is based on a typical pricing model in a public cloud infrastructure, which charges based on running time on a particular instance. We report the normalized PAC results for comparison in Section 6. Comparing the PAC values between different jobs approximates the comparison of their monetary costs in a commercial cloud computing platform.
5
RUNNING TIME EVALUATION
In our experimental section, we compare the running time of dif-ferent systems across difdif-ferent applications and datasets. We defer PAC to the next section.
5.1
Summary
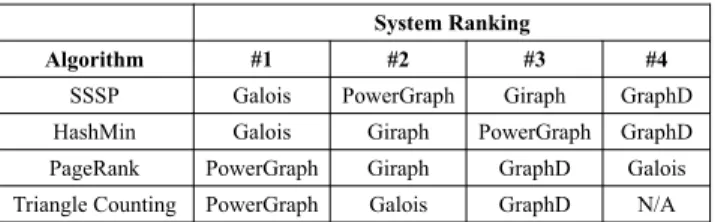
We aggregate the running time of each system by application and dataset respectively, and select the top four systems. The overall system performance ranking for each application is shown in Ta-ble 7. Note that in Triangle Counting, only three systems are aTa-ble to finish within twenty-four hours. Our table lists the four applica-tions based on the overall computation load (SSSP being the lightest, while Triangle Counting the heaviest). Note that even though Tri-angle Counting has the least number of iterations, each iteration
System Ranking
Algorithm #1 #2 #3 #4
SSSP Galois PowerGraph Giraph GraphD
HashMin Galois Giraph PowerGraph GraphD
PageRank PowerGraph Giraph GraphD Galois
Triangle Counting PowerGraph Galois GraphD N/A
Table 7: System running time ranking by application System Ranking
Dataset #1 #2 #3 #4
Youtube Galois GraphChi-IM GraphChi X-Stream
USA Road Galois GraphChi-IM Giraph PowerGraph
Orkut Galois PowerGraph GraphChi-IM Giraph
Twitter PowerGraph Giraph Galois GraphChi-IM
Friendster PowerGraph Giraph Galois GraphD
Table 8: System running time ranking by dataset
is computationally expensive, and hence it incurs the highest load overall.
We rank the systems based on their performance, breakdown by application (Table 7) and dataset (Table 8). In Table 7, to provide an aggregate performance value, we sum up the processing time for each application across all the datasets and take the average. We make the following observations. Likewise, when aggregating by datasets, we take the average processing time that each system takes for all successful applications.
Many iterations, low compute-intensive applications.First, we observe that when an application runs for a large number of iterations and the computation in each iteration is not heavy (typi-fied by SSSP and HashMin), an in-memory centralized system such as Galois always gives the best performance. This is because there is no synchronization overhead on disk or network I/O between iterations for in-memory centralized systems7Two in-memory distributed systems (PowerGraph and Giraph) also perform well, taking in the second and the third positions. Between PowerGraph and Giraph, the differences in running time is negligible. Few iterations, compute-intensive or bandwidth-intensive applications.For computationally intensive jobs such as PageRank and Triangle Counting, however, distributed systems (PowerGraph and Giraph) tend to outperform centralized systems (Galois). Pow-erGraph has the best performance, demonstrating the benefits of parallel processing of compute intensive jobs. Here, we observe that even the out-of-core distributed system, GraphD, outperforms the in-memory Galois for PageRank computation. On the other hand, for Triangle Counting, Galois performs better than GraphD because it is more bandwidth-intensive compared to PageRank, since an entire adjacent list (and not just a vertex value) needs to be transmitted for each iteration. This significantly increases network and disk I/O overhead, which penalizes out-of-core systems such as GraphD.
7The other in-memory centralized system GraphChi-IM, however, is not in the list as the system has difficulty completing the processing of theFriendstergraph, which is our largest dataset.
Architectural Implications on the Performance and Cost of Graph Analytics Systems SoCC ’17, September 24–27, 2017, Santa Clara, CA, USA
Scalability analysis.We observe interesting trends across datasets as they scale (Table 8). For the smallest dataset (Youtube), all cen-tralized systems, no matter in-memory or out-of-core, out-perform distributed systems. The reason is that the overhead of commu-nication among machines outweighs the computation reduction gained by a distributed system. When the input dataset becomes larger, as onUSA Road, although in-memory centralized systems still have the best performance, centralized out-of-core systems are not as efficient as in-memory distributed systems. However, when the dataset size continues to increase, as in the case ofOrkut, PowerGraph overtakes GraphChi-IM in second place, while Giraph is in fourth place. When the dataset reaches billion-edge scale, as in the cases ofTwitterandFriendster, the two in-memory distributed systems PowerGraph and Giraph provide the best performance. All in all, our scalability analysis suggests that in-memory central-ized systems are best suited for small datasets, while large datasets benefit from in-memory distributed systems.
5.2
Detailed Analysis
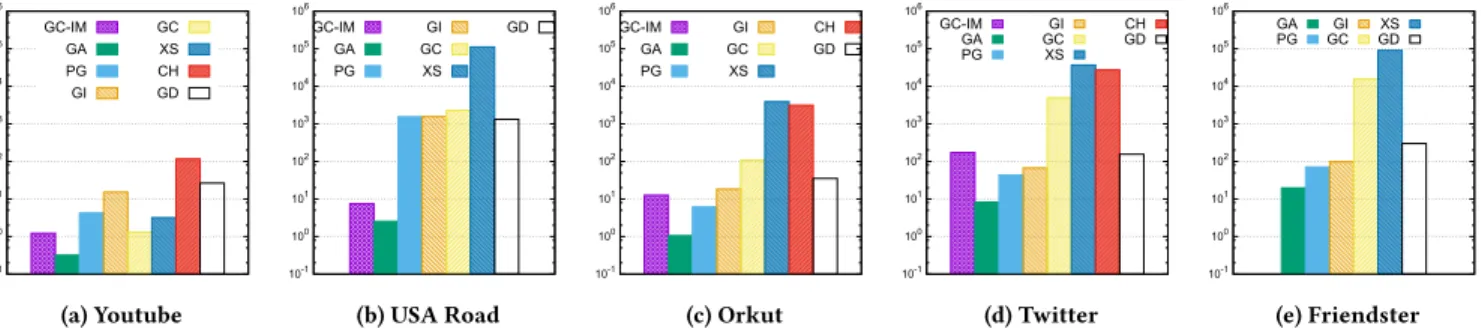
We now analyze the running time of different systems in each application and on each dataset. Due to space limit, we simplify the analysis here. More details can be found in the full version1. Running time of SSSP.In this set of experiments, for each dataset, we randomly selected ten source vertices for running SSSP. Each reported result was averaged over the 10 runs. Figure 1 reports the running time of various systems over the datasets. We do not report the performance of Pregelix, since even though we tried our best to tune the configuration of Pregelix, the experiment of SSSP kept crashing and could not finish successfully.
Figure 1a) shows that onYoutube, Galois has the best mance, and all the centralized systems exhibit much better perfor-mance than distributed systems. It is because running distributed systems on small graphs is inefficient as the communication cost between machines outweighs the per-machine computation work-load.
AlthoughUSA Roadis also not big, Figure 1b) shows that Graph-Chi is slower than the distributed systems, while X-Stream and Chaos could not even finish in 24 hours. The drastic performance difference is caused by the larger diameter ofUSA Road, and thus the computation takes many iterations. Out-of-core systems need to stream the entire graph from disk(s), and thus each iteration is much more costly than in-memory systems.
In Figure 1c), although Galois continues to outperform the other systems, GraphChi-IM is slower than PowerGraph and comparable to Giraph. This shows that the size ofOrkutis large enough so that the reduced per-machine computation workload offsets the communication overhead. As a distributed version of X-Stream, Chaos has slightly better performance than X-Stream.
Figure 1d) reports the results onTwitterwhich is tens of times larger thanOrkut. Figure 1d) shows that all the distributed sys-tems, except Chaos, outperform GraphChi-IM, demonstrating their strength for processing big graphs. Figure 1e) reports the results of the largest dataset,Friendster, and only five systems could complete the processing within 24 hours. In particular, GraphChi-IM could not even finish preprocessing within 24 hours (and thus no results for all applications).
Figure 5 compares the systems in terms of categories (rather than individually). For each category, we use the fastest system as its representative (for each dataset). ExceptUSA Road, the result shows that the running time increases with the graph size for all categories. IC is always the fastest while OC is good at processing small datasets, but it becomes much slower than the other categories as the dataset size becomes larger, as the disk bandwidth is the bottleneck and cannot be increased by scaling out. Overall, the running time is ranked as IC<ID<OD<OC. For large-diameter graphs likeUSA Road, distributed (resp. out-of-core) systems are much slower than IC since expensive network synchronization (resp. disk streaming) is performed for many iterations.
Running Time of HashMin. We ran HashMin on undirected graphs. Figure 2 reports the results. HashMin has a heavier com-putation workload than SSSP, since all vertices are active at the beginning of the application. Thus, we could not obtain more results for HashMin within reasonable time than for SSSP.
Figure 2a) shows that centralized systems still beat distributed systems onYoutube. Figure 2b) shows the results when a large number of iterations are required, for which in-memory systems are much faster than out-of-core ones. Figures 2c) and d) show that for larger graphs, the performance gap between OC systems and other categories of systems becomes larger (almost two orders of magnitude forFriendster). Also, the performance of IC systems and distributed systems (except Chaos) is relatively close for the two larger graphs.
Figure 6 compares the running time of HashMin at the system-category level. We observe similar patterns as in Figure 5, but the performance gap between IC and ID is now much smaller on the large graphs, because HashMin has a heavier computation workload and hence distributed computing helps more than in the case of SSSP.
Running Time of PageRank. PageRank is not a traversal style application (like SSSP and HashMin), and hence the number of iterations needed for computing PageRank does not depend on the graph diameter. We ran 10 iterations in each experiment. But note that each iteration has a heavier computation workload than HashMin, since all vertices are active in every iteration. Except for GraphChi-IM, which did not finish onFriendster, all the experiments successfully finished in 24 hours.
Figure 3a) shows that for this smallest dataset, centralized sys-tems still have better performance than distributed ones due to the overhead of distributed computing. Among distributed systems, PowerGraph has the best performance. In Figure 3b), GraphChi competes all OD systems, and the performance of GraphD is close to Giraph, which is an in-memory distributed system.
Chaos is now many times faster than X-Stream in Figures 3c)–e), since for the larger datasets the reduced per-machine computa-tion workload offsets the communicacomputa-tion overhead. PowerGraph achieves comparable performance as Galois and GraphChi-IM in Figure 3c), and is the fastest system in Figures 3d) and e), which shows thatin-memory distributed architecture is the fastest for pro-cessing heavy-workload computation on large graphs (when the num-ber of iterations is not large). This is very different from what we observed in Figure 1, where Galois always has the best performance.
10-1 100 101 102 103 104 105 106 GC-IM GA PG GI GC XS CH GD (a) Youtube 10-1 100 101 102 103 104 105 106 GC-IM GA PG GI GC XS GD
(b) USA Road
10-1 100 101 102 103 104 105 106 GC-IM GA PG GI GC XS CH GD (c) Orkut 10-1 100 101 102 103 104 105 106 GC-IM GA PG GI GC XS CH GD (d) Twitter 10-1 100 101 102 103 104 105 106 GA
PG GCGI GDXS
(e) Friendster
Figure 1: Running time of SSSP (seconds). GC-IM, GA, PG, GI, GC, XS, CH, and GD represent GraphChi-IM, Galois, PowerGraph, Giraph, GraphChi, X-Stream, Chaos, and GraphD respectively. The categorization of the systems are as follows: (IC: GC-IM, GA), (ID: PG, GI), (OC: GC, XS), (OD: CH, GD). Note that the legends apply to Figures 1-4.
100 101 102 103 104 105 GC-IM GA PG GI GC XS CH GD PR (a) Youtube 100 101 102 103 104 105 GC-IM
GA PGGI GCGD
(b) USA Road
100 101 102 103 104 105 GC-IM GA PG GI GC XS GD PR (c) Orkut 100 101 102 103 104 105 GA PG GI GC XS GD (d) Friendster
Figure 2: Running time of HashMin (seconds). PR represents Pregelix (which is in OD).
10-1 100 101 102 103 104 105 GC-IM GA PG GI GC XS CH GD PR (a) Youtube 10-1 100 101 102 103 104 105 GC-IM GA PG GI GC XS CH GD PR
(b) USA Road
10-1 100 101 102 103 104 105 GC-IM GA PG GI GC XS CH GD PR (c) Orkut 10-1 100 101 102 103 104 105 GC-IM GA PG GI GC XS CH GD PR (d) Twitter 10-1 100 101 102 103 104 105 GA
PG GCGI CHXS GDPR
(e) Friendster
Figure 3: Running time of PageRank (seconds)
10-1 100 101 102 103 104 105 GC-IM GA PG GI GD PR (a) Youtube 10-1 100 101 102 103 104 105 GC-IM GA PG GI GD PR
(b) USA Road
10-1 100 101 102 103 104 105 GC-IM GA PG GD PR (c) Orkut 10-1 100 101 102 103 104 105
GA PG GD
(d) Friendster
Figure 4: Running time of Triangle Counting (seconds) Figure 7 shows the PageRank running time comparison at the
system-category level, which is quite different from Figure 5 and Figure 6. Firstly, the “IC” curve is no longer always at the bottom,
and is actually surpassed by distributed systems (i.e., ID and OD) onFriendster, which means the scalability of “IC” is worse than distributed systems for this application with heavier workload.
Architectural Implications on the Performance and Cost of Graph Analytics Systems SoCC ’17, September 24–27, 2017, Santa Clara, CA, USA
10-1
100
101
102
103
104
105
Youtube USA Road Orkut Twitter Friendster
IC ID OC OD
Figure 5:Categorical comparison of SSSP running time (seconds)
100 101 102 103 104 105
Youtube USA Road Orkut Friendster
IC ID OC OD
Figure 6:Categorical comparison of HashMin running time (sec-onds)
Figure 7 also shows that in-memory systems are always faster than out-of-core systems.
Running Time of Triangle Counting. Triangle counting re-quires each vertex to obtain its neighbors’ adjacency lists. It has the heaviest workload among all the applications, and the number of iterations is the smallest.
This application needs the input graph to be undirected, thus, we excludeTwitterfrom the experiments. Moreover, GraphChi, X-Stream and Chaos fix the size of a message, and thus cannot implement triangle counting which requires transmitting variable-length adjacency lists. Giraph ran out of memory onOrkutand Friendster. Finally, Pregelix could not finish processingFriendster within 24 hours.
The results are shown in Figure 4. PowerGraph is always the fastest system because of the heavy computation workload (except for USA Road which only has few triangles, as shown in Figure 4b). All other distributed systems, Giraph, Pregelix and GraphD, adopt the message-passing model rather than a shared-memory abstrac-tion as does in PowerGraph. Thus, the adjacency list data of a vertex need to be pushed to its neighbors, icurring data transmission and storage. As a result, they are much slower than PowerGraph and the IC systems.
We show the categorical comparison results in Figure 8. ID is faster than IC on the large graphs, and thus has better scalability. In contrast, OD has the worst performance, and much worse than both ID and IC.
10-1
100
101
102
103
104
105
Youtube USA Road Orkut Twitter Friendster
IC ID OC OD
Figure 7:Categorical comparison of PageRank running time (sec-onds)
10-1 100 101 102 103 104 105
Youtube USA Road Orkut Friendster
IC ID OD
Figure 8:Categorical comparison of Triangle Counting running time (seconds)
System Ranking
Algorithm #1 #2 #3 #4
SSSP Galois GraphChi PowerGraph Giraph
HashMin Galois GraphChi Giraph PowerGraph
PageRank GraphChi PowerGraph X-Stream GraphD
Triangle Counting PowerGraph Galois GraphD N/A
Table 9: System PAC ranking by application
System Ranking
Dataset #1 #2 #3 #4
Youtube GraphChi X-Stream Galois GraphChi-IM
USA Road Galois GraphChi-IM GraphChi Giraph
Orkut GraphChi PowerGraph Galois GraphChi-IM
Twitter PowerGraph GraphChi Galois GraphD
Friendster PowerGraph GraphChi Giraph GraphD
Table 10: System PAC ranking by dataset
6
PAC EVALUATION
The comparison based on running time only concerns about which system (or category of systems) can finish a job faster. However, efficiency may often come at the expense of higher hardware cost. If time is not the most critical criterion (e.g., in an offline graph analytics such as PageRank computation), a more economical so-lution could be more attractive. We now describe the comparison based on the performance-aware cost (PAC) of different systems, the findings of which are quite different from those in Section 5.2.
100 101 102 103 104 105
Youtube USA Road Orkut Twitter Friendster
IC ID OC OD
Figure 9:Categorical comparison of PAC for SSSP
100 101 102 103 104 105 106
Youtube USA Road Orkut Friendster
IC ID OC OD
Figure 10:Categorical comparison of PAC for HashMin
6.1
Summary
Table 9 and Table 10 show the relative rankings of the top 4 systems using the PAC metric, aggregated by the application and dataset, in a similar fashion as described in Section 5.1. We make the following observations.
Many iterations, low-compute intensive applications. Revis-iting the earlier SSSP and HashMin applications, we note that the best performing system (Galois) also has the lowest PAC. GraphChi is in second place because of its low resource cost (given that it does out-of-core operations) and reasonable speed. Although X-Stream consumes similar resources as GraphChi, it is not among the top four due to its longer running time. Instead, GraphChi is followed by two in-memory distributed systems (PowerGraph and Giraph). The strong performance of these systems cannot compensate for their higher costs compared with GraphChi.
Few iterations, high compute/bandwidth intensive applica-tions.For the PageRank applications, GraphChi has the lowest PAC, and the other two out-of-core systems, X-Stream and GraphD, also make into the top four. This shows that out-of-core systems (es-pecially centralized) are cost effective in applications with heavier computation but few iterations. The second-ranked PowerGraph requires more costly resources, but this is compensated by its high throughput (and hence fast completion time). The ranking for Tri-angle Counting is the same as Table 7. This is because for this heaviest-workload task, both PowerGraph and Galois have short running time, which offsets their higher costs, resulting in lower overall PAC. (see Section 6.2 for details.)
Scalability analysis. When the dataset is small, as in the case ofYoutube, out-of-core centralized systems are the best choice because of low resource cost and reasonably high speed. However,
100 101 102 103 104 105 106
Youtube USA Road Orkut Twitter Friendster
IC ID OC OD
Figure 11:Categorical comparison of PAC for PageRank
100 101 102 103 104 105 106
Youtube USA Road Orkut Friendster
IC ID OD
Figure 12:Categorical comparison of PAC for Triangle Counting
the comparison of PAC forUSA RoadandOrkutshows that they are not good choices for large-diameter graphs that requires multiple iterations (even when the dataset itself is small). Instead, in-memory centralized systems are the best choices for handling large-diameter graphs. When datasets become larger, as in the case ofTwitter andFriendster, PowerGraph replaces GraphChi to become the best system that balances resource cost and job processing speed. But GraphChi still has a lower PAC than the other systems. Overall, we observe that when the input graph reaches billion-edge scale, it is always better to choose in-memory distributed systems for high speed or out-of-core centralized systems for saving costs.
6.2
Cross-Category Analysis of PAC
We omit the detailed analysis of different systems’ PAC in each application and for each dataset due to space limit. These details can be found in the full version report1. We analyze the cross-category comparison results in PAC metric, where we normalize all PACs to the smallest one to get relative PACs as mentioned in Section 4.3. PAC of SSSP.Figure 9 shows the PAC comparison at the system-category level, where we selected the system with the lowest PAC in each category to represent the PAC of that category. IC is always the best except on the smallest dataset and OD is always the worst except on the largest dataset, where the two exceptions are both OC. Thus, OC cannot scale to handle large graphs as what we observed in Figure 5. However, compared to Figure 5 where OC is always the worst category except on the smallest graph, OC’s PAC is significanly lower than distributed systems on most graphs. This shows the advantages of OC on saving cost. ID always performs
Architectural Implications on the Performance and Cost of Graph Analytics Systems SoCC ’17, September 24–27, 2017, Santa Clara, CA, USA
better than OD, which shows that running out-of-core distributed systems is costly.
PAC of HashMin.Figure 10 reports the PAC comparison at the system-category level for HashMin, which is similar to that in Figure 9. The difference is that IC is not as dominant as in Figure 9 and OC becomes better. Except on the large-diameter graph, i.e., USA Road, the gap between IC and OC on the large graphs is much smaller than in Figure 9 and so is the gap between IC and ID/OD. In fact, forOrkutandFriendster, the PAC of ID is nearly the same as that of IC, which shows that ID works better when the workload is more computationally intensive. OC is now better than all distributed systems, except worse than ID on the largest graph. In contrast, although OD is also designed to be cost effictive, it has has the greatest PAC in this application.
PAC of PageRank.Figure 11 reports the results for PageRank, which shows that the PAC is consistently ranked as OC<IC and ID<OD on all datasets. As the graph size becomes larger, the curves of distributed systems grow slower than centralized systems, which shows that distributed systems have better PAC scalability on dataset size than centralized systems. This result is interesting as it shows thatout-of-core systems may not be always more cost-effective, and there is a point distributed systems can be the most cost-effective choice. Compared with Figure 7, OC turns from the worst to the best system category overall, which means that OC performs well in heavy workloads considering the available resources.
PAC of Triangle Counting.The results for triangle counting are shown in Figure 12. OD still has the largest PAC, which shows that out-of-core execution is not suitable for this application due to the huge amount of intermediate data (i.e., adjacency lists). Although ID has higher PAC onUSA Roadthan IC because of few triangles and thus light computation, it is better than IC in all the other cases (even on small graphs). Combined with the results shown in Figure 8, we can see that ID not only achieves high processing speed but also is cost efficient, and hence the best choice for this type of workloads.
7
RELATED WORK
System selection. Many distributed [3, 6, 8, 12, 13, 15, 17, 21, 29, 32, 35–37, 39, 44] and centralized [9, 25, 33, 34, 38, 45] graph an-alytics systems have been developed. Even though we selected various representative systems covering all categories, there are still a number of systems we did not include in our study, and here we explain why they were not considered besides the limited space. GraphX [13] is a graph engine built on top of Spark [43] provid-ing both vertex-centric and GAS abstractions. It is optimized for graphs, and thus much more efficient than Spark. However it is outperformed by PowerGraph and Giraph in some applications as reported in [13]. Recently, some systems have been developed to efficiently evaluate declarative graph queries, such as SociaLite [31] and Emptyheaded [2]. However, such systems focus on abstrac-tions and their performance cannot compete with low level graph engines, for example, Galois, as reported in [2].
Graph analytics system measurement. There have also been a number of experimental studies on some graph analytics sys-tems, but they are all limited to the comparison of systems within
the same category/setting. Elser et al. [10] compared Pregel-like systems with MapReduce, but the datasets used are small, and most of the systems are not the state-of-the-art or representative systems. Guo et al. [14] designed a benchmark to evaluate graph processing platforms, but only in-memory distributed systems were considered. Satish et al. [30] designed various metrics to evaluate several systems in both centralized and distributed environments, but systems were compared only within the same environment. Han et al. [16] and Lu et al. [20] conducted comprehensive compar-ison of in-memory distributed vertex-centric systems, while [20] also compared the running time of these systems with GraphChi. Li et al. [19] analyzed the performance differences of a number of general-purpose distributed systems such as Spark, Flink, Na-iad [23], and Husky [41, 42]. They also examined the performance of these systems on some graph algorithms, but the scope is rather limited. [22] showed that some distributed systems have worse performance than a raw single-threaded implementation, but it may not be fair to compare the performance of general-purpose graph systems with that of a specialized implementation of a graph algorithm.We are the first to cover all the quadrants of the two di-mensions, and the findings from our systematic study are insightful for graph analytics system selection and development.
8
CONCLUSIONS
We classified existing graph analytics systems into four categories according to their hardware requirements and architectural differ-ences, analyzed the strengths and limitations of the systems in each category, and compared them in terms of their running time and resource cost. Many interesting findings are observed. For example, in-memory centralized systems are always the best for graph traver-sal applications on large-diameter graphs and fastest for processing small graphs with lighter workloads, but they perform worse (even when memory is sufficient) than in-memory distributed systems when computation workload is heavy and the input graph is large. For in-memory execution, distributed systems are generally slower than centralized ones for jobs that require many iterations, as syn-chronization between machines is costly. Out-of-core systems are not suitable for processing large-diameter graphs due to the high cost of streaming data from/to disk, but out-of-core centralized sys-tems are a good choice to balance resource cost and running time for computationally intensive workloads (even on large graphs). More detailed conclusions about our analysis are given in Sections 2, 5 and 6. A follow-up to this work is to perform an in-depth analysis on the performance difference between selected pairs of systems, and study whether the performance gap and what fraction of the gap comes specific system design and implementation choices such as barrier synchronization, shuffling, message combiner, memory access patterns, etc. We will also investigate the performance of various systems on extremely large graphs with different graph characteristics.
ACKNOWLEDGMENTS
We appreciate the valuable comments and suggestions from the anonymous reviewers and our shepherd Pinar Tozun. Qizhen Zhang, Hongzhi Chen, Da Yan, and James Cheng were partially supported by Grants (CUHK 14206715 & 14222816) from the Hong Kong RGC,
MSRA grant 6904224, ITF 6904079, and Grant 3132821 funded by the Research Committee of CUHK. This work was funded in part by NSF CNS-1513679, NSF CNS-1218066, NSF OAC-1541310 and CNS-1229282.
REFERENCES
[1] Microsoft Azure: https://azure.microsoft.com/en-us/pricing/details/ virtual-machines/#Windows.
[2] C. R. Aberger, S. Tu, K. Olukotun, and C. Ré. Emptyheaded: A relational engine for graph processing. InProceedings of the 2016 International Conference on Management of Data, SIGMOD Conference 2016, San Francisco, CA, USA, June 26 -July 01, 2016, pages 431–446, 2016.
[3] Apache Giraph. http://giraph.apache.org/.
[4] V. R. Borkar, M. J. Carey, R. Grover, N. Onose, and R. Vernica. Hyracks: A flexible and extensible foundation for data-intensive computing. InICDE 2011, April 11-16, 2011, Hannover, Germany, pages 1151–1162, 2011.
[5] S. Brin and L. Page. The anatomy of a large-scale hypertextual web search engine. Computer Networks, 30(1-7):107–117, 1998.
[6] Y. Bu, V. R. Borkar, J. Jia, M. J. Carey, and T. Condie. Pregelix: Big(ger) graph analytics on a dataflow engine.PVLDB, 8(2):161–172, 2014.
[7] M. Capota, T. Hegeman, A. Iosup, A. Prat-Pérez, O. Erling, and P. A. Boncz. Graph-alytics: A big data benchmark for graph-processing platforms. InProceedings of the Third International Workshop on Graph Data Management Experiences and Systems, GRADES 2015, Melbourne, VIC, Australia, May 31 - June 4, 2015, pages 7:1–7:6, 2015.
[8] R. Chen, J. Shi, Y. Chen, and H. Chen. Powerlyra: differentiated graph computation and partitioning on skewed graphs. InEuroSys, pages 1:1–1:15, 2015. [9] J. Cheng, Q. Liu, Z. Li, W. Fan, J. C. S. Lui, and C. He. VENUS: vertex-centric
streamlined graph computation on a single PC. InICDE, pages 1131–1142, 2015. [10] B. Elser and A. Montresor. An evaluation study of bigdata frameworks for graph processing. InProceedings of the 2013 IEEE International Conference on Big Data, 6-9 October 2013, Santa Clara, CA, USA, pages 60–67, 2013.
[11] Y. Gao, W. Zhou, J. Han, D. Meng, Z. Zhang, and Z. Xu. An evaluation and analysis of graph processing frameworks on five key issues. InProceedings of the 12th ACM International Conference on Computing Frontiers, CF’15, Ischia, Italy, May 18-21, 2015, pages 11:1–11:8, 2015.
[12] J. E. Gonzalez, Y. Low, H. Gu, D. Bickson, and C. Guestrin. Powergraph: Dis-tributed graph-parallel computation on natural graphs. InPresented as part of the 10th USENIX Symposium on Operating Systems Design and Implementation (OSDI 12), pages 17–30, Hollywood, CA, 2012. USENIX.
[13] J. E. Gonzalez, R. S. Xin, A. Dave, D. Crankshaw, M. J. Franklin, and I. Stoica. Graphx: Graph processing in a distributed dataflow framework. InOSDI, pages 599–613, 2014.
[14] Y. Guo, M. Biczak, A. L. Varbanescu, A. Iosup, C. Martella, and T. L. Willke. How well do graph-processing platforms perform? an empirical performance evaluation and analysis. In2014 IEEE 28th International Parallel and Distributed Processing Symposium, Phoenix, AZ, USA, May 19-23, 2014, pages 395–404, 2014. [15] M. Han and K. Daudjee. Giraph unchained: Barrierless asynchronous parallel execution in pregel-like graph processing systems.PVLDB, 8(9):950–961, 2015. [16] M. Han, K. Daudjee, K. Ammar, M. T. Özsu, X. Wang, and T. Jin. An experimental
comparison of pregel-like graph processing systems.PVLDB, 7(12):1047–1058, 2014.
[17] Z. Khayyat, K. Awara, A. Alonazi, H. Jamjoom, D. Williams, and P. Kalnis. Mizan: a system for dynamic load balancing in large-scale graph processing. InEuroSys, pages 169–182, 2013.
[18] A. Kyrola, G. E. Blelloch, and C. Guestrin. Graphchi: Large-scale graph computa-tion on just a PC. InOSDI 2012, Hollywood, CA, USA, October 8-10, 2012, pages 31–46, 2012.
[19] J. Li, J. Cheng, Y. Zhao, F. Yang, Y. Huang, H. Chen, and R. Zhao. A comparison of general-purpose distributed systems for data processing. In2016 IEEE Interna-tional Conference on Big Data, BigData 2016, Washington DC, USA, December 5-8, 2016, pages 378–383, 2016.
[20] Y. Lu, J. Cheng, D. Yan, and H. Wu. Large-scale distributed graph computing systems: An experimental evaluation.PVLDB, 8(3):281–292, 2014.
[21] G. Malewicz, M. H. Austern, A. J. C. Bik, J. C. Dehnert, I. Horn, N. Leiser, and G. Czajkowski. Pregel: a system for large-scale graph processing. InProceedings of the ACM SIGMOD International Conference on Management of Data, SIGMOD 2010, Indianapolis, Indiana, USA, June 6-10, 2010, pages 135–146, 2010. [22] F. McSherry, M. Isard, and D. G. Murray. Scalability! but at what cost? In15th
Workshop on Hot Topics in Operating Systems (HotOS XV), Kartause Ittingen, Switzerland, May 2015. USENIX Association.
[23] D. G. Murray, F. McSherry, R. Isaacs, M. Isard, P. Barham, and M. Abadi. Naiad: a timely dataflow system. InSOSP, pages 439–455, 2013.
[24] D. Nguyen, A. Lenharth, and K. Pingali. A lightweight infrastructure for graph analytics. InACM SIGOPS 24th Symposium on Operating Systems Principles, SOSP
’13, Farmington, PA, USA, November 3-6, 2013, pages 456–471, 2013.
[25] Y. Perez, R. Sosic, A. Banerjee, R. Puttagunta, M. Raison, P. Shah, and J. Leskovec. Ringo: Interactive graph analytics on big-memory machines. InSIGMOD, pages 1105–1110, 2015.
[26] K. Pingali, D. Nguyen, M. Kulkarni, M. Burtscher, M. A. Hassaan, R. Kaleem, T. Lee, A. Lenharth, R. Manevich, M. Méndez-Lojo, D. Prountzos, and X. Sui. The tao of parallelism in algorithms. InProceedings of the 32nd ACM SIGPLAN Conference on Programming Language Design and Implementation, PLDI 2011, San Jose, CA, USA, June 4-8, 2011, pages 12–25, 2011.
[27] A. Roy, L. Bindschaedler, J. Malicevic, and W. Zwaenepoel. Chaos: scale-out graph processing from secondary storage. InProceedings of the 25th Symposium on Operating Systems Principles, SOSP 2015, Monterey, CA, USA, October 4-7, 2015, pages 410–424, 2015.
[28] A. Roy, I. Mihailovic, and W. Zwaenepoel. X-stream: edge-centric graph process-ing usprocess-ing streamprocess-ing partitions. InACM SIGOPS 24th Symposium on Operating Systems Principles, SOSP ’13, Farmington, PA, USA, November 3-6, 2013, pages 472–488, 2013.
[29] S. Salihoglu and J. Widom. GPS: a graph processing system. InConference on Scientific and Statistical Database Management, SSDBM ’13, Baltimore, MD, USA, July 29 - 31, 2013, pages 22:1–22:12, 2013.
[30] N. Satish, N. Sundaram, M. M. A. Patwary, J. Seo, J. Park, M. A. Hassaan, S. Sen-gupta, Z. Yin, and P. Dubey. Navigating the maze of graph analytics frameworks using massive graph datasets. InInternational Conference on Management of Data, SIGMOD 2014, Snowbird, UT, USA, June 22-27, 2014, pages 979–990, 2014. [31] J. Seo, S. Guo, and M. S. Lam. Socialite: Datalog extensions for efficient social
network analysis. In29th IEEE International Conference on Data Engineering, ICDE 2013, Brisbane, Australia, April 8-12, 2013, pages 278–289, 2013. [32] Z. Shang and J. X. Yu. Catch the wind: Graph workload balancing on cloud. In
ICDE, pages 553–564, 2013.
[33] J. Shun and G. E. Blelloch. Ligra: a lightweight graph processing framework for shared memory. InPPoPP, pages 135–146, 2013.
[34] N. Sundaram, N. Satish, M. M. A. Patwary, S. Dulloor, M. J. Anderson, S. G. Vadlamudi, D. Das, and P. Dubey. Graphmat: High performance graph analytics made productive.PVLDB, 8(11):1214–1225, 2015.
[35] Y. Tian, A. Balmin, S. A. Corsten, S. Tatikonda, and J. McPherson. From ”think like a vertex” to “think like a graph”.PVLDB, 7(3):193–204, 2013.
[36] M. Wu, F. Yang, J. Xue, W. Xiao, Y. Miao, L. Wei, H. Lin, Y. Dai, and L. Zhou. Gram: scaling graph computation to the trillions. InSoCC, pages 408–421, 2015. [37] C. Xie, R. Chen, H. Guan, B. Zang, and H. Chen. SYNC or ASYNC: time to fuse
for distributed graph-parallel computation. InPPoPP, pages 194–204, 2015. [38] W. Xie, G. Wang, D. Bindel, A. J. Demers, and J. Gehrke. Fast iterative graph
computation with block updates.PVLDB, 6(14):2014–2025, 2013.
[39] D. Yan, J. Cheng, Y. Lu, and W. Ng. Blogel: A block-centric framework for distributed computation on real-world graphs.PVLDB, 7(14):1981–1992, 2014. [40] D. Yan, Y. Huang, J. Cheng, and H. Wu. Efficient processing of very large graphs
in a small cluster.CoRR, abs/1601.05590, 2016.
[41] F. Yang, Y. Huang, Y. Zhao, J. Li, G. Jiang, and J. Cheng. The best of both worlds: Big data programming with both productivity and performance. InProceedings of the 2017 ACM International Conference on Management of Data, SIGMOD Conference 2017, Chicago, IL, USA, May 14-19, 2017, pages 1619–1622, 2017.
[42] F. Yang, J. Li, and J. Cheng. Husky: Towards a more efficient and expressive distributed computing framework.PVLDB, 9(5):420–431, 2016.
[43] M. Zaharia, M. Chowdhury, M. J. Franklin, S. Shenker, and I. Stoica. Spark: Cluster computing with working sets. In2nd USENIX Workshop on Hot Topics in Cloud Computing, HotCloud’10, Boston, MA, USA, June 22, 2010, 2010.
[44] C. Zhou, J. Gao, B. Sun, and J. X. Yu. Mocgraph: Scalable distributed graph processing using message online computing.PVLDB, 8(4):377–388, 2014. [45] Y. Zhou, L. Liu, K. Lee, and Q. Zhang. Graphtwist: Fast iterative graph