Abstract—A continuous fixed bed study was carried out by
using granular activated carbon produced from olive stone for the removal of phenol from aqueous solution. The effects of initial phenol concentration (40-250 mg/l), feed flow rate (2.2-8.4 ml/min)and activated carbon bed depth(5-20 cm) on the breakthrough characteristics of the adsorption system were determined.The obtained results showed that the adsorption capacity increases with the bed depth and the initial concentration and it decreases at higher flow rate.Three models namely Clark, Thomas, and Yoon - Nelson were employed to predict the breakthrough curves and to determine the characteristic parameters of the column useful for column design.These models fitted well the adsorption data with coefficient of correlation R2>0.9 at different conditions. The activated carbon from olive stone was shown to be suitable adsorbent for adsorption of phenol using fixed bed adsorption.
Index Terms—Phenol, activated carbon, olive stones,
adsorption, breakthrough, fixed bed.
I. INTRODUCTION
Adsorption is known as an effective process for the removal of hazardous pollutants from wastewater. It can be carried out in batch systems with powdered adsorbents or in continuous flow in packed bed column. Fixed bed adsorption is simple to operate, and it can be relatively easily scaled up from a laboratory-scale study. Comparing with batch procedure, fixed bed is more effective for the cycle operation of adsorption/desorption, as it makes the best use of the concentration difference known to be a driving force for adsorption and allows more efficient utilization of the sorbent capacity and results in a better quality of the effluent. Also, the reuse of adsorbents is possible [1].
Fixed bed adsorption was tested for the elimination of several pollutants in effluents resulting from various industries.
Many studies of the adsorption capacities of activated carbon for heavy metals in fixed bed have been reported: arsenic As (V) [2], [3], chromiumCr (VI) [4], fluoride [5], [6], Pb (II) and Cu(II)[7]. Other researchers were interested in the elimination of the dyes which constitute a bigdischarge of the textiles industries. Hamdaoui[8], Banat et al. [9], Ferro [10], Han et al.[11], Song et al.[12] et Nasuha et al. [13] studied the elimination of the methylene blue from an aqueous solution on a fixed bed with various adsorbents and they found very satisfactory results.
The performance of fixed bed is usually described using
Manuscript received February 15, 2013; revised June 3, 2013.
The authors are with the National School of Engineers of Gabes, University of Gabes, Street Omar Ibn El Khattab - 6029 Gabes – Tunisia (e-mail: [email protected]).
the breakthrough curve. However, development of a model to accurately describe the dynamic behavior of adsorption in a fixed bed column is usually difficult. The use of simple models without numerical solutions appears to be more suitable and has practical benefits.Several models have been applied to describe fixed bed adsorption, the most useful are the Thomas model, Clark model and Yoon-Nelson model.
The common adsorbent which has good capacity in removing pollutants is the activated carbon which has been known and used for a long time, initially as adsorbent and later on as catalyst or support for catalyst. In its applications, the activated carbon can be presented in the form offine powder, extruded or granulated particles, or fibers. Activated carboncan be prepared starting from various materials containing a heightpercentage of carbon and a small percentage of inorganic matter such as: peat, lignite, wood, coconut, ect.
The valorization of waste and industrial by-products currently knows a significant progress;some papers had reported several kinds of low cost adsorbents such as grape pomace [14], rice husk [15], residue of oils and lubricating oils [16], dates' stones [17]. Several studies were undertaken in the Mediterranean countries (Italy, Spain, Tunisia), considered as the main producer of the olive in the world, to use the olive residue as being lignocellulosic precursors being able to produce activated carbon of good quality and at a low cost considering the abundance of this vegetable matter. Thus, the production of activated carbonfrom olive stone constitute one of the most interesting research fields in our laboratory, several studies have been made to optimize these processes since 1996.
In this work, we were interested in the study of fixed bed adsorption of phenol on activated carbon from a simple aqueous solution. We used activated carbon manufactured from the olive stone in order to use a very abundant by-product in our region. The phenol is a model molecule of the phenolic pollutants which are strongly toxic products and known by their persistence and their aptitude for the bio-accumulation. In addition, the adsorption of phenol is a standard method used to evaluate the capacity of the activated carbon to eliminate organic molecules from water.
Our objective is to control, through an experimental study, the fixed-bed adsorption on activated carbon, and to develop on this basis a model making it possible to predict the performances and the characteristics of the bed (capacity of adsorption, breakthrough curve, depth of the adsorption zone) according to the operating conditions (initial concentration, flow rates, bed depth). In this purpose, we tested the most widely used models (Thomas, Clark, Yoon and Nelson) with a critical approach.
Modeling of the Dynamics Adsorption of Phenol from an
Aqueous Solution on Activated Carbon Produced from
Olive Stones
II. EXPERIMENTAL A. Adsorbate: Phenol
The choice of phenol results from its frequency in waste water resulting from several industrial activities (petrochemical, pharmaceutical, paper, plastic, agro-alimentary, etc). Because of its strong toxicity, the phenol appears in the category of high-risk product of water pollution.
B. Activated Carbon
Olive stone used for preparation of granular activated carbon was obtained from local factory in Gabes, Tunisia. It was washed with hot distilled water to remove dust like pulp of olives and impurities then dried at ambient temperature.
Thegranular activated carbon (GAC) used in this study were produced in our laboratory by various processes.
1) Activated carbon produced by physical methods (GACA)
In this process, there are two preparation stages: carbonization and activation.Carbonization or pyrolysis is carried out at a temperature of 600°C for 2 hours.Then the second stage, activation which is a controlled endothermic oxidation, takes place at a temperature of 700°C during 8 hours with water vapor as oxidant. Activation has as a role to free the pores and to eliminate the tarry residues blocking the fine structures.After this stage, coal acquires a significant and more accessible internal surface with a very developed porosity.
2) Activated carbon produced by chemical methods (GACB)
In this process, the olive stone is impregnated by phosphoric acid (H3 PO4) during 7 hours. After air drying, the semi-finished product undergoes a carbonization in an inert atmosphere at 410°C.The activated carbon obtained is then washed several times until reaching a pH of the filtrate close to 6. This condition of neutrality makes it possible to be ensured of the elimination of phosphates contained in the product.Then it is placed in a drying oven at 110°C for 24 hours.
3) Activated carbon produced by combined methods (GACC)
This process combines the two ways already mentioned; it implies activation with the phosphoric acid like a chemical agent and the water vapor like a physical agent at the time of the thermal stage.
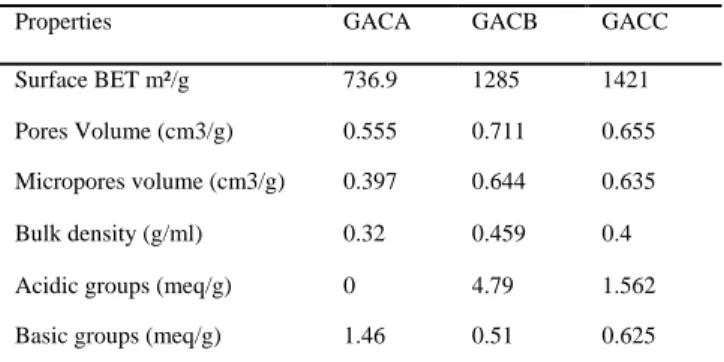
Table I contain the main characteristics of the used activated carbon.
TABLE1:CHARACTERISTICS OF THE ACTIVATED CARBON USED
Properties GACA GACB GACC
Surface BET m²/g 736.9 1285 1421
Pores Volume (cm3/g) 0.555 0.711 0.655
Micropores volume (cm3/g) 0.397 0.644 0.635
Bulk density (g/ml) 0.32 0.459 0.4
Acidic groups (meq/g) 0 4.79 1.562
Basic groups (meq/g) 1.46 0.51 0.625
C. Experimental Set Up 1) Batchadsorption
The batch adsorption was performed using water bath shakers at 40°C and constant agitation speed of 100 rpm.In this study 200 ml of phenol solution was agitated with 0.2g of activated carbon (diameter lower than 100µm) in 250 ml flask. Equilibrium experiments were performed with different initial phenol concentration (20 mg/l - 350 ml/g). The agitated time was 24 hours to reach equilibrium.
Phenol concentration in solution was analyzed using UV spectrophotometer (Shimadzu UV-1700) by monitoring the absorbance changes at the wavelength of maximum absorbance (λ=270 nm).The amount of phenol onto the unit weight of the adsorbent was calculated using the following equations:
0
( )
V C C
q
m
(1)
where V is the solution volume in L, C0 is the initial phenol
concentration in mg/l, C is the phenol concentration at any time t in mg/l, and m is the dry weight of activated carbon in g.
2) Fixed bed adsorption
Fixed bed studies were conducted in a glass column (1 cm in internal diameter, length of 22 cm), packed with a known quantity of activated carbon. The phenol solution at a known concentration was continuously pumped into the column upwards at a constant temperature of 40°C. The desired flow rate was regulated with a variable peristaltic pump. Samples were collected at regular intervals and analyzed for the remaining concentration of phenol in effluent.
The effect of the following parameters were investigated: bed depth (5-20 cm), flow rate (2.2-8.4 ml/min) and initial phenol concentration (40-250 mg/l).
III. RESULTS AND DISCUSSION
A. Equilibrium Study
Equilibrium relationship between the concentration of phenol in the aqueous solution and the concentration of adsorbed phenol at a constant temperature is represented by an adsorption isotherm.
Fig. 1. Isotherms of phenol on activated carbon at 40°C
Fig. 1 was the adsorption isotherm of phenol on the two activated carbons (GACA, GACB) produced from the olive
0 20 40 60 80 100 120
0 100 200 300 400
q
(m
g
/
g
)
Ce (mg/l)
GACA
stone.
Modeling of the equilibrium data has been done using the most widely used models: Langmuir and Freundlich. Fig. 2 show that both of models described well theisotherms.
(a)
(b)
Fig. 2. Linearization of the isotherms by Freundlich (a) and Langmuir (b) models
TABLEII:PARAMETERS OF THE ADSORPTION MODEL FOR PHENOL ADSORPTION ONTO GRANULAR ACTIVATED CARBON
Langmuir Freundlich
CA KL (l/mg) q (mg/g) R² KF n R²
GACA 0.071 111.11 0.994 39.57 6.06 0.948
GACB 0.004 200 0.914 1.906 1.379 0.989
According to the isotherms, we found that in spite of its microporosity and its great specific surface, the granular activated carbon produced chemically(GACB) does not adsorb as muchphenol as the physical one which has a weaker specific surface (700 m²/g). This was explained by the basic character of the surface of the latter which ameliorates the adsorption of phenol since it is known to be a molecule of a slightly acid character. With this intention, we tried to modify the nature of the surface of the chemical activated carbon by carrying out an adequate treatment in order to improve its capacity of phenol adsorption with preserving a significant specific area.
B. Treatment of Granular Activated Carbon Type B
According to the bibliographical sources[18, 19, 20, 21], we found that a simple heat treatment decreases the acid sites in favor of those basics which are favorable for the adsorption of the phenolic compound. Thus we chose this treatment in
the objective to improve the alkalinity of the surface of activated carbon produced chemically (GACB). We used a cylindrical reactor placed horizontally in a muffle furnace maintained at a controlled temperature and with a continuous flow of nitrogen to preserve an inert atmosphere.
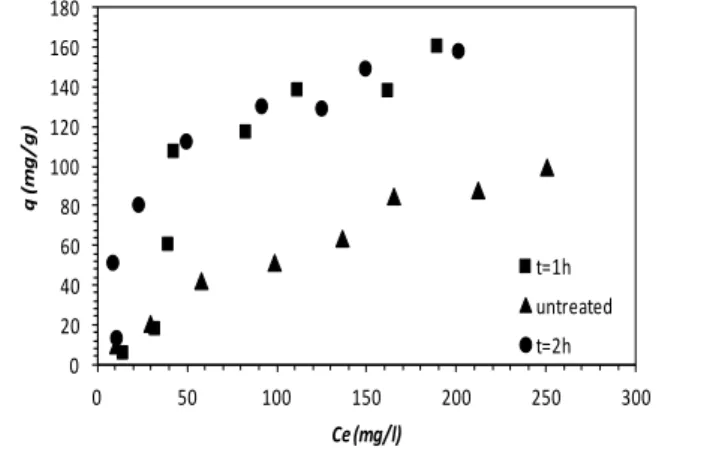
In order to determine the optimum conditions for the treatment we carried out several tests: first, we maintained the heat temperature at 700°C and we varied the duration of the treatment (1h, 2h). The isotherms obtained are illustrated in Fig. 3.
Fig. 3. Effect of the heat time on the adsorption of phenol
The significant effect of the heat treatment on the capacity of phenol’s adsorption by GACB is very clear. For better understandingthis phenomenon, we analyzed the functional groups of the treated one; the results are represented on Fig. 4.
Fig. 4. Effect of the heat time on the functions of the surface
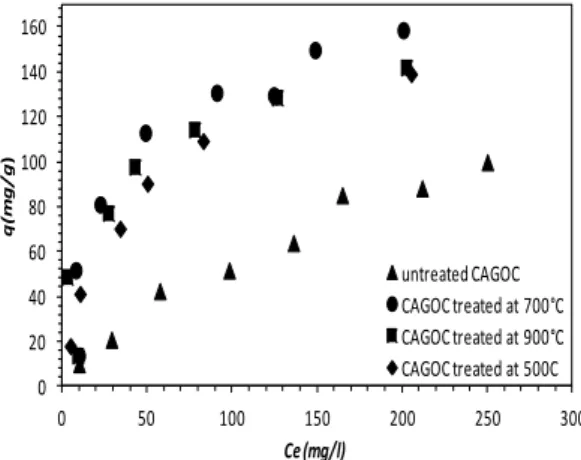
The heat treatment reduced the quantity of the acid functions of coal’s surface. The increase in the duration of the treatment decreases even more these functions. In fact, the acid groups passed from 90 %, for the raw coal; to 69 % for the treaty one along 2 hours. Whereas one hour duration makes it possible to have a coal with 88 % of the acid functions. Thus, we chose this processing time for the rest of the experiments. Second, we fixed the time of the treatment at two hours and we studied the influence of the temperature of treatment which varied between 500°C and 900°C. The isotherms of phenol’s adsorption are represented on Fig. 5.
An increase in the temperature from 500 °C to 700°C inducedan increase in the capacity of AC on all the interval of concentration studied. But a higher temperature (900°C) slightly degraded the performances obtained with 700°C.
3 3,4 3,8 4,2 4,6 5
0 2 4 6 8
ln
(q
e
)
lnCe
GACA
GACB
0 0,5 1 1,5 2 2,5 3 3,5
0 50 100 150 200 250 300 350 400
C
e
/
q
e
Ce (mg/l)
GACA
GACB
0 20 40 60 80 100 120 140 160 180
0 50 100 150 200 250 300
q
(
m
g
/
g
)
Ce (mg/l)
t=1h untreated t=2h
0 1 2 3 4 5 6
untreated
Acid functions (meq/g)
Basic functions (meq/g)
Consequently, we retained 700°C as a temperature of heat treatment for GACB in order to improve the relative quantity of the basic functions of surface.
Fig. 5. Effect of the temperature of the treatment on the phenol’s adsorption
The isotherms of phenol’s adsorption by different AC and the treated one are represented on Fig. 6.
0 20 40 60 80 100 120 140 160 180 200
0 50 100 150 200 250 300 350 400
q
e
(m
g
/
g
)
Ce(mg/l)
AC:A
AC:C
AC:B
AC treated
Fig. 6. Comparison of the isotherms of phenol’s adsorption on various AC.
Fig. 7. Effect of the nature of activated carbon on the phenol’s adsorption (C0=100mg/l, H=20cm, Q=8.4 ml/min)
Thus, the beneficial effect of the heat treatment is quite clear since it makes it possible to increase the adsorbed capacity of GACB betterthan other types of coal.
C. Dynamic Study
In order to study the dynamic behavior of the column of adsorption, we tried first to follow the evolution of the breakthrough according to the operational parameters (bed depth, initial concentration and flow rate) and to see their
influence on the breakthrough time and the adsorbed quantity.
1) Comparison between the activated carbon
The breakthroughs of the different activated carbon were obtained for an initial concentration of 100 mg/l, a flow rate of 8.4 ml/min and a bed depth of 20 cm (Fig. 7).
These results come to confirm what we found in the equilibrium study: the beneficialeffect of the presence of basic groups on the surface is confirmed by the breakthrough of treated activated carbon which presents the greatest value of the adsorbed quantity as well as the highest breakthrough and saturation time. It is seen clearly that the heat treatment appreciably improves adsorption of phenol on the activated carbon.
2) Effect of flow rate
The effect of the flow rate on the adsorption of phenol was investigated by varying the flow rate (from 2.2 to 8.4ml/min) with a constant adsorbent bed depth of 5 cm and the initial phenol concentration of 100 mg/l, as shown by the breakthrough curve in Fig. 8.
Fig. 8. Comparison between the measured and predicted breakthrough curves at various flow rates (C0=100 mg/ l, H= 5cm, GACA)
As indicated in this Fig, at the lowest flow rate of 2.2 ml/min, relatively higher uptake values were observed. At higher flow rates, the breakthrough occurred faster and the breakpoint time and total adsorbed quantity decreased. This behavior can be explained by insufficient residence time of the solute in the column: the residence time decrease with the increase of the flow, that leads to insufficient time for diffusion of the phenol into the pores of activated carbon and limits the number of the available active sites for adsorption, thus reducing the volume of the aqueous solution being treated and the solute left the column before equilibrium occurred.
Fig. 9 shows the variation of the adsorbed quantity for different flow rates.
The increase in the flow causes a reduction of the resistance of film in the external transfer which causes an improvement in the kinetics of adsorption. But we should mention that this increase is favorable only until one value of the flow beyond which this external resistance is not any more limited. A rise in the flow beyond this value, localized in our conditions towards 3.8 ml/min, causes a fall in the adsorbed quantity since the residence time decreases and the phenol molecules do not penetrate deeply in the pores.
0 20 40 60 80 100 120 140 160
0 50 100 150 200 250 300
q
(m
g
/
g
)
Ce (mg/l)
untreated CAGOC CAGOC treated at 700°C CAGOC treated at 900°C CAGOC treated at 500C
0 0,1 0,2 0,3 0,4 0,5 0,6 0,7 0,8 0,9 1
0 200 400 600 800 1000 1200 1400 1600
C
/
C
0
t(min)
GACC
GACA
GACtreated
GACB
0 0,1 0,2 0,3 0,4 0,5 0,6 0,7 0,8 0,9 1
0 200 400 600 800 1000 1200 1400 1600
C
/
C
0
t(mn)
Le=1,782 l/(m²s)
Le=1,167 l/(m²s)
Le=0,806 l/(m²s)
Le=0,467l/(m²s)
Clark
Thomas
Fig. 9. Effect of flow rates on the adsorbed quantity (C0 = 100 mg/l, H=5cm)
3) Effect of bed depth
The adsorption capacities of fixed bed column with bed depths of 5, 10, 15 and 20 cm were tested at a constant flow rate of 8.4 ml/min and influent concentration of 100 mg/l of phenol. The breakthrough curves were illustrated in Fig. 10. Increasing the height of the bedcan be explained by more sites which were supplied for solute so the breakthrough time increased with bed depth.
Fig. 10. Effect of bed depth on breakthrough curves of phenol adsorption (GACB, C0=100mg/l, Q=8.4 ml/min)
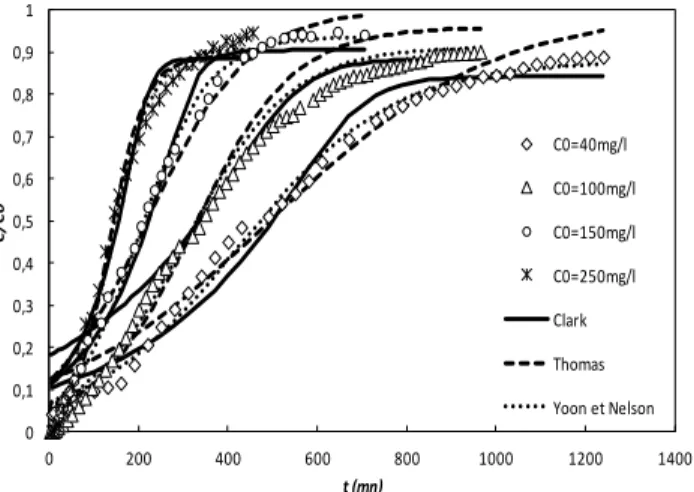
4) Effect of influent concentration
The breakthrough curves obtained at different influent concentration (40-250 mg/l) and constant flow rate of 8.4 ml/min and a bed depth of 15 cm were shown in Fig. 11. The increase in the concentration made the breakthrough curves stifferand decreased the breakthrough from 150min to 48min for the GACA.This was explained by the improvement of the diffusion of phenol in the pores of activated carbon.
The evolution of the quantity adsorbed according to the initial concentration is represented on Fig. 12.
The adsorbed quantity increased with the initial concentration. This is due to an increase in the gradient of concentration which is the driving force of the phenomenon of adsorption and consequently an improvement of the diffusion of the aqueous solution of the liquid phase towards the grains of activated carbon.
D. Breakthrough Curves Modeling
In order to describe the fixed bed column behavior and to scale it up for industrial applications, three models, Thomas,
Clark, and Yoon-Nelson were used to fit the experimental data in the column. The predicted curves were represented by Fig. 8, Fig. 10 and Fig. 11.
Fig. 11. Comparison between the measured and predicted breakthrough curves with different models at various influent concentration (GACA,
Q=8.4 ml/min, H= 15cm)
Fig. 12. Effect of the influent concentration on the adsorbed quantity
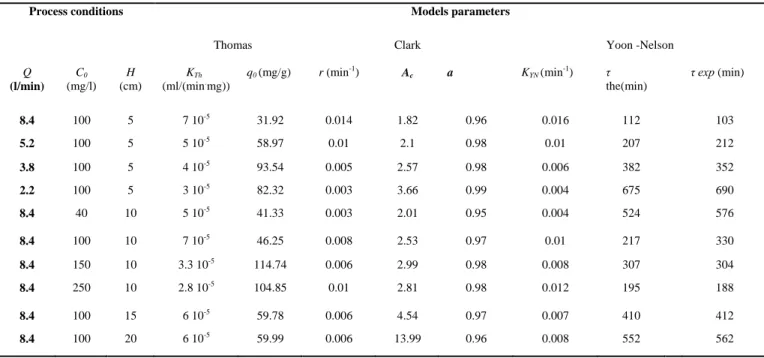
1) Thomas model
Thomas model assumes plug flow behavior in the bed, and uses Langmuir isotherm for equilibrium, and second- order reversible reaction kinetics. This model is suitable for adsorption process where the external and internal diffusion limitations are absent [22] . The Thomas model has the following form [1], [15], [23]:
0 0 0
1
1 exp ( ) /
t
th eff
C
C K q x C V
(2)
were KTh(ml/min mg) is the Thomas rate constant, q0(mg/g) is
the maximum solid-phase concentration of solute, x is the amount of adsorbent in the column (g), Veffis the volume of
effluent (ml), C0 is the influent concentration and Ct is the
effluent concentration at time t(mg/l). The values of KTh and q0can be obtained from a plot of ln((Ci/Ce)-1) against Veffat a
given flow rate and influent concentration. The results were summarized in Table III. The values of KTh and q0 were
influenced by both flow rate and influent concentration of phenol.
As the flow rate increased, the value of q0 decreased and
the Thomas rate constant KThincreased. With the bed volume
and influent concentration increasing, the capacity of the bed
40 45 50 55 60 65 70 75 80 85 90
0 2 4 6 8 10
q
(
m
g
/
g
)
Q(ml/min)
GACB
GACA
0 0,1 0,2 0,3 0,4 0,5 0,6 0,7 0,8 0,9 1
0 200 400 600 800 1000 1200 1400 1600
C
/
C
0
t (min)
H=5cm
H=10cm
H=15cm
H=20cm
Clark
Thomas
Yoon et Nelson
0 0,1 0,2 0,3 0,4 0,5 0,6 0,7 0,8 0,9 1
0 200 400 600 800 1000 1200 1400
C
/
C
0
t (mn)
C0=40mg/l
C0=100mg/l
C0=150mg/l
C0=250mg/l
Clark
Thomas
Yoon et Nelson
0 20 40 60 80 100
0 100 200 300
q
(m
g
/g
)
q0 increased while KTh slightly decreased with C0 and
remained constant with the bed depth.
The difference between the measured and predicted q0 was
negligible. The predicted breakthrough curves were in a good agreement with experimental data for all flow rates and influent concentration in the range of (C/C0) > 0.3 and it
deviated for (C/C0) < 0.3. The result that the Thomas model
did not predict the initial part of the initial part of the breakthrough curve well has also been reported by other researchers [1], [18].
2) Clark model
This model was based on the use of a mass-transfer concept in combination with the Freundlich isotherm [24]. We used the following expression (3) where n is the Freundlich parameter and A and r are the Clark constants. Eq (3) was modified by introducing parameter "a" to take into account that the curve is not perfectly symmetrical at the point C = 0,5C0.
1 1 1
n
O C e o
C a
C A r t
(3)
According to Fig. 8, Fig. 10 and Fig. 11 it was clear that the model of Clark fit very well the totality of the breakthrough curve for the different operating conditions. However, there was a slight deviation for the low values of the flow and the concentration in the case of theGACA. The values of A and r
in the Clark equation were determined by non-linear regression analysis and are shown in Table III. As both flow rates and influent concentration increased, the values of r increased.
3) Yoon-nelson model
Yoon and Nelson developed a model based on the assumption that the rate of decrease in the probability of adsorption of adsorbate molecule is proportional to theprobability of the adsorbate adsorption and the adsorbate breakthrough on the adsorbent [22].
The Yoon-Nelson a linearized model for a single component system is expressed as [1], [25]:
0
ln C K tYN KYN
C C
(4)
where KYN is the rate constant (min-1) and τ is the time
required for 50% adsorbate breakthrough (min).
The values of the rate constant KYN increased with the flow rate and the initial concentration. Table III indicates that the values of τ obtained by the model are close to the experimental results and the predicted curves fitted well the experimental data. Thus, this model provided a good correlation of the effects of bed height and flow rate.
E. Characteristic of the Adsorption Zone
In order to properly design and operate fixed bed adsorption processes, we applied the concept of the Mass Transfer Zone (MTZ) developed by Mickaels for the exchanges of ions and applied by Luchkis for adsorption [26],
[3].
1) Fractional capacity (F)
It determines the elimination efficiency of the granular activated carbon. It may be defined also by the ratio of the real quantity eliminated of solute on the potential capacity of elimination of carbon within the mass transfer zone. The fractional capacity is given by the ratio:
max
ts
o i
tb Z
o s b
c c dt A
F
A c t t
(5)2) The height of MTZ (HZ)
It is the area where practically takes place all the phenomenon of adsorption. It determines the rate of elimination of the adsorbate by the adsorbent and gives indications about the diffusionresistances. The lower resistance to the transfer is, the faster the kinetics of adsorption is, the smaller the depth of the zone of transfer of matter is. The height of MTZ is given by:
b s b
Z
s b
H t t
H
tb F t t
(6) With: Hb: height of the adsorbent bed
ts: saturation time tb: breakthrough time
3) The rate of the movement of the MTZ (UZ)
The rate of the movement of the MTZ is a function of adsorption capacity of the adsorbent; it permits to calculate the rate of bed saturation. It is directly related to the height of mass transfer zone. The small is the bed depth of MTZ, the more quickly is the rate of transfer, and rapid is the saturation bed.
The rate of the movement of the mass transfer zone is given:
b
Z Z
Z
z s b s f
H
H H
U
t t t t t
(7)
With: tz= ts-tb=the time required for the movement of the
MTZ down its own length in the column.
tf= the time required for the formation of the MTZ, it is
given by: tf = (1-F)tz
The percentage of saturation of the column in the breakthrough point is:
1
% b 100
b
H F
saturation H
(8)
All these parameters were calculated: F, HZ and UZfrom
the experimental breakthrough curves for the GACA, for different initial concentrations, for a height of the bed
H=15cm and a flow rate Q = 8.4ml/min.
We fixed a breakthrough concentration Cb = 0.2C0and a
TABLEIII:ADSORPTION DATA FOR FIXED BED OF GACB FOR PHENOL SORPTION AT DIFFERENT PROCESS CONDITIONS
Process conditions Models parameters
Thomas Clark Yoon -Nelson
Q
(l/min)
C0 (mg/l)
H
(cm)
KTh
(ml/(min.mg)) q0(mg/g) r (min
-1) A
c a KYN (min-1) τ the(min)
τ exp (min)
8.4 100 5 7 10-5 31.92 0.014 1.82 0.96 0.016 112 103
5.2 100 5 5 10-5 58.97 0.01 2.1 0.98 0.01 207 212
3.8 100 5 4 10-5 93.54 0.005 2.57 0.98 0.006 382 352
2.2 100 5 3 10-5 82.32 0.003 3.66 0.99 0.004 675 690
8.4 40 10 5 10-5 41.33 0.003 2.01 0.95 0.004 524 576
8.4 100 10 7 10-5 46.25 0.008 2.53 0.97 0.01 217 330
8.4 150 10 3.3 10-5 114.74 0.006 2.99 0.98 0.008 307 304
8.4 250 10 2.8 10-5 104.85 0.01 2.81 0.98 0.012 195 188
8.4 100 15 6 10-5 59.78 0.006 4.54 0.97 0.007 410 412
8.4 100 20 6 10-5 59.99 0.006 13.99 0.96 0.008 552 562
TABLEIV:CHARACTERISTICS OF THE MASS TRANSFER ZONE
tz (h) F(%) HZ (cm) UZ (cm/min) %saturation
40 19.08 87 12.30 0.011 89
100 14.35 90 11.92 0.014 92
150 6.8 85 12.96 0.032 86
250 5.65 91 11.39 0.036 93
IV. CONCLUSION
The adsorption of phenol from aqueous solution by activated carbon produced from olive stone was investigated in a continuous-flow fixed-bed column.
The distribution of phenol between the liquid phase and solid phase was described by the Langmuir and the Freundlich models. It was seen that the sorption equilibrium data can be fitted by both models.
The breakthrough curves have been determined at various flow rates, bed depth and initial concentrations. Several models were applied to analyzeexperimental data and to determine the column characteristics. These models gave good approximations of experimental behavior; the Thomas model were in good agreement with the experimental data only as the relative concentration (C/C0) higher than 0. 3 while the whole breakthrough curve was well predicted by the Clark and the Yoon-Nelson models.
REFERENCES
[1] Z. Aksu and F. Gönen, “Biosorption of phenol by immobilized activated sludge in a continuous packed bed: Prediction of breakthrough curves,” Process Biochemistry, vol. 39, pp. 599-613, 2004.
[2] S. Ayoob, A. K. Gupta, and P. B. Bhakat, “Analysis of breakthrough developments and modeling of fixed bed adsorption system for As(V) removal from water by modified calcined bauxite (MCB),” Separation and Purification Technology, vol. 52, pp. 430-438, 2007.
[3] S. Kundu and A. K. Gupta, “Analysis and modeling of fixed bed column operations on As (V) removal by adsorption onto iron oxide-coated cement (IOCC),” Journal of Colloid and Interface Science, vol. 290, pp. 52-60, 2005.
[4] E. Malkoc and Y. Nuhoglu, “Fixed bed studies for the sorption of chromium (VI) onto tea factorywaste,” Chemical Engineering Science, vol. 61, pp. 4363-4372, 2006.
[5] S. Ayoob and A. K. Gupta, “Sorptive response profile of an adsorbent in the defluoridation of drinking water,” Chemical Engineering Journal, vol. 133, pp. 273-281, 2007.
[6] S. Ghorai and K. K. Pant, “Equilibrium, kinetics and breakthrough studies for adsorption of fluoride on activated alumina,” Separation and Purification Technology, vol. 42, pp. 265-271, 2005.
[7] S. Y. Quek and B. A. Duri, “Application of film-pore diffusion model for the adsorption of metal ions on coir in a fixed-bed column,”
Chemical Engineering and Processing, vol. 46, pp. 477-485, 2007. [8] O. Hamdaoui, “Dynamic sorption of methylene blue by cedar sawdust
and crushed brick in fixed bed columns,” Journal of Hazardous Materials, vol. B138, pp. 293-303, 2006.
[9] F. Banat, S. A. Asheh, R. A. Ahmad, and F. B. Khalid, “Bench-scale and packed bed sorption of methylene blue using treated olive pomace and charcoal,” Bioresource Technology, 2006, pp. 1-9.
[10] F. Ferrero, “Dye removal by low cost adsorbents: Hazelnut shells in comparison with wood sawdust,” Journal of Hazardous Materials, vol. 142, pp. 144-152, 2007.
[11] R. Han, Y. Wang, W. Zou, Y. Wang, and J. Shi, “Comparison of linear and nonlinear analysis in estimating the Thomas model parameters for methylene blue adsorption onto natural zeolite in fixed-bed column,”
Journal of Hazardous Materials, vol. 145, 2007, pp. 331-335. [12] J. Song, W. Zou, Y. Bian, F. Su, and R. Han, “Adsorption
characteristics of methylene blue by peanut husk in batch and column modes,” Desalination, vol. 265, pp. 119-125, 2011.
[13] N. Nasuha and B. H. Hameed, “Adsorption of methylene blue from aqueous solution onto NaOH-modified rejected tea,” Chemical Engineering Journal, vol. 166, pp. 783-786, 2011.
[14] M. L. Soto, A. Moure, H. Domı´nguez, and J. C. Parajo, “Charcoal adsorption of phenolic compounds present in distilled grape pomace,”
Journal of Food Engineering, vol. 84, pp. 156-163, 2008.
[15] R. R. Han, D. Ding, Y. Xu, W. Zou, Y. Wang, Y. Li, and L. Zou, “Use of rice husk for the adsorption of congo red from aqueous solution in column mode,” Bioresource Technology, vol. 99, 2008, pp. 2938-2946. [16] M. Ahmaruzzaman and D. K. Sharma, “Adsorption of phenols from wastewater,” Journal of Colloid and Interface Science, vol. 287, pp. 14-24, 2005.
[17] Y. A. Alhamed, “Adsorption kinetics and performance of packed bed adsorber for phenol removal using activated carbon from dates'stones,”
Journal of Hazardous Materials, vol. 170, pp. 763-770, 2009. [18] I. Salame and T. J. Bandosz, “Role of surface chemistry in adsorption
of phenol on activated carbons,” Journal of Colloid and Interface Science, vol. 264, pp. 307-312, 2003.
[19] A. A. Attia, W. E. Rashwan, and S. A. Khedr, “Capacity of activated carbon in the removal of acid dyes subsequent to its thermal treatment,”
[20] J. M. Gullon, P. M. Lozar, D. C. Amor_os, and A. L. Solano, “Analysis of the microporosity shrinkage upon thermal post-treatment of H3PO4 activated carbons,” Carbon, vol. 42, pp. 1339-1343, 2004.
[21] Z. Merzougui and F. Addoun, “Effect of oxidant treatment of date pit activated carbons application to the treatment of waters,” Desalination, vol. 222, pp. 394-403, 2008.
[22] A. A. Ahmad and B. H. Hameed, “Fixed-bed adsorption of reactive azo dye onto granular activated carbon prepared from waste,” Journal of Hazardous Materials, vol. 175, pp. 298-303, 2010.
[23] H. C. Thomas, Heterogeneous Ion Exchange in a Flowing System, F C. Nachod and W. Wood, vol. 66, no. 1380, pp. 1664-1666, 1944. [24] R. M. Clark, “Evaluating the cost and performance of field-scale
granular activated carbon systems,” Environ. Sci. Technol., vol. 21, pp. 573-580, 1987.
[25] Y. H. Yoon and J. H. Nelson, “Application of gas adsorption kinetics,”
Am. Ind. Hyg. Assoc. J, vol. 45, pp. 509-516, 1984.
[26] A. Namane and A. Hellal, “The dynamic adsorption characteristics of phenol by granular activated carbon,” Journal of Hazardous Materials, vol. B137, 2006, pp. 618-625.