Oviedo University Press 156 Economics and Business Letters
8(3), 156-165, 2019
The persistent and informative distribution of returns on capital
Paulo L. dos Santos1,* • Jangho Yang2
1Department of Economics, New School for Social Research, US 2INET, Oxford Martin School, University of Oxford, UK
Received: 25 January 2019 Revised: 2 April 2019 Accepted: 7 April 2019
Abstract
This Letter draws on series of very large national samples of individual enterprises across fifteen countries to show that cross-sectional distributions of realized returns on capital (RoC) are persistently well described by the same functional form: highly peaked distributions with stretched-exponential tails. The Letter shows how the tails of these distributions can be understood as entropy maxima, suggesting complex patterns of competitive interactions across decentralized, market economies sustain formally persistent statistical equilibria in markets for capital. Such equilibria and their characteristics set the explanatory burden for successful economic accounts of the competitive regulation of profitability. They also point toward interesting new lines of inquiry on the systemic consequences of market competition in those economies and on the price structures it conditions.
Keywords: information theory; distributions of profitability; competition; observational eco-nomics
JEL Classification Codes: D80
1. Introduction
The quest for profitability is the defining organizing principle of decentralized capitalist economies. Enterprises organize all aspects of the production and sale of goods and services so as to maximize the rate of return on assets represented by their profits. Realized measures of profitability reflect the functioning of markets for labor, capital, and for the inputs employed and outputs produced by enterprises. They also inform and reflect the allocation of capital. As a result, distributions of measures of profitability should tell us much about the nature and dynamic evolution of competitive capitalist economies.
A few important contributions have explored aspects of this expectation about those distributions. Some drew on theoretical insights to speculate about their shape.1 Others sought
* Corresponding author. E-mail: [email protected].
Citation: dos Santos, P. L., and Yang, J. (2019) The persistent and informative distribution of returns on capital, Economics and Business Letters, 8(3), 156-165.
DOI: 10.17811/ebl.8.3.2019.156-165
to investigate the empirical purchase of these and other Classical contentions about competition
and the statistical moments of distributions of measures of profitability.2 More recent
contributions opened an innovative, observational line of inquiry, centering on efforts to identify the empirical form taken by distributions of profitability as a first step informing the development of theories of competition in capitalist economies.3 Drawing on data from U.S.
non-financial corporations, those studies found evidence that the annual, cross-sectional distributions of firm-level profitability are consistently well-approximated by the power-exponential forms given by asymmetric Subbotin distributions. This work led to two initial theoretical contributions—broadly grounded on the Classical contention that capital mobility and arbitrage tend to equate realized measures of profitability at an emergent general rate of profit—that account for those distributions as statistical equilibria conditioned either by specific micro-kinetic, drift-diffusion processes,4 or by the “bounded rationality” of “inattentive” or
informationally constrained individual arbitrageurs in capital markets.5
This Letter makes three contributions to these discussions. First, it confirms, broadens, and extends the finding of persistent formal regularities in distributions of measures profitability. Drawing on qualitatively larger (~104-105), nationally representative samples of private and publicly traded companies, it establishes that country-level cross-sectional distributions of realized firm returns on capital (RoC) exhibit sharp peaks at positive modal values, with tails that are strikingly well described by the generalized power-exponential forms given by stretched exponential distributions.
The ubiquity of this distributional form over individual measures of profitability is remarkable given the myriad interdependences market competition, capital mobility, and input-output relationships establish among them.6 Strongly peaked distributions support the Classical
contention that while complex competitive interactions, entrepreneurial innovations, and broader economic change continuously shift realized individual measures of profitability, the movement of capital and broader competitive efforts by arbitrageurs toward higher yielding undertakings enforces a systemic regulation of RoC toward a general, modal rate, 𝑟𝑑.7 The
formal persistence in the distributional tails away from this rate suggest those complex and unobservable processes consistently find the same formal macroscopic expression. This enables the pursuit of a distinctively useful analytical approach to the competitive regulation of realized measures of RoC.8 Instead of offering micro-level theorizations based on strong specifications
of unobservable characteristics of individual agents, markets, and interactions, it is possible to consider the persistent distributional patterns we observe as the emergent, systemic outcome of micro-level competitive dynamics that observationally grounded, macroscopic economic theory can and ought to explain.9
In line with this pursuit, the Letter’s second contribution is to draw on recent work in Mathematical Physics to show how the observed stretched-exponential functional forms can be understood as maximum-entropy distributions.10 As such, those persistent distributional forms can also be understood as statistical equilibrium models of the observable results of complex competitive interactions in markets for goods, capital, and labor. The persistent formal
2 Glick and Erbar (1988); Wells (2007).
3 Alfarano and Milaković (2008); Scharfenaker and Semieniuk (2016). 4 Alfarano, Milaković, et al. (2012).
5 Scharfernaker and Foley (2017).
6 For a discussion of these interdependences see dos Santos and Yang (2018). For formal discussions of the latter two types of interdependence and their possible economic consequences, see Acemoglu et al. (2012) and Bloom (2009).
7 See Smith (1982); Marx (1967), and Shaikh (2016). 8 dos Santos (2017).
characteristics of those equilibria are systemic expressions of the outcomes of competitive
interactions in goods, capital, and labor markets regulating individual measures of RoC. Empirically successful formal theories of that regulation must be mathematically equivalent to those relationships. They should also provide insights into the economic content of those mathematical forms.
Finally, the Letter discusses how these persistent statistical equilibria in capital markets define new macroscopic measures of competitive performance, and can sustain new, observationally grounded Classical conceptualizations of competitive price structures in capitalist economies.
Figure 1. Observed Log-Frequencies and Minimum KL-Divergence Fits for
2. The distributions and stretched-exponential fits
We used data from the Amadeus Company Information Database, Bureau Van Dijk (2017), which currently contains data on more than 20 million individual European enterprises. The database contains samples that are representative of the structure of each economy, including firms of all sizes. Approximately 99 percent of them are private, non-corporate organizations.
We constructed national, annual frequency histograms for each year between 2007 and 2015 for the ratio 𝑟𝑖of companies’ “Earnings Before Interest, and Tax” (EBIT) to their “Total Fixed Assets,” coarse grained into bins with values 𝑟𝑘. We considered economies with more than 10,000 observations per year during the period in question. This resulted in a set of fifteen European economies, including Germany, France, the UK, Italy, and Spain. We included all non-financial companies with an RoC between -200 and 200 percent, a wide, economically relevant range beyond which observed frequencies are at least two orders of magnitude smaller than those over central values of 𝑟𝑖. This resulted in fifteen national series of end-of-year cross
sections. Those cross sections are densely populated, with an average of 112,192 enterprises in each. Italy, Spain, and Sweden have the biggest average annual samples, with 298,032, 262,690, and 154,734 enterprises respectively. Estonia and Slovenia had the smallest, with 20,868 and 19,084 respectively.
The cross sections reveal a strikingly consistent pattern of organization, as shown in the plots for the measures of 𝑟𝑘centered about the mode 𝑟𝑔of each distribution, 𝑥𝑘 = 𝑟𝑘− 𝑟𝑔in Figure 1. For each tail, we estimated the stretched-exponential model in equations (3) and (4) for the distribution of 𝑥𝑘 = |𝑟𝑘− 𝑟𝑑|. Using the minimization of the Kullback-Leibler divergence as a criterion for parameter selection, the models f⃗(𝑑, 𝜆) offer very good fits for the observed histograms ℎ⃗⃗, as measured by the informational indistinguishability index 𝐼𝐷ℎ⃗⃗⃗||f⃗(𝑑,𝜆) between models and observations developed by Soofi et al. (1995) and Soofi and Retzer (2002). 11 As reported in Table 1, the model captures a very high proportion of the informational content of the observed histograms. The all-country-year average 𝐼𝐷ℎ⃗⃗⃗||f⃗(𝑑,𝜆)stands at 99.10 for all left tails and at 99.38 for all right tails. Significantly, the measures are even better for the four large-sample, high-income economies in the dataset, with average values for informational indistinguishability for left and right tails of, respectively, 99.8 and 99.4 for France; 99.5 and 99.7 for Italy; 99.6 and 99.6 for Spain; and 99.8 and 99.7 for Sweden.
The persistent and ubiquitous accuracy of this simple model over very large cross sections across several national economies is remarkable. Its formal significance may be characterized with tools from information theory originally developed in analysis of thermodynamic and communication systems. To motivate their relevance to analysis of economic system, a brief mathematical and methodological discussion is required.
3. Stretched Exponentials as Entropy Maxima
The stretched exponential distributions used above have a very specific informational content. For a quantity taking on positive values, those distributions maximize generalized (1, 𝑑)
entropy functionals across all frequency distributions subject to a constraint on their first moment. As such, their persistently good fit for observed distributions of RoC across several national economies may be taken as more than simply descriptive. It suggests a statistical-equilibrium model of the outcomes of the competitive regulation of individual measures of those returns.
11 Formally, 𝐼𝐷
ℎ⃗⃗⃗||f⃗(𝑑,𝜆)= 1 −exp(−𝐷(ℎ⃗⃗||f⃗(𝑑, 𝜆))), where 𝐷(ℎ⃗⃗||f⃗(𝑑, 𝜆)) is the Kullback-Leibler divergence
Table 1. Average Informational Indistinguishability (ID) between Observed Histograms and Estimated Models, and Average Sample Size.
ID for SE fits Average
Country left tail right
tail
Sample Size
Bulgaria 97.11 97.76 131,684
Czech Republic
99.43 99.74 69,062
Estonia 98.97 99.45 20,868
Finland 97.90 98.81 43,734
France 99.83 99.40 130,585
Germany 98.66 99.70 40,484
Hungary 99.64 99.74 84,520
Italy 99.50 99.72 298,032
Portugal 99.68 99.77 190,523
Romania 99.54 98.92 111,229
Slovakia 99.48 99.74 58,812
Slovenia 98.77 99.35 19,084
Spain 99.61 99.56 262,690
Sweden 99.75 99.69 154,734
United Kingdom
98.60 99.42 66,850
Average 99.10 99.38 112,193
To see this formally, consider a system with 𝑁 ≫ 0 members, each in an individual state defined by a single individual degree of freedom 𝑥𝑛∈ ℝ+. The phase space for this system is
the set of all possible micro-level configurations in which the system may find itself, i.e. all possible permutations of the 𝑁members across all possible values of 𝑥compatible with the regularities governing the system’s behavior. If the domain of possible values for 𝑥is coarse-grained into 𝑘 = 1, … , 𝑠 states, the macroscopic state of the system may be represented by frequency vectors f⃗ = {𝑓1, … , 𝑓𝑠} describing the 𝑓𝑘 ≥ 0 relative occupancies of each value 𝑥𝑘
across all of its members. In general, macroscopic states are supported by a multiplicity of micro-level configurations.
Entropy functionals 𝑆(f⃗) offer informational measures of those multiplicities or phase-space volumes.12 The forward statement of the Principle of Maximum Entropy (PME) consists of the
simple observation that it is most reasonable to expect to observe a system in the state f⃗∗
achieving maximum entropy over its phase space. That distribution is supported by the greatest multiplicity of micro-level configurations. For systems with very large 𝑁 the dominance of maximum-entropy states over all others is overwhelming.13
The generalized (1, 𝑑) entropy for a macroscopic state f⃗ is given by,
𝑆𝑑(⃗⃗⃗) = ∑𝑓 𝑒 Γ (𝑑 + 1, 1 − 𝑙𝑜𝑔 𝑓𝑘 )− 1
𝑠
𝑘=1
(1)
12 The Shannon entropy of f⃗ measures the average number of bits, nats, or dits needed to enumerate or identify
Where Γ(. , . ) is the incomplete gamma function. As established by Hanel and Thurner (2011)
this is the correct entropy functional for a family of systems where strong interactions between members ensure that the dependence of their phase-space volume on the number of members they have, Ω = Ω(N), takes one of two possible specific limiting forms.14 Interdependences between their members reduce the measure of the overall phase space available to them. The parameter 𝑑offers a measure of the informational effect of those interdependences, i.e., how much of an observer’s uncertainty about the exact micro-state of the system they eliminate by making some configurations impossible.15
If the functioning of a system of this type also effectively ensures that only macroscopic states
f⃗ with a given average value of 𝑥, 〈𝑥〉f⃗= 𝑀, are occupied, the PME implies that it is most reasonable to expect to observe the system in states f⃗∗ defined by,
𝑚𝑎𝑥 𝑓
⃗⃗⃗ 𝑆𝑑(𝑓⃗⃗⃗) − 𝜆 (〈𝑥〉𝑓⃗⃗⃗− 𝑀) − 𝜇(‖𝑓⃗⃗⃗‖ − 1) (2)
Where 𝜇, 𝜆 > 0 are the Lagrange multipliers respectively associated with the normalization and first-moment constraint on the distributions f⃗ under consideration.
This problem is solved by an optimal two-parameter distribution f⃗∗(𝑑, 𝜆) with,
𝑓𝑘(𝑑, 𝜆) = exp [1 − (𝜇(𝜆, 𝑑) + 𝜆𝑥𝑘) 1
𝑑], (3)
Where μ(λ, d) is defined by normalization, which at the differential limit requires that,
𝜆 = 𝑒 Γ (𝑑, 𝜇1𝑑) 𝑑 (4)
The stretched-exponential fits reported above may thus be understood as statistical equilibria
for (1, 𝑑) systems whose micro-level functioning is formally equivalent to the presence of a
macroscopic, first-moment constraint on the distributions of 𝑥𝑘. Note finally that the constraint
〈𝑥〉f⃗= 𝑀 allows an equivalent characterization of the statistical-equilibrium model as f⃗(𝑑, 𝑀).
4. Discussion
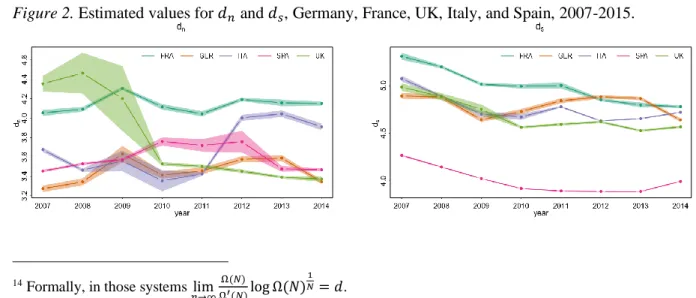
We propose 3 and 4 as a statistical-equilibrium model of the competitive regulation of RoC in each tail of its distribution. The evolution of estimated parameter values are depicted in Figures 2, 3, and 4 for the five largest, advanced economies we observed, with one-standard-deviation ranges for their value obtained with bootstrap sampling of 1000 enterprises.
Figure 2. Estimated values for 𝑑𝑛 and 𝑑𝑠, Germany, France, UK, Italy, and Spain, 2007-2015.
14 Formally, in those systems lim 𝑛→∞
Ω(𝑁)
Ω′(𝑁)log Ω(𝑁) 1 𝑁= 𝑑.
Figure 3. Estimated values for λn and λs, Germany, France, UK, Italy, and Spain, 2007-2015.
Figure 4. Estimated values for Mn and Ms, Germany, France, UK, Italy, and Spain, 2007-2015.
The model’s formal success should motivate further work on the economic content and consequences of such equilibria in decentralized, market economies. Our findings offer a few points that may inform such work.
The modal value of each distribution can be readily interpreted as a measure of the opportunity cost of capital, toward which competition tends to regulate measures of RoC. The parameter M in each tail offers a negative measure of the strength of that regulation. The observed values for M across contemporaneous country-tails suggest the competitive regulation of 𝑥𝑘 is significantly stronger in left tails. This is not surprising given the nature of the economic processes involved. In those tails, stronger capital-market pressures on underperforming enterprises, and greater frequency of death among them, condition a stronger regulation of the distribution toward zero.
The weaker regulation on the right may reflect obstacles rendering the movement of capital toward certain high-yielding undertakings slower or more costly. Monopolistic barriers to entry and difficulties in emulating innovative investment projects and practices may ensure more persistent measures of comparatively high measures of RoC. The values of M observed in the right tails can be taken as a measure of the significance of entrepreneurial or monopolistic “quasi-rents” or temporary atypically high rates of return present in the dynamic, competitive regulation of rates of return toward their typical value.16
Despite these differences, the regulation is well described by the same functional form across distributional tails. The same is true across national economy and time. This ubiquity supports the conclusion that the burden on any theorization of the competitive regulation of measures of RoC is to provide an economic account of the processes yielding this persistent, statistical-equilibrium result. The parameter d helping define these statistical equilibria has a straightforward, if novel, economic interpretation. It offers an informational measure of
competitive interdependences established between enterprises acting in the same sets of input
and output markets and operating under the same broad macroeconomic conditions.
The statistical-equilibrium model also suggests that the competitive regulation of individual measures of RoC is formally equivalent to the presence of a constraint on the first moment of the distribution of 𝑥𝑘 in each tail.17 A successful theory of that regulation needs to offer economic insights into the processes conditioning this result, and into the determinants of its strength, as measured by the values of M.
Finally, the understanding of the distribution of realized measures of profitability as a statistical equilibrium opens the way for a distinctively Classical understanding of competitive price structures.
All traditions in economic analysis agree that prices are most immediately conditioned by the interaction between supply and demand flows for the goods in question. Most of them predicate prices on sets of deterministic market equilibria. Where they generally differ is in their understanding of what ultimately conditions supply and demand for goods, which reflects different appreciations of the most general determinants and content of equilibrium prices. Contemporary microeconomics predicates competitive prices on Walrasian general equilibria.18 The supply and demand behavior defining those equilibria are understood in terms of strongly specified descriptions of the technological constraints facing individual firms and of the subjective preferences of individual consumers over bundles of goods. But production techniques and consumer preferences are continuously shaped and redefined by the competitive efforts of enterprises, posing significant conceptual problems for this parametrization of the competitive process: It predicates prices established by competition on individual characteristics that are themselves evolving as part competitive processes.19
Classical Political Economy takes a different approach. Because profits are most immediately defined by an enterprise’s ability to sell their outputs at prices that exceed their expenditures on labor and on inputs purchased from other enterprises, it is possible to think of prices as part of economy-wide structures of “prices of production”: Prices predicated on wage structures, input-output productive relationships, and on the measures of profitability they define for each enterprise.20 This approach is more general than Walrasian ones because it considers that the mobility of capital and broader competitive efforts regulate the evolution of supply and demand flows, giving rise to prices that equate measures of profitability across all undertakings in the economy. Unfortunately, this containts the implausible assumption of persistent, deterministic capital-market equilibria, creating serious conceptual and empirical difficulties.21
The findings reported here point to the usefulness of a generalized Classical approach that looks to the mobility of capital and of broader competitive efforts as the most general regulating influence on price structures in a capitalist economy. The dynamic evolution of those structures is shaped by a broad range of unobservable and intractable changes affecting an economy, including entrepreneurial efforts to innovate production techniques and to change preferences, market shares, and other conditions in input and output markets. But the observed distributions reported above also reflect the movement of capital and broader competitive efforts to higher yielding undertakings. This competitive movement exerts a general and persistent influence on supply and demand conditions across most markets, shaping the structure of prices. Those structures necessarily reflect the persistent macroscopic regularities in the distributions of profitability. The relationship between competitive price structures, wages, and productive techniques is mediated by the capital market statistical equilibria this Letter identified. The
17 Over time horizons long enough to ensure relaxation to statistical equilibria. 18 See, for instance, Debreu (1959).
19 A problem identified by Hayek (1946). 20 Marx (1992); Sraffa (1960).
ensuing relationships hold independently of whether or not markets for goods are at equilibrium.
This conclusion can usefully inform further observational and theoretical work into the functioning and distributional content of decentralized capitalist economies.
References
Acemoglu, D., Carvalho, V., Ozdaglar, A., and Tahbaz-Salehi, A. (2012) The Network Origins of Aggregate Fluctuations, Econometrica, 80(5), 1977-2016.
Alfarano, S., and Milaković, M. (2008). Does classical competition explain the statistical features of firm growth?, Economics Letters 101(3), 272–274.
Alfarano, S., Milaković, M., Irle, A., and Kauschke, J. (2012). A statistical equilibrium model of competitive firms, Journal of Economic Dynamics and Control 36(1), 136–149.
Anteneodo, C., and Plastino A. R. (1999) Maximum entropy approach to stretched exponential probability distributions, Journal of Physics A: Mathematical and General, 32(1999), 1089– 1097.
Billio, M., Casarin, R., Costola, M., and Pasqualini, A. (2016) An entropy-based early warning indicator for systemic risk, Journal of International Financial Markets, Institutions and Money, 45, 42-59.
Bloom N. (2009) The impact of uncertainty shocks, Econometrica, 77(3), 623-685.
Bottazzi, G., and A. Secchi (2003) Why Are Distributions of Firm Growth Rates Tent-shaped?, Economics Letters, 80, 415–420.
Bottazzi, G., and Secchi, A. (2006) Explaining the Distribution of Firm Growth Rates, The RAND Journal of Economics, 37(2), 235–256.
Bureau Van Dijk (2017). Orbis/Amadeus Company Database (Electronic Database), Moody’s Analytics.
Debreu, G. (1959) Theory of Value. Yale University Press.
dos Santos, P. L. (2017). The Principle of Social Scaling. Complexity, article ID 8358909. dos Santos, P.L., and Yang, J. (2018) Arbitrage, Information, and the Competitive Organization
of Distributions of Profitability, INET Oxford, Working Paper No. 2018-13.
Farjoun, F., and Machover, M. (1983) Laws of Chaos: A Probabilistic Approach to Political Economy, Verso.
Flaschel, P., Franke, R., and Veneziani, R. (2012) The Measurement of Prices of Production: An Alternative Approach, Review of Political Economy 24(3), 417–435.
Gibrat, R. (1931) Les Inégalités Economiques. Sirley.
Glick, M., and Ehrbar, H. (1988) Profit rate equalization in the US and Europe: an econometric investigation, European Journal of Political Economy, 4(1), 179-201.
Hanel, R., and Thurner, S. (2011) When do generalized entropies apply? How phase space volume determines entropy, EPL (Europhysics Letters), 96(5), 50003.
Hayek, F. A. (1946) The Meaning of Competition, in: Individualism and Economic Order, University of Chicago Press.
Jaynes, E. T. (1979) Concentration of Distributions at Entropy Maxima, in: Papers on Probability, Statistics and Statistical Physics (Eds.: R. D. Rosenkrantz, D. Reidel), Dordrecht.
Marshall, A. (1920). Principles of Economics, London: Macmillan.
Marx, K. (1967) Capital, Volume II - The Process of Circulation of Capital (Eds.: F. Engels.), International Publishers, NYC.
Marx, K. (1992) Capital, Volume III - The Process of Capitalist Production as a Whole, Penguin.
Scharfernaker, E., and Foley, D. (2017) Quantal Response Statistical Equilibrium in Economic
Interactions: Theory and Estimation, Entropy 19, 444.
Shaikh, A. (2016) Capitalism–Competition, Conflict, Crises, Oxford University Press. Smith, A. (1982) The Wealth of Nations, Penguin.
Soares, A., Moura, J. N., and Ribeiro, M. B. (2016) Tsallis statistics in the income distribution of Brazil, Chaos, Solitons & Fractals, 88, 158–171.
Soofi, E. S, Ebrahimi, N., and Habibullah, M. (1995) Information Distinguishability with Application to Analysis of Failure Data, Journal of the American Statistical Association 90(430), 657–668.
Soofi, E. S., and Retzer, J. J. (2002), Information indicies: unification and applications, Journal of Econometrics,107, 17–40.
Sraffa, P. (1960) Production of Commodities by Means of Commodities, Cambridge University Press.
Stanley, M. H. R., Amaral, L. A. N., Buldyrev, S. V., Havlin, S., Leschhorn, H., Maass, P., Salinger, M. A., and Stanley, H. E. (1996) Scaling behavior in the growth of companies, Nature, 379, 804– 806.