330
EVOLUTION OF SOIL ATTRIBUTES IN CONSERVATIVE
AGRICULTURE
Nicoleta MĂRIN1
, Mihail DUMITRU1, Traian CIOROIANU1, Carmen SÎRBU1
1
National Research and Development Institute for Soil Science, Agro-Chemistry and Environment – ICPA Bucharest, 61 Mărăști Blvd, District 1, Bucharest, Romania e-mail: [email protected]
Key words: chemical characteristics, conservative agriculture
ABSTRACT
Results are presented obtained in an experiment carried out in conservative agriculture system in which chemical fertilizers assortments were tested in N, NP, NPK, and NPK with potassium humates matrix. Doses of 0; 50; 100; 150; and 200 kg N/ha were applied. The experiment was placed on a Haplic Phaeozem1 at SCDA Teleorman and the test plant was soya. The evolution of soil physical and chemical characteristics was aimed at. Soil samples were collected on the 0-20 cm depth. It was ascertained that soil works in conservative agriculture system didn’t lead to changes in the total cation exchange capacity, exchangeable bases sum, and base saturation degree. The latter had a decreasing tendency, from 88.6-90.6% to 85.8-88.5%, but not statistically ensured. Mobile forms of phosphorus and potassium had very significant increases in the variants treated with NP, NPK matrix fertilizers. Total forms remained constant.
INTRODUCTION
Food production depends, among other numerous factors, on the land and implicitly soil quality. Numerous statistics show that on one hand Earth population is continuously growing, assessing that it will reach 9 billion inhabitants by 2050, and on the other hand productive arable land is continuously decreasing to reach only 0.15 ha/person and 0.10
ha/person in 2150 (Dumitru Elisabeta, 2005).
Agronomists have the responsibility to double both food output in the next 50 years
and the non-food biomass quantity which should grow fast (Miller, 2008).
On any culture start up a works system must be drawn up which must be integrated
to the sustainable agriculture concept (Jităreanu, 2015).
Agriculture systems comprise a natural and anthropic factors complex that
intervene in the agricultural production process (Lixandru, 2003).
Soil works conservative system appeared not from the wish to augment agricultural production but mostly from some practicians and specialists communities concern regarding serious soil and other environment resources degradation, although farmers adopt new technologies if they prove more profitable from the economic point of view and
rarely if they are more environment friendly (Derpsch, 2007).
The conservative agriculture models lead to water conservation in the soil, medium preservation as a whole, higher crops in the long run, higher profit for the farmers, mainly due to the accumulation of larger organic matter quantities in the soil which confers the
system sustainability in time (Marinca et al., 2009).
Conservative agriculture is practiced on approximately 72 million hectares worldwide. Out of these 47.5% are in Latin America, 36.7% in the United States of
America, 12.5% in Australia, and less than 3% in Europe, Asia, and Africa (Benites et al.,
2000).
331
Despite the favorable results obtained by scientific research during a long period in the latter three areas of the World the soil conservative works systems were only adopted on limited areas.
In Romania Canarache (1984) assessed that over 50% of the land covered with agricultural soils was affected by anthropic compaction based on the data obtained in the field and the existing pedological information. The most economical solution to prevent depth compaction is represented by reducing the pressure of the agricultural equipment, decreasing the axle load, increasing the travelling speed, modifying the form and configuration of the equipment that moves on soil. Agricultural equipment design requires particular attention from the technical point of view in order to adapt it to the soil and not
vice versa (Hakansson, 1990; Lal, 1991).
MATERIAL AND METHOD
The experiment comprised 25 variants in three replicates in which six fertilizers types were tested in different matrices: Urea, Nitrocalcar, NP 20:20:0, NPK 15:15:15, liquid fertilizer with potassium humates AH-U, and sulphur coated urea in 50; 100; 100; 150; 200 kg N/ha doses, and a control variant. The fertilizers variants contained different nitrogen forms: amide in Urea and sulphur coated urea, nitrate and ammonium in Nitrocalcar; the NP 20:20:0 and NPK 15:15:15 contain all three forms of nitrogen: nitrate, amide, and ammonium, and the AH-U in NPK matrix contains humic compounds with mineral and organic nitrogen.
The following analyze methods were applied for soil elements contents determination in the laboratory phase:
- total nitrogen (N%): Kjeldahl method, soil digestion with sulphuric acid (H2SO4) at 350°C,
potassium sulphate and copper sulfate catalyst – SR ISO 11261:2000;
- available (mobile) phosphorus: Ègner-Riehm-Domingo method and colorimetric
measurement with molybdenum blue according to Murphy-Riley method (reduction with ascorbic acid);
- available (mobile) potassium: extraction after Ègner-Riehm-Domingo method and
measurement by flame photometry;
- pH determined by potentiometry in aqueous suspension, soil: water ratio 1:2.5 using a
combined glass-calomel electrode (pH units);
- BS – basic cations sum, STAS 7184/12-88 pct. 2.2.2.: by extraction with 0.05 n HCl,
Kappen method (me/100 g soil);
- Ah – hydrolytic acidity, STAS 7184/12-88 pct. 2.4.: equilibrium extraction in 1 n sodium
acetate solution, soil-solution ratio 1:2.5; titration with NaOH in the presence of phenolphthalein of the remaining acidity (me/100 g soil);
- T – total cation exchange capacity, by computation: T = BS + Ah, (me/100 g sol);
- VAh – base saturation degree, by computation:
VAh=
100
T SB
, (%);
The analytical data were statistically computed using variance analysis.
RESULTS AND DISCUSSIONS
332
calcareous or manganese concretions and rare coarse sand or small gravel (Ø = 3-5 mm)
elements. The deposits of West Teleorman County have a 5-12 m thickness and were
reported to the average level of the Upper Pleistocene (𝑞𝑃32) and those from the high
Upper Pleistocene level belong to the Teleorman – Dâmbovnic interfluve (Geologic Map,
1967). The soil is of the baticalcaric type (moderately leached), clayey loam/clayey loam, formed on clayey-loamy, loess deposits, carbonate with clayey-marl, villafranchian deposits, arable settled.
Soil humus content in the moment of the experiment emplacement ranged between 3.0 and 3.6%, and the clay content on the 0-40 cm depth was between 45 and 48%. The
analyze of the fine clay (˂ 0,002 mm) on the profile (Table 1) revealed a 42.7-44.3%
variation down to 105 depth. The clay minerals belong to the smectite group.
Table1.
Profile SCDA Teleorman, conservative agriculture physical attributes
Horizo n
Depth (cm) Coarse
sand (2-0.2mm)
Fine sand (0.2-0.02mm)
Silt 0.02-0.002
mm)
Physical clay (˂ 0.01 mm)
Colloidal clay ˂ 0.002 mm)
Structure class Horizon Sample
Ap 0-20 0-15 0.6 27.2 29.5 54.5 42.7 Medium
clayey loam
Apt 20-31 20-31 0.8 28.9 27.3 56.5 43.0 Medium
clayey loam
Am 31-47 31-47 0.4 29.2 27.4 57.0 43.0 Medium
clayey loam
A/B 47-66 50-65 0.4 25.0 30.9 58.0 43.9 Medium
clayey loam
Bv1 66-84 68-83 0.4 25.2 30.1 58.8 44.3 Medium
clayey loam
Bv2 84-105 90-105 0.4 25.8 30.9 59.5 42.9 Medium
clayey loam
Ck 105-130 110-125 0.5 29.3 29.4 56.2 40.8 Medium
clayey loam
Cca 130-155 135-150 0.2 29.0 30.2 56.1 40.6 Medium
clayey loam
The total cation exchange capacity depends on the soil colloidal complex nature, on the clay and humic acids nature and content. In the soils that have a high clay content and are rich in humus the total cation exchange capacity has values around 50 me/100 g soil
resulted from adding the clay and humus total cation exchange capacities: T = αA+ βH.
The clay (α) and humus (β) specific exchange capacities depend on the minerals groups of which the clay fraction is formed and on the humic acids comprised by the humus, because they have different exchange capacities (Oanea et al., 1977).
The total cation exchange capacity (T, me/100 g sol) initially determined had values ranging from 30.69 to 32.58 me/100 g soil on the whole soil profile, values that belong to the middle class according to ICPA Methodology.
333
applied nitrogen doses ensured plant consumption. Nitrogen export with the yield didn’t diminish the soil nitrogen supply.
The exchangeable bases sum (BS, me/100 g soil) determined initially was great with 27.59-30.63 me/100 g soil values on the whole soil profile. After 2 years conservative agriculture system no significant changes were registered between the experimental variants , the values ranged between 27.30 and 28.70 me/100 g soil. The acidity is generated by a factors complex that lead to soil base depletion which consists of base cations leaching on the soil profile. Exchangeable bases from the clay-humus complex surface are displaced along with the water or by the humic or fulvic acids down the profile.
In the case of clay minerals the acidification determines base cations replacement with H+
ions and the increase of their mobility. The nitrogen fertilizers use which have a physiologically acid reaction also represents a protons generating source. The vegetal debris left on the soil surface determine soil acidification and humic acids forming through the tanning agents they contain (gallic acid and benzoic acid derivatives) (Lăcătușu et al., 2017).
The base saturation degree (V, %) had values of 88.6-90.6% in the Ap, Apt horizons down to 31 cm depth, situated in the eubasic domain. Following laboratory analyses it was ascertained that no statistically ensured changes occurred of the base saturation degree between the experimental variants. Their values ranged between 85.8 and 88.5% so a slightly decreasing tendency, not statistically ensured, was noticed as compared to the initial values. Between the soils base saturation degree and their
saturation in certain bases (Ca2+, Mg2+, K+, Na+) a correlation exists, namely the Ca2+ ion
predominates over the other base cations in all soil types and for all base saturation
degrees. This predominance increases as the base saturation degree increases. The Ca2+
cation is followed by Mg2+, K+ and Na+. The base depletion process take place by
hydrogen ions penetration into the adsorptive complex and the cations equivalent replacement (Oanea et al., 1977).
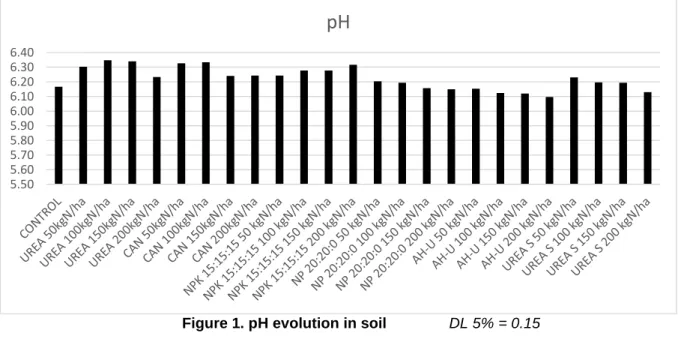
At the experiment start the soil had a slightly acid reaction, the pH ranged between
6.33 and 6.57 in the Ap, Apt, Am horizons down to 47 cm depth; the reaction was neutral (pH 7.12-7.20) in the A/B, Bv1, Bv2 horizons, between 47 and 105 cm depth, and slightly alkaline (pH 8.04-8.19) in the Ck, Cca horizons between 105 and 155 cm depth. After 2 years the pH didn't undergo statistically significant changes.
Figure 1. pH evolution in soil DL 5% = 0.15
5.50 5.60 5.70 5.80 5.90 6.00 6.10 6.20 6.30 6.40
334
The hydrolytic acidity (Ah, me/100 g sol) on the 0-20 cm depth (Figure 2) didn't undergo statistically ensured changes between the experimental variants no matter the fertilizers types or the applied dose.
Figure 2. Soil hydrolytic acidity DL 5% = 0.18
Mobile phosphorus (PAL, mg/kg) supply was low – very low with 8-15 mg/kg values.
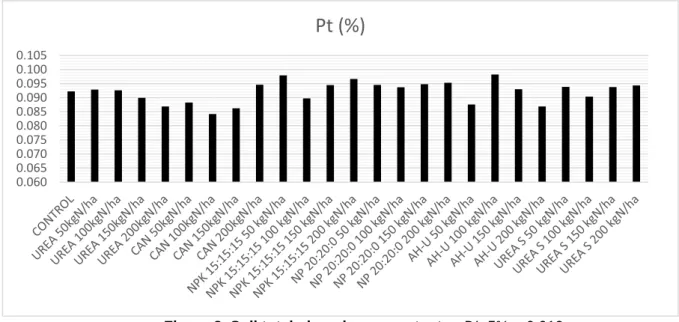
The mobile phosphorus content in the first 20 cm depth after 2 years of fertilization presented significant and very significant increases in the experimental variants following phosphorus fertilizers application. In the variants in which phosphorus wasn't applied this element's concentration in the soil diminished as compared to the control. The determined total phosphorus (Figure 3) didn't register statistically ensured differences. The phosphorus quantity applied was consumed during the vegetation period by the crop and exported with the yield against a very low soil supply of this element. After 2 years of fertilization the applied doses weren't sufficient to satisfy the crop need for this element and to significantly increase the soil total phosphorus supply.
Figure 3. Soil total phosphorus content DL 5% = 0.012
After 2 years experiment the mobile potassium (KAL, mg/kg) content increased very
significantly only in the variants Where NPK matrix fertilizers were applied. At the variants where no potassium fertilizers were applied no decrease of this element was noticed.
2.00 2.50 3.00 3.50 4.00 4.50 5.00
Ah (me/100 g sol)
0.060 0.065 0.070 0.075 0.080 0.085 0.090 0.095 0.100 0.105
335
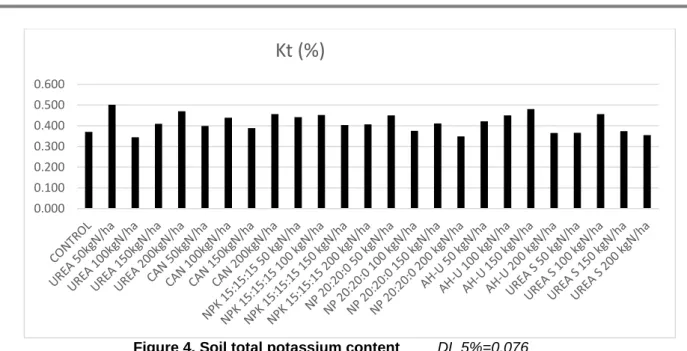
Figure 4. Soil total potassium content DL 5%=0.076
The total potassium content (Figure 4) didn't register statistically ensured changes in any of the experimental variants. The potassium quantity applied with the fertilizers remained in soil as mobile potassium.
The soil total potassium content rangeS between 0.1 and 4.0% K2O and is
distributed in different forms and proportions: 90-95% in not disintegrated primary minerals, 0.5-8% of the ions are bonded without exchange in the interlamellar spaces of the clay minerals with expandable lattice. Potassium ions bonding without exchange
depends on the presence of other cations that compete for the interlamellar positions (NH4+
ions engaged without exchange too). The weak hydration energy and the similar ionic radius of potassium and ammonium ions give them an almost perfect identity with the
interlamellar spaces aperture of the expandable clay minerals. The concentration of K+
ions in an adsorbed by exchange form at the clay-humus colloidal particles surface is 0.5-2.5%. This form along with other adsorbed cations contributes to the colloids electronegative charges compensation and the cation exchange capacity increase. Potassium in soluble form in soil solution available for plant nutrition is to be found in very small quantities: 0.1-0.5% (Rusu et al., 2005).
CONCLUSIONS
The total cation exchange capacity determined in the experimental field after 2
years of conservative agriculture experiment remained constant at values ranging between 31 and 33 me/100 g sol.
It was noticed that no statistically ensured changes occurred in the exchangeable
bases sum (BS, me/100 g soil) between the experimental variants after 2 years of experiments.
Hydrolytic acidity (Ah, me/100 g sol) didn't undergo statistically significant changes
under the influence of different mineral fertilizers types and doses.
Mobile phosphorus content in the first 20 cm presented significant and very
significant increases in the experimental variants after 2 years following phosphorus fertilizers application but the total phosphorus content didn't register statistically significant changes.
Total potassium didn't register changes under the influence of the applied
treatments. At high doses the potassium ensured not only the export with the yield but also the increase of soil mobile potassium content.
0.000 0.100 0.200 0.300 0.400 0.500 0.600
336
REFERENCES
1. Benites J. R., Derpsch R., Des McGarry, 2000, Current Status aegistratnd Future Growth Potential of Conservation Agriculture in the World Context, ISTRO Conference Forth Wotrh, USA: 120-129;
2. Canarache A., Colibaș I., Maria Colibaș, Horobeanu I., Viorica Pătru, Simota H., Trandafirescu T., 1984 ,,Effects of induced compaction by whell traffic on soil physical properties and yield of maize in Romania’’. Soil Tillage Research. No. 4: 199-213;
3. Derpsch R., 2005 b ,,Understanding the process of soil erosion and water infiltration’’.
Published at http:www.rolf-derpsch.com ;
4. Dumitru Elisabeta et al.., 2005: Soil conservative works between tradition and perspective in sustainable agriculture, Estfalia Publishing House, Bucharest (published in Romanian);
5. Florea N., Bălăceanu V., Răuță C., Canarache A., 1987, Methodology for drawing up pedological studies. Part III Ecopedological indicators, Center for teaching material and agricultural propaganda, Bucharest (published in Romanian);
6. Jităreanu G., 2015,Farm Practices Vol. I, Ion Ionescu de la Brad Publishing House Iași
(published in Romanian);
7. Hakansson I., 1990, Soil Compaction control: objectives, possibilities and prospects’. Soil
Technology. Vol. 3:201-239;
8. Geologic Map, 1967, 43 Neajlov, Geology State Committee, Geologic Institute, Bucharest (published in Romanian);
9. Lal R., 1991 ,Tillage and agricultural sustainability’. Soil Tillage Research. No. 20:133-146;
10. Lăcătușu R., Lungu Mihaela, Rizea Nineta, 2017, Soil Global Chemistry. Processes, Determinations, Interpretations, Terra Nostra Publishing House, Iași, ISBN 978-606-623-074-2 (published in Romanian);
11. Lixandru Gh., 2003 – Integrated fertilization systems in agriculture, PIM Publishing House, Iași (published in Romanian);
12. Marinca C., Borza I., Dumitru M., Ţărău D., 2009, Soil and Fertility – Relation with the Banat Agricultural systems. Mirton Publishing House Timişoara (published in Romanian); 13. Miller F. P., 2008, After 10000 years of agriculture, whither agronomy? Agron. J., 100,
Online ISSN: 1435-0645, Print ISSN: 0002-1962;
14. Oanea N., Rogobete Gh., General and Improving Pedology, 1977, Teaching and Educational Publishing House Bucharest (published in Romanian);
15. Rusu M., Mărghitaș Marilena, Mihăiescu Tania, Oroian I., Dumitraș Adelina, 2005,