PRACTICE 11
Maxwell and Rayleigh Densities
Problem. Suppose that we drop a dart on a large table top, which we consider as the -plane, and suppose that the and coordinates of the dart point are independent and have a
normal distribution with parameters and . How is the distance of the point from the
origin distributed?
Solution: This problem arises in physics when it is assumed that a moving particle in
has components of the velocity that are mutually independent and normally distributed and it is
desired to find the density of the speed of the particle. The density in the case is called the Maxwell density.
The density in the case (i.e. the dart board experiment described above) is called
the Rayleigh density. We can simulate this case by picking independently a pair of coordinates
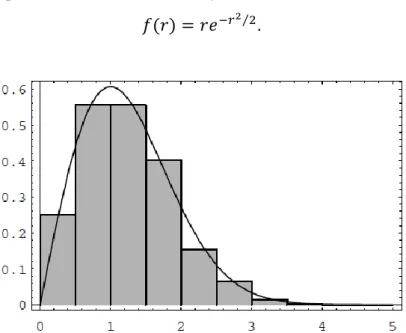
, each from a normal distribution with and on , calculating the
distance of the point from the origin, repeating this process a large number
of times, and then presenting the results in a bar graph. The results are shown in figure. We have also plotted the theoretical density
.
Figure 2: Distribution of dart distances in 1000 drops.
Chi-Squared Density
repeating the experiment a number of times. Now we wish to check how well the theoretical distribution fits the data.
Let be the random variable which represents a theoretical outcome in the model of the
experiment, and let be the distribution function of . We calculate the value of the expression
,
where the sum runs over all possible outcomes , is the number of data points, and denotes
the number of outcomes of type observed in the data. Then for moderate or large values of , the quantity is approximately chi-squared distributed, with degrees of freedom, where
represents the number of possible outcomes. We will illustrate the reasonableness of this
statement in the next example. If the value of is very large, when compared with the appropriate chi-squared density function, then we would tend to reject the hypothesis that the model is an appropriate one for the experiment at hand. We now give an example of this procedure.
Problem. Suppose we are given a single die. We wish to test the hypothesis that the die is fair.
Solution: Thus, our theoretical distribution is the uniform distribution on the integers
between and . So, if we roll the die times, the expected number of data points of each type is . Thus, if denotes the actual number of data points of type , for , then the
expression
is approximately chi-squared distributed with degrees of freedom.
Now suppose that we actually roll the die times and obtain the data in Table 1.
Table 1: Observed data.
Outcome Observed Frequency
2 8
3 7
4 5
5 7
6 18
If we calculate for this data, we obtain the value . The graph of the chi-squared density with degrees of freedom is shown in Figure 3. One sees that values as large as 13.6 are
rarely taken on by if the die is fair, so we would reject the hypothesis that the die is fair. (When using this test, a statistician will reject the hypothesis if the data gives a value of which
is larger than 95% of the values one would expect to obtain if the hypothesis is true.)
In Figure 4, we show the results of rolling a die 60 times, then calculating , and then
repeating this experiment times. We have superimposed the chi-squared density with degrees of freedom; one can see that the data values fit the curve fairly well, which supports the statement that the chi-squared density is the correct one to use.
Given two positive numbers, (the dividend) and (the divisor), (abbreviated as ) can be thought of as the remainder, on division of by .
Problem 1 (Functions of Random Variables). Let be a random variable that takes values from to with equal probability .
(a) Find the PMF of the random variable .
(b) Find the PMF of the random variable .
Solution: (a) Using the formula , we obtain
,
,
,
.
;
.
0 0
1 1
2 2
3 0
4 1
5 2
6 0
7 1
9 0
(b) Similarly, using the formula , we obtain
0 1 0
1 2 1
2 3 2
3 4 1
4 5 0
5 6 5
6 7 5
7 8 5
8 9 5
9 10 5
Problem 2. Let be a random variable that takes values from to with equal probability .
(a) Find the PMF of the random variable . (b) Find expectation of .
Solution: (a) Using the formula , we obtain
5 7
6 8
7 9
8 10
b)
.
Problem 3. Let be the RV with PDF in the interval and . Find expected value of .
Solution: We know that
.
So we have
.
;
.
Problem 4. Let be uniform on . Find the PDF of .
Solution: Note that takes values between and . For every , we have
, .
We then differentiate and obtain
, .
Outside the range , the CDF is constant, with for , and
Problem 5. Let , where is a random variable with known PDF. For any
, we have
,
and therefore, by differentiating and using the chain rule,
, .
Problem 6. A linear function of an exponential random variable. Suppose that is an exponential random variable with PDF
where is a positive parameter. Let . Find . Solution: Then,
Note that if and , then is an exponential random variable with parameter
. In general, however, need not be exponential. For example, if and , then the
range of is the negative real axis.
Problem 7. Let , where is a continuous uniform random variable in the interval . Find .
Solution: Within this interval, is monotonic, and its inverse is . Thus, for
any , we have
Problem 8. If is normally distributed, with mean and variance find the PDF of the random variable .
Solution: We first find the CDF, and then take the derivative to find the PDF. We have
Therefore
Problem 9. Suppose is uniformly distributed between and . Find the PDF of
.
Solution: We have
and thus