WILL INFLUENZA VACCINATION PROTECT OBESE ADULTS?
Scott D. Neidich
A dissertation submitted to the faculty at the University of North Carolina at Chapel Hill in partial fulfillment of the requirements for the degree of Doctor of Philosophy in the
Department of Nutrition in the Gillings School of Global Public Health.
Chapel Hill 2016
Approved By: Melinda A. Beck Jason K. Whitmire
iii ABSTRACT
Scott D. Neidich: Will influenza vaccination protect obese adults? (Under the direction of Melinda A. Beck)
Obesity is a significant public health problem, affecting over one third of the United States, and more than one in ten worldwide. Obesity is associated with a number of comorbidities including cardiovascular disease, diabetes, and importantly, infection. Influenza has been recognized since the 2009 H1N1 influenza pandemic to cause increased severity in obesity, however use of influenza vaccine to reduce influenza-related risk has not been studied specifically in the context of obesity.
In this dissertation, we report that obese adults are at an increased risk for influenza-like-illness despite vaccination. We further report that this deficiency is not due to impairments in response to influenza vaccination, as subjects with confirmed influenza and influenza -like illness produce vaccine-specific antibodies in comparable levels, as assessed by hemaglutination inhibition and microneutralization.
iv
expression of the activation marker CD38 was found to be lower on CD38 expressing B-cells from obese participants.
v
vi
ACKNOWLEDGMENTS
I would like to acknowledge my dissertation committee for their expert guidance and support: Dr. Melinda A. Beck (chair), Dr. Stephen Hursting, Dr. Liza Makowski, Dr. Ilona Jaspers and Dr. Jason Whitmire. Seven years ago, Dr. Beck took me on as an undergraduate researcher and encouraged me to pursue a Ph.D. Without her guidance, support, and mentorship, none of this would have been possible. She has pushed me beyond what I thought were my limits, and shown me the importance of dedication, and value of hard work, to becoming a successful scientist.
I would also like to acknowledge past and current mentors from the Beck Lab for all of their help: Kim Bartholomew for her relentless management of the Human Study, Qing Shi for keeping our lab running, Jennifer Rebeles for her expertise in Flow Cytometry, William Green Savana Ledford and Erik Karlsson for their work on several experiments, Jean Handy and Patricia A. Sheridan for their training, and especially Justin Milner for his guidance and time teaching me countless techniques.
I am grateful for the funding support I received from the NIH ROI AI078090 to Melinda Beck from the P30DK056350 to the University of North Carolina Nutrition Obesity Research Center. I am also grateful to the staff of the Department of Nutrition, including Joanne Lee and Tammy Elliott.
vii
TABLE OF CONTENTS
LIST OF TABLES ……….………...x
LIST OF FIGURES ………..………xi
LIST OF ABBREVIATIONS………xii
CHAPTER I: BACKGROUND AND SPECIFIC AIMS ……….1
A. Obesity and Public Health ………1
A.1: The Burden of Obesity……….1
A.2: Comorbidities of Obesity………..2
A.3: Influenza and Public Health……….………2
B. Influenza Vaccination and the Immune System ………..………...3
B.1: Vaccine Production……….……...4
B.2: Primary and Secondary Response to Vaccination ………5
B.3: Antibody Classes………..……….…..…...8
C. Obesity and the Immune System………..……….………...10
C.1: Adipose tissue as an immunomodulatory endocrine organ……….…….…..…….10
C.2: Innate immune cells: local and systemic effects of obesity…………..…...……….15
C.3: Adaptive Immunity: local and systemic effects of obesity……….…..………..17
D. Viral Infection and Obesity……….………...19
E. Specific Aims……….……….21
viii
Overview .……….23
Introduction.………...23
Materials and Methods ………..……26
Subject Population ..……….………..26
Serum Sample Collection……….………….28
Antibody Quantification ..……….………..28
Statistics ..……….29
Results ……….………..29
Obesity was associated with increased risk of developing laboratory confirmed and influenza like illness…………..…………..………...29
Antibody response to vaccine and circulating influenza viruses did not predict susceptibility to infection………30
Comparison of HAI and Microneutralization titers between laboratory confirmed influenza participants and matched, uninfected controls...………..31
Discussion……….………..……….31
Acknowledgements ………..………...34
Tables and figures ………..…34
CHAPTER III: INFLUENZA VACCINATION OF OBESE ADULTS RESULTS IN LESS ACTIVATED CD38+ B CELLS BUT UNIMPAIRED ANTIBODY RESPONSE TO INFLUENZA VACCINATION ……….…44
Overview .……….44
Introduction ………45
Materials and Methods ………..……47
ix
Blood Samples ……….……….………….….47
ELISA ………..……….………….……….48
Flow Cytometry ……….…….49
Statistics ……….….50
Results ……….………..50
Demographics………..………..……….50
Obesity does not affect the immunoglobulin subtypes induced by vaccination………..………...50
HAI titers unaffected by obesity ………..………..………51
Obesity results in decreased CD38 expression of B cells……….………..…51
Discussion………..…..52
Acknowledgements……….………..………54
Tables and figures ………...55
CHAPTER IV: SYNTHESIS………61
Overview of research findings ………61
Do differences in antibody response to vaccine explain why some vaccinated individuals still get influenza?...61
Does obesity drive different B-cell phenotypic outcomes? ...62
Recommendations for future research………...63
x
LIST OF TABLES
Table 1: 2013-2014 Influenza Season Enrollment………35
Table 2: 2014-2015 Influenza Season Enrollment………36
Table 3: Influenza-Like Illness during 2013-2015 Flu Seasons………..…….………37
Table 4: Seroconversion among influenza-like Illness during 2013-2014 and 2014-2015………..……….………….38
Table 5: Demographics of Case-confirmed Influenza Participants……..……….………..39
Table 6: Participant Demographics……..……….………..55
xi
LIST OF FIGURES
Figure 1: Weight does not impact Influenza HAI antibody generation………..……….40
Figure 2: Confirmed Influenza was not predicted by HAI………..41
Figure 3: Confirmed Influenza was not predicted by Microneutralizing Antibodies………..….. 42
Figure 4: Subjects who later became infected had unimpaired HAI against Influenza Vaccine and Circulating Strains………..………43
Figure 5: Influenza Vaccination induced Antibodies by Class……….……….………..56
Figure 6: Strain Specific HAI Response………..……….57
Figure 7: Representative Gating ……….………58
Figure 8: B-cell subtype population sizes………..………59
xii
LIST OF ABBREVIATIONS Adipo-R Adiponectin Receptor
ANOVA Analysis of Variance ART Anti-Retroviral Therapy
AID Activation-Induced Cytidine Deaminase Protein’ BAFF B-cell Activating Factor
BCR B-Cell Receptor BMI Body Mass Index
CCR7 C-C Chemokine Receptor 7
CD- Cluster of Differentiation (type indicated by number) CI Confidence Interval
CLS Crown-Like Structure
COPD Chronic Obstructive Pulmonary Disorder ELISA Enzyme Linked Immunosorbent Assay FBS Fetal Bovine Serum
Glut-1 Glucose Transporter 1
HA Hemaglutinin
HAI Hemaglutination Inhibition HIV Human Immunodeficiency Virus IgD Immunoglobulin D
IgE Immunoglobulin E
xiii IgM Immunoglobulin M
IL-1 Interleukin-1 IL1β Interleukin-1 Beta IL-2 Interleukin-2 IL-4 Interleukin-4 IL-6 Interleukin-6 IL-10 Interleukin-10
kD kilo Dalton
M1 Macrophage Type 1
M2 Macrophage Type 2
MCP-1 Monocyte Chemoattractant 1 MDCK Madin-Darby Canine Kidney cells MEM Minimal Essential Media
MFI Mean Fluorescent Intensity MHC Major Histocompatibility Complex
NA Neuraminidase
NIH National Institutes of Health NK Natural Killer Cells
OB-R Leptin Receptor
PBS Phosphate Buffered Saline LAIV Live Attenuated Influenza Virus
xiv RDE Receptor Destroying Enzyme TCR T-Cell Receptor
TGFB1 Tissue Growth Factor Beta 1 TGFβ Tissue Growth Factor Beta
TIV Trivalent Influenza Virus (Inactivated)
Th1 T-Helper 1
Th2 T-Helper 2
Th17 T-Helper 17 TLR Toll Like Receptor
TNFα Tumor Necrosis Factor Alpha Tregs T-Regulatory Cells
1
CHAPTER I: BACKGROUND AND SPECIFIC AIMS
A. Obesity and Public Health A.1: The Burden of Obesity
2 A.2: Comorbidities of Obesity
These cost predictions are not for obesity alone, but include a number of co-morbidities. Obesity has been linked to cardiovascular disease for over 60 years6, diabetes for over 85 years7, and dyslipidemia for over 50 years8. Obesity’s contribution to elevated serum lipid levels, and subsequent deposition of lipids onto blood vessel walls causing partial blockages that can cause myocardial infarctions have been long described. More recent research9 has demonstrated that these plaques are made worse by infiltration of immune cells, which trigger inflammation, enlarging and solidifying plaques. This contributes to increased blood pressure, which can induce aneurysm or hemorrhagic stroke elsewhere in the circulatory system. Obesity’s relationship to diabetes is relatively newer, but nonetheless very well established. Through an incompletely understood mechanism, excess nutrient availability causes many cell types (including skeletal muscle cells and adipocytes) to become resistant to insulin, causing a feed-forward mechanism with greater circulating levels of glucose. This elevated glucose level then contributes to inflammation systemically10. Other diseases including musculoskeletal11, gallbladder12, and certain types of cancers13 also have well established causal relationships with obesity, and are likely linked to obesity related inflammation. Those diseases are included in these cost estimates mentioned previously14. Notably absent from these projections, however, is infection: given what we know about influenza infection, these projections may be
underestimates.
A.3: Influenza and Public Health
3
independent risk factor for increase in the risk of severe infection and death from influenza16. And while influenza vaccination is a moderately effective treatment for preventing pneumonia, hospitalization, and death from influenza17, whether or not obesity affects the ability to
respond to influenza vaccination has not been described prior to our investigation in Specific Aim 1. The public health burden of obesity related influenza infections has not been quantified, however previous and current research from our lab suggests that a substantial portion of influenza’s $16.3 billion annual cost may be attributable to obesity18.
B. Influenza Vaccination and the Immune System
There are two main forms of influenza vaccination: Live Attenuated Influenza Vaccine (LAIV), and the Subunit/Conjugate Influenza Vaccine, referred to in this dissertation as either TIV (Trivalent) or QIV (Quadrivalent). In both vaccination strategies, global circulating cases of influenza are observed and modeled in order to anticipate which influenza strains are likely to be predominant during the coming influenza season. Similar strains are then selected as the targets for the annual vaccination, and enter vaccine production. When matched accurately, they will induce generation of antibodies to the circulating strain of influenza, protecting those inoculated from circulating strains. But even when matched poorly, antibodies and cellular immunity generated may also be “cross reactive,” potentially granting some protection against circulating strains despite the poor match.
4 B. 1: Vaccine Production
For LAIV vaccine production, the influenza strains of interest are reasserted with a cold-adapted strain and used to infect eggs. influenza infected eggs are incubated at a lower temperature of 33 degrees Celsius, and reassortment causes the strain to lose its ability to effectively replicate in cells at higher temperatures20. Patients are inoculated with the attenuated viral vaccine intranasally, thereby infecting the epithelia of the upper respiratory tract. While the virus will be able to infect cells in the cooler, upper airway, it is unable to replicate in the warmer cells of the lower airway, thus preventing a severe infection in healthy patients. As LAIV provides a “natural infection” route, it was previously thought to be
particularly effective in children who may not have been exposed to any influenza virus
5 over 50 years of age.
TIV consists of viruses grown at 37 degrees Celsius, however the virus undergoes a subjugation process which cleaves the virus particles into subunits, which are later included in the vaccine. TIV is administered through intramuscular injection, typically into the deltoid muscle. It is worth noting that the influenza virus is only able to replicate if it reaches the respiratory mucosa and is intact, making infection from TIV impossible.
B.2: Primary and Secondary Response to Vaccination
The immune system response to vaccination with TIV or LAIV, and influenza infection functions in much the same way. Resident dendritic cells engulf the pathogen or antigen and digest it within intracellular vesicles. Antigens induce signals on specialized receptors on the surface of these vesicles known as Toll-Like Receptors (TLRs), which induce signaling that alters the behavior of the cells. Macrophages typically respond to antigens by becoming more
inflammatory, seeking out other nearby pathogens more aggressively, and secreting pro-inflammatory cytokines that induce swelling and inflammation at the site of antigen exposure. This inflammation, combined with additional intracellular TLR signaling, causes resident dendritic cells to reprogram from a “seek and destroy” phenotype to an “observe and report” phenotype. The dendritic cells begin to present the acquired antigens on surface embedded in Major Histocompatibility Complex (MHC) proteins, and cease uptake in preparation for
6
antigens. When a T-lymphocyte with an antigen-specific TCR binds to the dendritic cell presented antigen, that T-lymphocyte becomes activated.
Meanwhile, dendritic cells also release antigens into the lymphoid space in the vicinity of B-lymphocytes, and some antigen may flow freely into the lymph node from surrounding tissue. B-lymphocytes are named for the B-cell Receptor (BCR), which has a variable region similar to the TCR. But unlike the TCR, the BCR can recognize free peptides, and does not
require MHC presentation. When a B-lymphocyte’s BCR binds to antigen, the B-lymphocyte will engulf the antigen, partially digest it, and present peptides on its surface MHC class II proteins. While B-lymphocytes residing in inflamed tissues can undergo activation without further stimulation, B-lymphocytes in the lymph nodes will migrate from the B-cell zone to the T-cell zone, and seek an activated cognate T-lymphocyte: One which shares influenza specificity.
7
greater specificity B-cells over the course of a few cell generations. B-cells with lower affinity fail this competition for antigen, and undergo apoptosis.
The T-cells also undergo a similar process in a separate lymph node compartment. By the time the B-cells have completed affinity maturation, a population of cognate T-helper cells are ready to help the high-affinity B-cells. These T-helper cells can provide signals to the B-cells to undergo class switching and additional proliferation, allowing the B-cell population to expand and change their BCR’s to the ones most relevant for the target antigen, which are reviewed section B.3.
A secondary response to antigen occurs when an antigen previously seen by the immune system is introduced, and can happen much more quickly. Secondary exposures to previously experienced antigens may not even require a reaction to occur, as long -lived plasma cells in the bone marrow secrete antibodies for their entire lives. If the pathogen a vaccine is made to protect against manages to get into the body, it may be quickly neutralized by circulating levels of antibody and never begin infecting cells, nor illicit an immune reaction. Should there be enough pathogen to make it through this layer of protection, circulating
8 B.3: Antibody Classes
Depending on the context of the exposure, and the types of antigens present, T-helper cells and intracellular TLRs provide different signals to the newly activated B-cells. These signals trigger the B-cells to make one final modification to the BCR. In its secreted form, the BCR is more commonly referred to as an immunoglobulin or antibody, and there are multiple forms serving multiple purposes. All naïve B-cells express two types of immunoglobulins:
Immunoglobulin-D (IgD) and Immunoglobulin-M (IgM). While naïve B-cells express these immunoglobulins on their surface, they can also be secreted by plasmablasts and plasma cells . While IgD’s function has remained largely a mystery since its’ 1965 discovery, recent evidence suggests that IgD may recruit basophils to induce inflammatory factors including cathelicidin, pentraxin-3, IL-1, IL-2, and BAFF24. These factors upregulate proteins with antimicrobial,
opsonization, and immune-stimulation functions. Meanwhile, IgM’s function is well established to be agglutination, opsonization, and complement fixation. Through some combination of T-cell derived cytokines, toll-like receptor signaling and possibly other unknown mechanics, B-cells recombine the heavy chain elements of their immunoglobulin genes to change from IgM/IgD coexpression to expression of solely IgM, solely IgD, or solely one of the other immunoglobulin subtypes.
9
to greater C3b recruitment and even disruption of any associated bilipid membranes by the complement pathway25. For a bacterium or viral (including influenza) infected cell, this can mean destruction. IgG1 and IgG2 also effectively bind many Fc receptors, while IgG3 has the greatest affinity.
IgG2 inducement is not fully explained by cytokines or any particular class of T-cells in humans, although it does have a complex interaction involving IL-6, wherein the cytokine appears to both26 upregulate and downregulate IgG2. IgG2 is typically seen in context of bacterial antigen and in response to bacterial polysaccharides, whereas IgG4 is found with chronic exposure to the same antigen, alongside Immunoglobulin-E (IgE). In contrast to IgG1 and IgG3, IgG2 and IgG4 have much lower C1q binding affinity and Fc receptor affinity, making them less potent drivers of inflammation. Neither is typically observed in response to influenza vaccination27.
10 C. Obesity and the Immune System
C.1. Adipose tissue as an immunomodulatory endocrine organ.
Obesity is characterized by an excess amount of adipose tissue, which is composed of adipocytes, macrophages, lymphocytes, fibroblasts and endothelial cells. Obesity induces not only increased adipocyte number through enlargement of the tissue, but increased adipocyte size. Immune cell infiltration is also increased, further adding to the adipose-tissue population. In addition to excess adipose tissue, obesity is characterized by an increase in pro-inflammatory immune cells, which secrete cytokines that have been shown to promote insulin resistance29. Although the exact timing and series of events leading to adipose inflammation in obese humans is not known, work in animal models has demonstrated that, as adiposity increases, neutrophils enter the adipose tissue first, followed by macrophages, and then T and B cells30. How much of the inflammation is induced by feeding a high fat diet vs. the actual obesity is unresolved, although likely both contribute to the inflammation. Indeed, mice that become obese on a low-fat chow diet develop similar immune dysfunction compared with obese mice fed a high fat diet31.
In addition to increased cellular infiltrate into the adipose tissue, the phenotype of the immune cells is altered. Macrophages of the M2 type (anti-inflammatory, tissue repairing) become more M1 like (pro-inflammatory). T cells infiltrating the adipose tissue display activation markers32 and T regulatory populations are increased within adipose tissue.
11
known for their roles in regulating food intake, body weight and metabolism, it has recently become clear that they also play a role in T cell regulation.
Leptin is a 16kD adipokine which is secreted directly in proportion to adipocyte mass, thereby increasing adiposity causes an increase in leptin levels. Leptin is a well-known regulator of food intake and energy expenditure, and more recently has received attention for its pro-inflammatory characteristics33. Leptin concentration in the blood for healthy weight adults typically ranges between 10 and 20 ng/mL and can fluctuate within this range based on food intake. In obesity, however, a greater volume of adipose tissue alters serum leptin levels. Average leptin concentration is reported to be over 30 ng/mL in obese humans, and is less responsive to dietary fluctuations34. Obese humans can be considered to be in a constant state of hyperleptinemia. Hyperleptinemia promotes T-effector cell function while inhibiting T regulatory cell function35, whereas absence of leptin prevents T-cell activation. B cells live longer in the presence of leptin, and are more resistant to apoptosis36. Dendritic cells activate T cells more strongly in presence of leptin37, and natural killer (NK) cells experience greater metabolism and are more cytotoxic with increasing leptin38.
12
there is one soluble form (OB-Re). The soluble OB-Re regulates circulating concentrations of leptin and cannot transduce signals into the cell. The short form leptin receptors are mainly involved in leptin transport throughout the body, although some intracellular signaling has been observed from some of these isoforms. The long-chain OB-Rb is the primary receptor involved in signal transduction, thanks to an enlarged intracellular region of the protein which facilitates signal transduction through multiple kinase pathways reviewed in Allison and Myers40 (2014).
OB-Rb is found not only on the cells of the hypothalamus involved in satiety signaling, but in multiple immune cell populations including T and B cells, dendritic cells, monocytes, neutrophils, macrophages, and natural killer cells. Given the wide variety of cell types which are responsive to leptin, it should come as no surprise that the actual effects of leptin signaling on different cell types are varied. For this reason, leptin’s function is pleiotropic.
T regulatory cells (Tregs) express the OB-Rb receptor, and their activation is diminished by leptin signaling41. Dendritic cells, monocytes, B cells and NK cells are all dependent upon leptin signaling for their formation prior to activation, and inflammatory conditions including obesity have been shown to divert production of some of these cell types from the bone
13
Adiponectin behaves in a manner opposite to leptin. It is also secreted by adipocytes, but is released during low insulin, high glucagon states such as fasting. Despite being secreted from adipose tissue like leptin, adiponectin is significantly decreased in obese humans. Healthy weight humans have been shown to have serum concentrations around 12 ng/mL, whereas obese humans in the same study were closer to 4 ng/mL adiponectin in the serum
Adiponectin triggers orexigenic pathways in the hypothalamus, inducing hunger and food seeking behavior. It plays a role in generation of adipocytes, and can alter metabolism by decreasing gluconeogenesis and increasing glucose uptake. This alteration of metabolism may be involved in adiponectin’s ability to reverse insulin resistance in mice46, an effect observed independently of obesity and weight loss.
Just as adiponectin’s function is opposed to leptin’s on satiety, they share an
antagonistic relationship for several immune cell types. Interestingly, when at rest, only 1% of T cells express adiponectin receptor (Adipo-R) on their surface, retaining the receptor in
intracellular vesicles, where it is inactive47.Upon activation, the Adipo-R migrates to the cell surface, allowing the T cells to respond to adiponectin. When adiponectin signaling occurs, T cell activity is dampened by enhancing apoptosis of T effector cells and inhibiting their proliferation48.
14
Given the general effects of adiponectin on immune cell types, we can consider adiponectin to induce “anti-inflammatory” effects on the immune system. It is important to note that, while many of these effects are in opposition to leptin, the balance struck between adiponectin and leptin in the behavior of the immune system is non-symmetrical. Whether this brings the immune system to a “pro-inflammatory” or “anti-inflammatory” state is dependent not only on the relative abundance of these adipokines, but innumerable other factors
including presence of infection, availability of metabolic substrate, and likely many others. Adiponectin and leptin are far from the only adipokines secreted from adipose tissue, although they are the only ones thoroughly established to be regulated by energy balance. Other pro-inflammatory adipokines include Interleukin 6 (IL-6), monocyte chemoattractant 1 (MCP1), chemerin, and Tumor Necrosis Factor α (TNFα).
While each of these is positively associated with obesity, IL6 is very strongly correlated with obesity, and has a very important immunomodulatory role involving Tregs. Tregs are a subset of T cells which play an important anti-inflammatory role. Tregs are induced after a prolonged inflammation period, and the predominant cytokine causing their induction is TGFβ. Following induction, Tregs will dampen inflammatory signals in other CD4+ T cells (Th1, Th2, and Th17), causing the T cell response to be suppressed. Many other immune cells, including B cell s, dendritic cells and macrophages, depend upon T cell signaling for their inflammatory response, placing Tregs at a crucial point in inflammation progression. But in combination with the adipokine IL6, naïve T-cells exposed to TGFβ will undergo differentiation into the
15
replacement of anti-inflammatory Tregs with pro-inflammatory Th17 cells cause acute inflammation, potentially an over-reaction.
The adipokines MCP1 and chemerin play important roles in monocyte recruitment to adipose tissue. MCP152 and chemerin53 are both associated positively with human obesity. Recruitment of monocytes is the first step of adipose-tissue macrophage generation. Adipose tissue macrophages have a tremendous impact on the microenvironment of adipose tissue, which will be discussed in the next section. TNFα is positively associated with obesity54,
although it is secreted from pro-inflammatory M1 macrophages55 resident in the adipose tissue. TNFα stimulates phagocytosis56, as well as M1 polarization and angiogenesis.
From leptin’s pro-inflammatory effects, to the lack of adiponectin to dampen
inflammation, obesity triggers a pro-inflammatory cytokine secretion that results in a persistent low-grade inflammatory state. We speculate that this long term, chronic inflammatory state may have an impact on the response to pathogens, although the mechanisms remain
undetermined. Explanations on the interaction between inflammation and infection outcome include damage from an excessive inflammatory response to a delayed immune response57, which may allow greater pathogen replication in the lung58. Next, we will discuss how the innate immune system is affected by these primary characteristics of obesity.
C.2. Innate immune cells: local and systemic effects of obesity
While the precise origin of obesity’s immunological consequences remains open to
16
polarization to a pro-inflammatory subtype (M1 macrophage) is greatly increased. It remains unclear whether increased presence of M1 macrophages is the cause, or merely an important step in the creation of the low-grade inflammation characteristic of metabolic syndrome.
What is clear is the difference in macrophage phenotype. Lean adipose tissues include a relatively low number of anti-inflammatory M2 macrophages, which metabolize fatty acids and dampen immune activation through secretion of IL10 and TGFβ59. M2 macrophages tend to be dispersed throughout the adipose tissue, and may play a role in wound healing in the event of injury60. However, the obese adipose environment recruits and polarizes M1 macrophages to five times61 the level of M2 in lean adipose tissue. M1 macrophages utilize glucose as their fuel source, and secrete pro-inflammatory molecules including TNFα, IL1β and MCP1. Using glucose as a fuel source allows M1 macrophages to generate greater amounts of energy without
consuming as much oxygen, which may be necessary considering the way M1 macrophages distribute. Unlike M2 macrophages, distribution of M1 macrophages tend to cluster around a specific feature, called a crown like structure (CLS). Whether due to hypoxia, inflammation, or unmanageable hypertrophy, each dying adipocyte recruits dozens of adipose tissue
macrophages which degrade the damaged cell and consume its fat content. The M1
17
This shift in macrophage population is not without consequence. M2 macrophage secretion of IL4 and IL10 promotes insulin sensitivity in adipocytes, whereas TNFα secretion by M1 macrophages acts locally, diminishing insulin sensitivity in adipocytes and other immune cells locally. And in addition to its feed-forward loop role in recruiting monocytes, MCP1 also acts to recruit other immune cells including neutrophils, basophils and mast cells. While these effects are highly pronounced within the adipose tissue, many of the adipokines generated have systemic effects when they leave the adipose tissue. Leptin and adiponectin’s endocrine effects on satiety have already been discussed, but TNFα63 and IL664 also escapes adipose tissue into the bloodstream, contributing to systemic insulin resistance. Macrophages may also be the primary drivers behind other immune cell infiltration into obese adipose tissue:
Neutrophils exhibit elevated activity65 and greater numbers66 in obesity, as do mast cells67. Both neutrophils68 and mast cells69 are also established to drive insulin resistance in murine models.
C.3. Adaptive immunity: local and systemic effects of obesity
18
polarization, greater inflammation, and the pro-inflammatory state. While the mechanism of this transition from anti-inflammatory to pro-inflammatory adipose phenotype in obesity
remains to be determined, the only question of the adaptive immunity’s role is whether it is the cause, or merely a significant contributor.
Both in adipose tissue and systemically, Th1 cells generally act in concert with macrophage and CD8 T cells to combat intracellular bacteria and viruses, whereas Th2 cells promote B cell, eosinophil and mast cell activation, prompting a wide response to a wide array of extracellular pathogens including viral, bacterial and fungal. Th17 cells are pro-inflammatory and aid in clearing pathogens.
However, obesity affects the adaptive immune system beyond its changes to the adipose microenvironment as well, which may be attributable, in part, to nutrient availability. CD4 T cell subtypes Th1, Th2 and Th17 are glycolytic cell types, and increasing glucose
availability causes greater T effector function70. While each of these T cell subtypes causes a distinct inflammatory response, together they all contribute to inflammation. Conversely, Treg cells depend on fatty acid oxidation for their metabolism, and do not increase their anti -inflammatory effects during increased glucose availability71.
Given T cell function dependency upon glucose availability, it should come as no
19
defect results in poor T cell function, increasing susceptibility to infection73. The extent to which this can be attributed to insulin resistance remains unclear.
While relatively little has been characterized about B cell metabolism and obesity, numerous studies have pointed to B cell alterations related to obesity, including greater infiltration of mature, class-switched B-cells into visceral adipose tissue74,75 and increasing B-regulatory cell activity in obese mice has been shown to reduce inflammation74,76. It remains to be determined whether these are secondary effects from T cell alterations, distinct effects brought on by obesity through B cells directly, or a more complicated mechanism yet to be proposed.
D. Viral Infection and Obesity.
20
greater occurrence of atherosclerosis in HIV positive adults, especially obese adults 80. So while obesity may give some protections against HIV progression, it comes at a greater cost.
Obese humans are at a greater risk of hospitalization and death from influenza than healthy weight individuals81, and obesity is linked with greater need for mechanical ventilation and time spent in the Intensive Care Unit16. While there are changes to the muscular
involvement of breathing caused by obesity82, the immunological rather than physical
conditions of obesity are likely to be substantial contributors to complications. Given previous work in our lab, we can speculate on obesity’s effects: Chronic inflammation associated with
obesity may delay the specific immune response, allowing the infection to become more virulent. Alternatively, obesity may cause the immune system to overreact to the infection and induce excessive tissue damage, paradoxically causing secondary infection and severe
pneumonia. Indeed, in obese models of influenza infection, there is greater inflammation in lung tissues of obese mice83, likely attributable to diminished Treg activity and increased systemic levels of CD4+ T cells. Additionally, despite generating a normal response to influenza vaccination initially, higher weight is correlated with a greater decrease in antibody levels 1 year post vaccination in humans84 suggesting that although the antibody response is not acutely affected, obese individuals are unable to maintain the antibody response over time.
21
For this reason, T cells can produce cross-reactive immunity, as, in contrast to external viral proteins, internal influenza viral proteins are similar among strains. However, after priming obese mice with an influenza H3N2 strain and then re-infecting with what would otherwise be a lethal dose of influenza pandemic H1N1, 25% of obese mice die with survivors experiencing 10 to 100 times greater viral titers in lung tissue, as well as greater pro-inflammatory cytokines. In contrast, 100% of lean mice survive85. In humans, T cells isolated from overweight and obese humans show diminished markers of activation, while dendritic cells express reduced MHC -II, the protein responsible for antigen presentation to T-cells86. Despite these deficits in T-cell responses, following vaccination, obese adults produce an antibody response equivalent to healthy weight adults, however the antibody response declines more rapidly84.
Taken in sum, obesity exacerbates dyslipidemia associated with some infections, inhibits memory response to infection, and contributes to a pro-inflammatory environment that licenses greater tissue damage from infection and inflammation.
E. Specific Aims
22
23
CHAPTER II: OBESITY DIMINISHES EFFICACY OF INFLUENZA VACCINE IN ADULTS
Overview
Influenza infection represents a significant public health problem for the general public, and is especially dangerous to individuals with obesity. Although obesity has been identified as an independent risk factor for influenza infection for over 5 years, protection offered by
vaccination has not been specifically examined in this at-risk population. Here, we used a prospective observational study to assess whether influenza vaccination modifies the risk of influenza infection associated with obesity. Using multiple measures to assess influenza vaccine response, we found that obese adults generate antibodies at least as effectively as healthy weight adults. However, despite this equivalent humoral response, when compared with vaccinated healthy weight adults, vaccinated obese adults are approximately twice as likely to develop clinical influenza infection.
Introduction
24
worldwide about 13% of the adult population is obese94. Obesity is defined as excessive adiposity as a result of prolonged positive energy imbalance, and is typically defined by Body Mass Index (BMI) in excess of 30 kg/m2.
Vaccination is the best, and currently only, medically available prevention against influenza virus infection. Neutralizing antibodies against the two surface proteins of the influenza virion, hemagglutinin (HA) and neuraminidase (NA), are generated in response to influenza vaccination and are considered to be protective95. However, year-to-year changes in the HA and NA result in the influenza vaccine being less effective in subsequent years, often requiring a yearly reformulation of the influenza vaccine. This also means that in the event of a pandemic, in which viral reassortment causes major changes in the HA and NA, there may be little protection, contributing to a pandemic spread of the virus96. Generating protection against the most likely viruses to be encountered is facilitated by inclusion of three influenza types: typically one influenza A virus with Hemaglutinin type 1 and Neuraminidase Type 1 (H1N1), a second Influenza A virus with H3N2, and an Influenza B virus are included in the trivalent influenza vaccine. In the past several years, a second B virus has been added to make the quadrivalent vaccine.
25
recipients, including age,106 immune dysfunction99, and other uncharacterized factors limit full protection including unexplored effects of obesity.
Vaccine induced-antibody protection against influenza infection is generally assessed by quantifying homospecific antibody titer against the HA of viral strains included in the vaccine. In addition to homospecific antibodies, limited hetero- and poly-specific antibodies are also observed from prior exposures100 and vaccinations101. Although there is an ongoing research effort to generate a universal cross-protective vaccine in which antibodies would be broadly cross-reactive101, no such vaccine is currently available. For measuring a successful immunization with influenza vaccine, concentrations of antibodies against the HA is conveniently measured. HA inhibition assays (HAI) measure anti-HA antibodies; these levels correlate with protection102. Seroconversion is defined as a 4-fold increase in antibody titer from pre to post vaccination and is considered to be an immunogenic response103. Seroconversion is also considered a measure of potential vaccine efficacy. However, older adults have been shown to develop influenza despite undergoing seroconversion104, demonstrating that antibody titers do not necessarily translate into clinical protection.
26
has been reported to be as low as 78%106. This suggest that the influenza vaccine fails to illicit humoral protection in approximately 1 in 5 healthy recipients106.
We have previously shown that vaccinated obese individuals have an impaired response to influenza vaccination86. Although both healthy weight, overweight (BMI between 25 and 30) and obese adults developed equivalent levels of HAI antibodies to vaccine strains of influenza at 30 days’ post vaccination, obese adults failed to maintain this response. At one-year post vaccination, greater BMI was associated with a steeper decline in antibody titer. Compared with healthy weight individuals, obese individuals were more likely to have a greater than 4-fold drop in antibody titer at one year. However, this analysis did not determine whether vaccinated obese adults were more likely than healthy weight adults to develop influenza. Here, we demonstrate that, compared with healthy weight adults, influenza-vaccinated obese adults had a higher rate of laboratory-confirmed influenza and influenza-like illness. Importantly, as has been reported for elderly adults, the increase in infection in obese adults occurred with antibody titers considered to be protective. These findings question the validity of HAI as a correlate of protection in obese adults, and makes clear that while HAI may still be an effective correlate of protection in some populations, it is certainly not the cause of protection.
Materials and Methods Subject Population
27
adults 18 years of age and older receiving the seasonal trivalent inactivated influenza vaccine (IIV) for the years 2013-2014 and 2014-2015, with exclusion for immunosuppression,
immunomodulatory or immunosuppressive drugs, acute febrile illness, history of
hypersensitivity to any influenza vaccine components, history of Guillain-Barre syndrome, use of theophylline preparations, or warfarin.
Trivalent IIV during the 2013-2014 influenza season was formulated on recommendations for an A/California/7/2009(H1N1)-pandemic-09-like virus, an
A/Victoria/361/2011(H3N2) or A/Texas/361/2011(H3N2)-like virus (which are antigenically similar), and a B/Massachusetts/02/2012-like virus.
Trivalent IIV during the 2014-2015 influenza season was formulated on recommendations for an A/California/7/2009(H1N1)-pandemic-09-like virus, an A/Texas/361/2011(H3N2)-like virus, and a B/Massachusetts/02/2012-like virus.
Participants were contacted weekly for 6 months when influenza activity was first reported in the community. Participants were contacted by phone or email and asked to report any symptoms of fever, cough, runny nose, sore throat, muscle aches, headaches and fatigue to assess for influenza symptoms. Medical records of all study participants, whether they reported influenza-like symptoms or not, were reviewed at the end of each season for medically
28
with influenza A. Influenza-like illness was defined as fever greater than 100 F with a cough and in the absence of any other medical diagnosis. For participants who became infected with clinically diagnosed influenza, we identified vaccinated controls matched for age, sex, race, BMI, that did not report any influenza-like illness during the reporting period.
Serum sample collection
Participants recruited to the study provided a blood sample prior to vaccination and 28-35 days post vaccination. Blood was collected via antecubital puncture. Sera were collected using non-heparinized 10 mL vacutainers, which were allowed to clot at room temperature for 2 hours before being separated by centrifugation at 800 x g for 10 minutes. Sera were then frozen at -80 C for subsequent analysis.
Antibody quantification
Hemaglutination Inhibition assay. A/California/04/2009 (CA/09, pdmH1N1),
A/Texas/50/2012 (H3N2) and A/Switzerland/H3N2 viral stocks were propagated in the allantoic cavity of 10-day-old specific pathogen-free embryonated chicken eggs at 37°C. Allantoic fluid was harvested, cleared by centrifugation, and stored at -80°C as described previously107. The
HAI titer was determined in accordance with World Health Organization guidelines108. Microneutralization assay: Madin-Darby Canine Kidney (MDCK) cells were cultured in Eagle’s
29
Seiken, Cambell California n) and standard microneutralization (MN) were performed according to WHO guidelines108. Luminescent microneutralization (MN) assays were performed as
previously described using a reverse genetics A/California/04/2009 virus containing an NLuc on its polymerase segment109.
Statistics
Results from surveillance and medical records were analyzed using log-binomial and logistical regression in Stata statistical software. Microneutralization and HAI results were analyzed via 2-way analysis of variance (ANOVA) in Graphpad Prism Software. A s tatistical cutoff of p<0.05 was used.
Results
Obesity was associated with increased risk of developing laboratory-confirmed and
influenza-like illness.
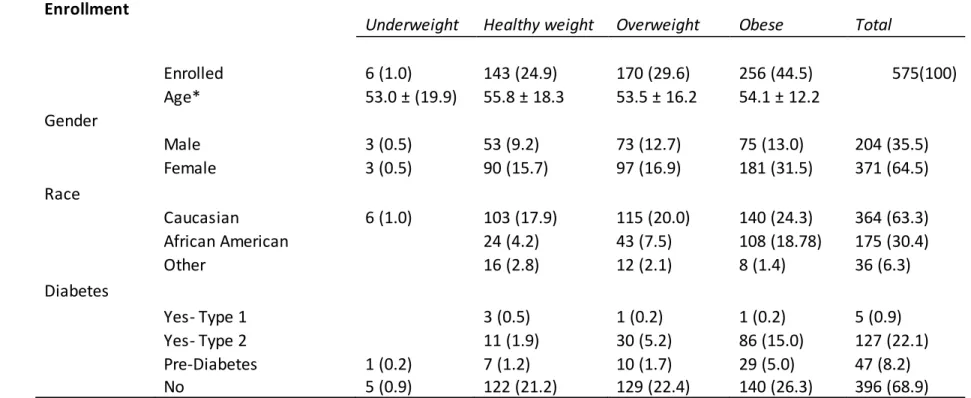
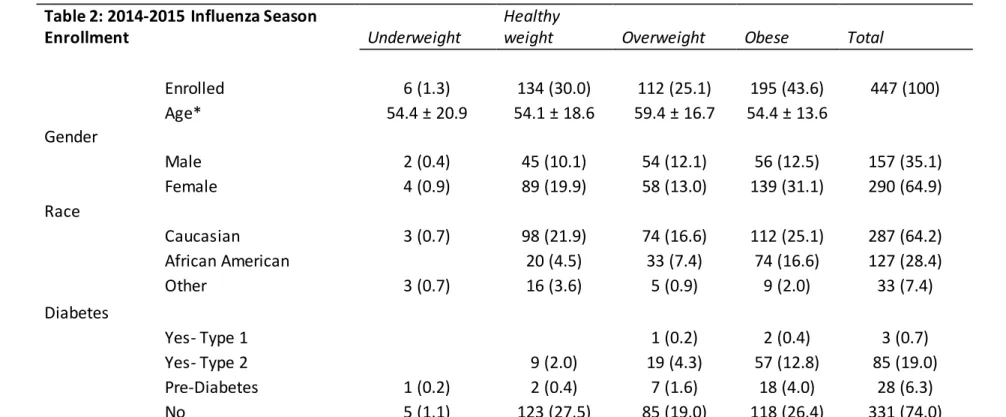
Demographics for all participants in 2013-2014 and 2014-2015 influenza participants can be found in Table 1 and Table 2, and include a total of 1022 vaccinated adults. During 2013-2014, 3 participants had laboratory confirmed influenza, 2 of whom were obes e and 1 was overweight. This increased to 7 during 2014-2015, with 3 obese, 3 overweight, and 1 healthy weight. Although this sample was not large enough to consider greater risk in obese
30
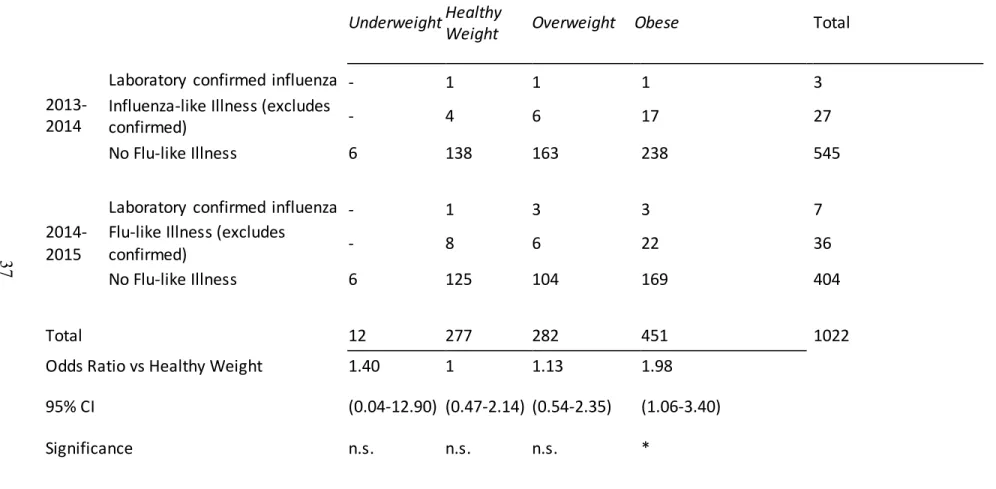
43 cases during 2014-2015. The number of combined laboratory-confirmed influenza and influenza-like illnesses for both years are reported in Table 3 where obese participants had approximately twice the risk for laboratory confirmed or influenza-like illness despite
vaccination (p=0.0310, 95% CI 1.0156-4.0756). Additionally, logistic regression of BMI using influenza season as a covariate found that although there were more cases during the 2014-2015 year than in 2013-2014 (p=0.00731), BMI remained a significant predictor of influenza-like illness (p=0.00438). Consistent with elevated risk for influenza infection in the elderly106, age was correlated with a greater risk (logistic regression p=0.0498), however this effect was not observed in the larger category of influenza-like illness. Using age as a covariate did not eliminate the effect of obesity.
Antibody response to vaccine and circulating influenza viruses did not predict susceptibility to
infection.
For participants with laboratory confirmed or influenza-like illness, there were no
differences in HAI pre and post vaccination titers to vaccine strain H1N1 (Figure 1A and B) or
H3N2 (Figure 1C and D) among healthy weight, overweight, or obese individuals, despite the
increased risk for the obese individuals to develop influenza or influenza-like illness. However, in the 2014-2015 vaccine year, the H3N2 vaccine strain was a poor match for the circulating strains, resulting in a vaccine efficacy reported at only 23%97. Therefore, we measured HAI titers against the circulating strain of influenza, A/Switzerland/9715293/2013 for all participants reporting
laboratory confirmed or influenza-like illness. As we noted for H3N2 vaccine strains, there was
no difference in HAI titers to the circulating strains among healthy weight, overweight or obese
31
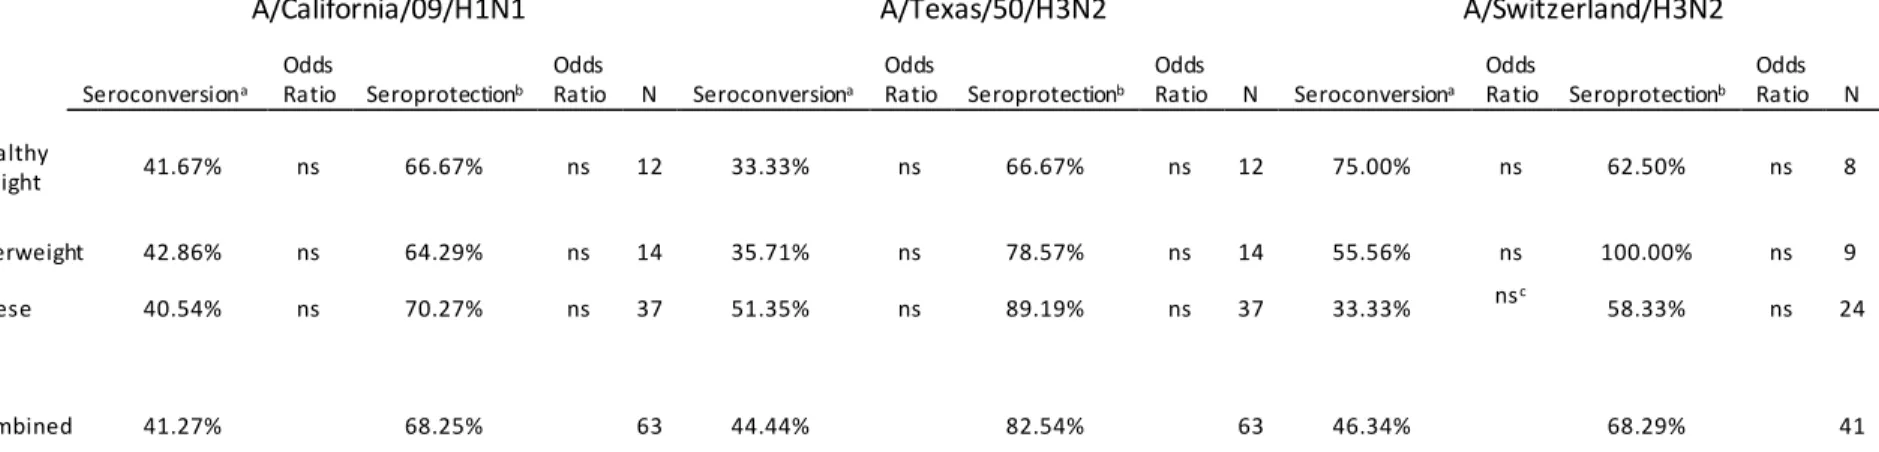
for seroprotection (HAI >40) or seroconversion (>4-fold rise in HAI pre to post). As shown in Table
4, Obesity did not affect odds of seroconversion or seroprotection. For California/H1N1 and H3N2/Texas/50, there were no statistical differences that could explain the higher rate of infection in the obese group.
Comparison of HAI and microneutralization titers between laboratory confirmed influenza
participants and matched, uninfected controls.
Differences in antibody responses between laboratory-confirmed influenza infected participants and controls matched for age, race, sex and BMI who did not develop influenza during the study period were also investigated. Table 5 provides the demographic information for the infected participants and their controls. As seen in Figure 2, HAI titers did not differ between infected adults and non-infected adults. Influenza-specific antibodies were assessed by microneutralization, and again no differences were detected in titers between infected and non-infected adults (Figure 3)
DISCUSSION
32
Of particular interest are findings concerning the 2014-2015 influenza season. That year, a mismatch between the H3N2 circulating strain and World Health Organization recommendations drove an increase in influenza cases97, however our findings showed that participants who were infected with influenza during this season actually had similar levels of protective antibodies as defined by HAI. In fact, 68.3% had a protective level (40 HAI or greater) against the predominant circulating A/Switzerland/H3N2 strain, calling into question HAI antibody’s definition as protective. Although HAI antibodies have been well established as correlates of protection, protective HAI levels generated from vaccination against the predominant strain clearly demonstrate that HAI antibodies are not solely protective in the infected population. The clinically confirmed population in this study was 86% obese or overweight, however more data are necessary to determine if HAI antibodies are poorly correlated with protection solely in non-healthy weight populations.
Obesity has been recognized as an independent risk factor for influenza infection for 5 years, however this is the first study to our knowledge to monitor influenza vaccination and subsequent outcomes in obesity prospectively. Without prospective monitoring, studies looking at predictors of influenza infection and outcome are unable to determine response to influenza vaccine. Although this study would be better informed with unvaccinated controls, for ethical reasons, an unvaccinated group was not included.
33
34 Acknowledgements
Table 1: 2013-2014 Influenza Season Enrollment
Underweight Healthy weight Overweight Obese Total
Enrolled 6 (1.0) 143 (24.9) 170 (29.6) 256 (44.5) 575(100)
Age* 53.0 ± (19.9) 55.8 ± 18.3 53.5 ± 16.2 54.1 ± 12.2
Gender
Male 3 (0.5) 53 (9.2) 73 (12.7) 75 (13.0) 204 (35.5)
Female 3 (0.5) 90 (15.7) 97 (16.9) 181 (31.5) 371 (64.5)
Race
Caucasian 6 (1.0) 103 (17.9) 115 (20.0) 140 (24.3) 364 (63.3)
African American 24 (4.2) 43 (7.5) 108 (18.78) 175 (30.4)
Other 16 (2.8) 12 (2.1) 8 (1.4) 36 (6.3)
Diabetes
Yes- Type 1 3 (0.5) 1 (0.2) 1 (0.2) 5 (0.9)
Yes- Type 2 11 (1.9) 30 (5.2) 86 (15.0) 127 (22.1)
Pre-Diabetes 1 (0.2) 7 (1.2) 10 (1.7) 29 (5.0) 47 (8.2)
No 5 (0.9) 122 (21.2) 129 (22.4) 140 (26.3) 396 (68.9)
Table 1: Demographics for the 2013-2014 seasonal enrollment. *Age is reported as average as average at day of years (standard deviation). All other values are number of participants (percent makeup of total).
Table 2: 2014-2015 Influenza Season
Enrollment Underweight
Healthy
weight Overweight Obese Total
Enrolled 6 (1.3) 134 (30.0) 112 (25.1) 195 (43.6) 447 (100)
Age* 54.4 ± 20.9 54.1 ± 18.6 59.4 ± 16.7 54.4 ± 13.6
Gender
Male 2 (0.4) 45 (10.1) 54 (12.1) 56 (12.5) 157 (35.1)
Female 4 (0.9) 89 (19.9) 58 (13.0) 139 (31.1) 290 (64.9)
Race
Caucasian 3 (0.7) 98 (21.9) 74 (16.6) 112 (25.1) 287 (64.2)
African American 20 (4.5) 33 (7.4) 74 (16.6) 127 (28.4)
Other 3 (0.7) 16 (3.6) 5 (0.9) 9 (2.0) 33 (7.4)
Diabetes
Yes- Type 1 1 (0.2) 2 (0.4) 3 (0.7)
Yes- Type 2 9 (2.0) 19 (4.3) 57 (12.8) 85 (19.0)
Pre-Diabetes 1 (0.2) 2 (0.4) 7 (1.6) 18 (4.0) 28 (6.3)
No 5 (1.1) 123 (27.5) 85 (19.0) 118 (26.4) 331 (74.0)
Ta bl e 2: Demographics for the 2014-2015 seasonal enrollment. *Age is reported as average as average at day of years (standard deviation). All other values are number of participants (percent makeup of total).
Table 3: Influenza-Like Illness during 2013-2015 Flu Seasons
Underweight Healthy
Weight Overweight Obese
Total
2013-2014
Laboratory confirmed influenza - 1 1 1 3
Influenza-like Illness (excludes
confirmed) - 4 6 17 27
No Flu-like Illness 6 138 163 238 545
2014-2015
Laboratory confirmed influenza - 1 3 3 7
Flu-like Illness (excludes
confirmed) - 8 6 22 36
No Flu-like Illness 6 125 104 169 404
Total 12 277 282 451 1022
Odds Ratio vs Healthy Weight 1.40 1 1.13 1.98
95% CI (0.04-12.90) (0.47-2.14) (0.54-2.35) (1.06-3.40)
Significance n.s. n.s. n.s. *
Table 3: Summary of which participants acquired influenza during the subsequent season. Data incorporates participants from both 2013-2014 and 2014-2015. *Obese
vaccinated participants were at a significantly greater risk of Flu-like illness (Odds ratio=2.03, 95% CI 1.02-4.08 p=0.0451). Note: Underweight participants are not included on this table.
Table 4: Seroconversion among influenza-like Illness during 2013-2014 and 2014-2015
A/California/09/H1N1 A/Texas/50/H3N2 A/Switzerland/H3N2
Seroconversiona
Odds
Ratio Seroprotectionb
Odds
Ratio N Seroconversiona
Odds
Ratio Seroprotectionb
Odds
Ratio N Seroconversiona
Odds
Ratio Seroprotectionb
Odds Ratio N
Healthy
Weight 41.67% ns 66.67% ns 12 33.33% ns 66.67% ns 12 75.00% ns 62.50% ns 8
Overweight 42.86% ns 64.29% ns 14 35.71% ns 78.57% ns 14 55.56% ns 100.00% ns 9
Obese 40.54% ns 70.27% ns 37 51.35% ns 89.19% ns 37 33.33% nsc 58.33% ns 24
Combined 41.27% 68.25% 63 44.44% 82.54% 63 46.34% 68.29% 41
Table 4: Seroconversion and Seroprotection rates in participants who presented with Influenza-like illness. Data are shown as percentage of data points. Only participants from 2014-2015 were assessed for A/Switzerland/H3N2. Data from 10 subjects were not analyzed for pH1N1 and a/Texas/50/H3N2, including one eligible for A/Switzerland/H3N2 analysis. a: Seroconversion is defined as 4-fold or greater increase in HAI. b: Seroprotection is defined as HAI>40 at 30 days post vaccination. c: Seroconversion was insignificantly lower in obese subjects compared with healthy weight, p=0.0525.
Table 5:
Demographics of Case-confirmed Influenza Participants
Gender Race Study Year
Age BMI Female Male Caucasian
African American
2013- 2014
2014-2015
Total Participants
Confirmed Flu 64.31 ± 16.71 32.65 ± 6.71 7 3 5 5 3 7 10
Matched Controls 62.42 ± 16.02 33.16 ± 9.07 7 3 5 5 3 7 10
Table 4: Demographics of participants who acquired clinically verified influenza infection and matched controls. Age reported in years ± standard deviation, BMI in kg/m2 ± standard deviation.
Figure 1: Weight does not impact Influenza HAI antibody generation. HAI for all subjects with flu/flu like illness displayed by weight status. HAI shown against vaccine-included strains A/California/H1N1pdm09 (A) and A/Texas/50/H3N2 (B), and major circulating strain A/Switzerland/9715293 (C). Comparison between weight and time post vaccination was assessed by ANOVA, p<0.05 is indicated.
Figure 2: Confirmed Influenza was not predicted by HAI. Hemaglutination Inhibition against A/California/H1N1/pdm09 (A) and A/Texas/50/(H3N2) (B) broken down by influenza outcome. Data shown reflects sera from participants with laboratory-confirmed influenza infection (Yellow, n=10) with matched controls (black, n=10), and influenza-like-illness excluding confirmed influenza (purple, n=54). Statistical values reflect 2-way ANOVA pwith a statistical cutoff of p=0.05.
Pre Vacc
inat ion
30 D ays Post Vac cina tion 5 20 80 320 1280 H A I
A. A/California/H1N1/pdm09
p=0.0042
Control Clinically Confirmed InfluenzaInfluenza-Like Illness excluding clincally confirmed Influenza Pre
Vacc inat
ion
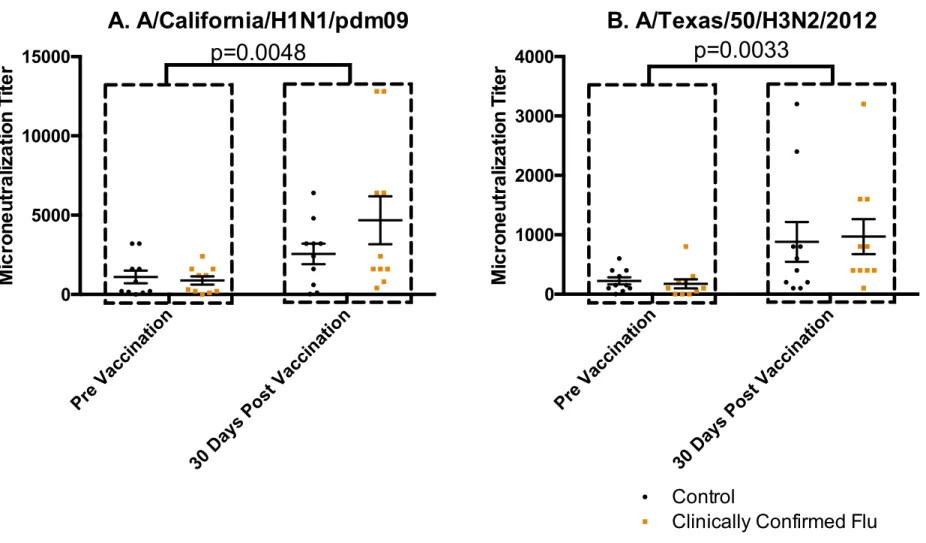
Figure 3: Confirmed Influenza was not predicted by Microneutralizing Antibodies. Microneutralization against A/California/H1N1/pdm09 (A) and A/Texas/50/H3N2 (B). Data shown reflects sera from participants with laboratory clinically influenza infection (red, n=10) with matched controls (black, n=10). Both subject groups responded to vaccination (indicated in A, C), but no differences or interaction between infected and uninfected were observed. Statistical values reflect 2-way ANOVA with a statistical cutoff of p=0.05.
Pre Vacc
inat ion
30 D ays Post Vac cina tion 0 5000 10000 15000 M ic ro n e u tr a liz a tio n T ite r
A. A/California/H1N1/pdm09
p=0.0048
Pre Vacc inat ion30 D ays Post Vac cina tion 0 1000 2000 3000 4000 M ic ro n e u tr a liz a tio n T ite r
B. A/Texas/50/H3N2/2012
p=0.0033
ControlClinically Confirmed Flu
Figure 4: Subjects who later became infected had unimpaired HAI against Influenza Vaccine and Circulating Strains. Subsequent Influenza outcome and Hemaglutination inhibition against vaccine-included viruses A/California/H1N1pdm09 (A), vaccine-included virus A/Texas/50/H3N2(C), and circulating strain A/H3N2/Switzerland. Statistical values reflect 2-way ANOVA with a cutoff of p=0.05.
Pre
Vacc
inat
ion
30 D
ays Post Vac cina tion 5 10 20 40 80 160 320 640 1280 H A I A. pH1N1 Pre Vacc inat ion
30 D
ays Post Vac cina tion 5 10 20 40 80 160 320 640 1280 H A I B. H3N2/Switzerland p=0.0053 Pre Vacc inat ion
30 D
ays Post Vac cina tion 5 10 20 40 80 160 320 640 1280 H A I
C. H3N2/ Texas
2014-2015 Control 2014-2015 Infected p=0.0100
44
CHAPTER III: INFLUENZA VACCINATION OF OBESE ADULTS RESULTS IN LESS ACTIVATED CD38+ B CELLS BUT UNIMPAIRED ANTIBODY RESPONSE TO INFLUENZA VACCINATION.
Overview Background.
Obesity is a known risk factor for increased morbidity and mortality from influenza infection and, following vaccination, the antibody response is not maintained. What is not known is whether or not obesity impacts the B cell response to vaccination.
Objective.
We tested the hypothesis that obesity would alter the B cell response to vaccination. Methods.
Obese and healthy weight Caucasian women were recruited and received the 2015-2016 seasonal influenza inactivated vaccine. Participants provided blood samples pre- and 7 and 30 days’ post-vaccination. Plasma antibody responses to each vaccine strain were
measured by hemaglutination inhibition assay. Vaccine-specific antibody subtypes, IgM, IgG, IgG1, IgG2 and IgG3 were assessed by ELISA. Lastly, B cell phenotypes were identified using flow cytometry.
Results.
HAI antibody titers and vaccine-specific antibody subclass response did not differ between obese and healthy weight subjects. Although B cell phenotypes numbers and
45
was decreased among CD38+ activated B-cells, suggesting incomplete activation of this phenotype.
Conclusions.
Obesity was not shown to impair the influenza-specific antibody response at 30 days post vaccination, nor the generation of antibody secreting cells at 7 days post vaccination. However, decreased expression of the activation marker CD38, may suggest an impairment in the ability of B cells to achieve full activation in obese adults.
Introduction
Obesity is a growing public concern, affecting 13% of the population worldwide113 and 34.9% of United States3 in 2014. Between 2011 and 2012, 8.1% of infants and toddlers under 2 years of age were found to fit age specific definitions for obesity, compared with 16.9% of children between 2 and 18 years of age and 34.9% of adults2. By most estimates, obesity and its co-morbidities such as cardiovascular disease, diabetes and dyslipidemia are now a major burden on the US Healthcare systems, accounting for 4-7% of US Healthcare expenditure in 20034, and is estimated to quadruple by 20305. In addition to these well-known co-morbidities of obesity, increased susceptibility to infection among obese is also a growing concern.
Compared with healthy weight individuals, obese humans are at a greater risk for
46
addition, following influenza vaccination, obese adults generate levels of influenza -specific antibodies equivalent to healthy weight individuals at 30 days post vaccination. However, increasing BMI is correlated with a greater decrease in antibody levels 1-year post vaccination, suggesting that although the B-cells from obese individuals respond appropriately initially, they fail to generate or maintain adequate humoral memory84. The drivers of this B-cell dysfunction are not currently known, but one possibility is impairments in initial B-cell generation, which is the focus of the current investigation. Humoral response to antigen exposure consists of three main cell types derived from naïve B-cells: Plasmacells, which can be short or long lived, memory B-cells which can respond to future antigen exposures, and plasmablasts which are responsible for generating plasma and memory cells. Plasmablasts and plasma cells are
47
been shown to be elevated in HIV infected adults following influenza vaccination117, allowing us to consider it a possible marker of immune dysfunction in obesity.
Materials and Methods Patient Recruitment
Participants were recruited as a part of a prospective observational study carried out at the University of North Carolina at Chapel Hill Family Medicine Center, an academic outpatient primary care facility in Chapel Hill, North Carolina. Original recruitment criteria for the general study included adults 18 years of age and older receiving seasonal Inactivated Influenza Vaccine (S-IIV), with exclusion for immunosuppression, immunomodulatory or immunosuppressive drugs, acute febrile illness, history of hypersensitivity to any influenza vaccine components, history of Guillen-Barre syndrome, use of theophylline preparations, or warfarin. Patients recruited to the study provided a blood sample pre vaccination and 28-35 days post
vaccination. The vaccines administered consisted of a A/California/7/2009(H1N1)pdm09-like virus, an A/Switzerland/9715293/2013(H3N2)-like virus, and a B/Phuket/3073/2013-like virus. During the 2015-2016 recruitment, 45 previous participants who were Caucasian, female, between the ages of 35 and 66, and had a previous weight history of obese or healthy weight were asked to provide an additional sample 7 days post vaccination. Forty-four subjects completed the study, with one withdrawing due to a scheduling conflict.
Blood Samples
-48
Histopaque gradient and frozen in 10%DMSO/90% Fetal Bovine Serum at -80° C and transferred to liquid nitrogen within 24 hours. Plasma was gathered during following initial centrifugation of Histopaque separation and immediately stored at -80° C until subsequent analysis.
Hemaglutination Inhibition Assay (HAI). In order to assess antibody response to specific influenza strains included in the vaccine, HAI was performed in accordance with World Health Organization guidelines108. Briefly: Human plasma samples were thawed and incubated with Receptor Destroying Enzyme (Denka Seiken, Cambell California) for 18-20 hours at 37C, followed by heat inactivation at 56C for 1 hour. Plasma were diluted to 1:10 using sterile physiological saline, and used as the start of a serial dilution on a 96-well V-bottom plate. Following a 1:2 serial dilution, 4 HAU of virus (either Cal/09/H1N1, Switzerland/H3N2, or B/Phuket grown in embryonated chicken eggs) in 25 µL of Phosphate Buffered Solution was added to each well. After 15 minutes at room temperature, 50 µL of a 0.5% turkey red blood cell solution was added to each well, and hemaglutination inhibition was blindly assessed via visual inspection. Reciprocal of HAI is reported.
ELISA
In order to assess antibody class response, an ELISA for influenza vaccine-specific immunoglobulins for IgG1, IgG2, IgG3, total IgG, and IgM was performed. Briefly: IgG and IgM antibodies were quantified by enzyme-linked immunosorbent assay using the 2015–2016 seasonal TIV as antigen. Vaccine was diluted and adsorbed to micro titration plates in a
49
chromogenic substrate. Color intensity was measured by absorbance at 450 nm. Internal control plasma were included in each run. Pre- and post-vaccination plasma from each
participant were tested in the same run. The intra-assay coefficient of variation using this assay is 4%.
Flow Cytometry
Frozen PBMCs from a representative subgroup were thawed in a 37 C water bath and reconstituted in RPMI complete with 10% Fetal Bovine Serum and Penicillin/Streptomycin (Thermo Fisher, Watham Massachusetts). Cells were centrifuged at 350 x g and washed three times and 1 x 06 cells were incubated in a 96 well plate at 37 C, 5% CO2 for 2 hours. Cells were spun at 350 x g, and treated with Human Fc Block (eBioscience, San Diego California) before being stained for viability (Life Technologies, Carlsbad California). Cells were subsequently stained for extracellular proteins.
Protein targets and fluorophores used included CD19-PE-Alexafluor 610 (Life
Technologies), CD10-PE (BD Biosciences, San Jose California), IgG-APC (BD Biosciences), IgD-FITC (BD Biosciences), CD138-Brilliant Violet 605 (Biolegend, San Diego California), CD38-Pacific Blue (Exbio, Vestec Czech Republic), and CD27-Brilliant Violet 711 (BD Biosciences).
50 Statistics
Data were analyzed using Graphpad Prism. Effects of obesity and vaccination were assessed by two-way ANOVA using a statistical cutoff of p<0.05. If an effect was observed, a Student’s T-test was employed to determine which timepoints the effect of obesity was present.
Results
Demographics.
Subject demographics are included in Table 6. Because subjects were selected based on BMI status from 2014 medical records, several subjects who were initially classified as healthy weight or obese had weight change that would reclassify them as overweight (4 formerly healthy weight, BMI at vaccination=25.3, 25.4, 26.4, 26.4 and two formerly obese, BMI at vaccination=28.0, 29.0). No subject from the healthy weight group achieved a higher weight than the obese group however, and so the original classifications were used in this analysis. Participants classified as Obese had a greater BMI than subjects class ified as Healthy Weight (Table 6, BMI p<0.0001).
Obesity did not affect the immunoglobulin subtypes induced by vaccination.
ELISA analysis shows an increase in both healthy weight and obese population’s influenza-specific total immunoglobulin G (IgG-total), subtypes 1 (IgG1) and 3(IgG3), and