CONTROLS ON FLUVIAL GEOMORPHOLOGY IN THE CANADIAN ROCKY MOUNTAINS
Kevin T. Quinlan
A thesis submitted to the faculty at the University of North Carolina at Chapel Hill in partial fulfillment of the requirements for the degree of Master of Science in the Department of
Geological Sciences.
Chapel Hill 2014
Approved by:
Tamlin M. Pavelsky
Kevin G. Stewart
ABSTRACT
Kevin T. Quinlan: Controls on Fluvial Geomorphology in the Canadian Rocky Mountains (Under the Direction of Tamlin M. Pavelsky)
The Canadian Rocky Mountains record a dynamic history of erosion. Presently, bedrock
rivers interact with the lithology and structural architecture of a large fold-and-thrust belt.
Because the alpine landscape has been modified by Pleistocene and Holocene glaciation, rivers
are also influenced by relict glacial landscape features. Here, we use topographic analysis and
rock erodibility data to test the impact of lithology and glacial influence on fluvial form and
incision potential in the headwaters of the Athabasca River Watershed. For 30 streams, we
identify spikes in normalized channel steepness (ksn) where fluvial incision is focused. Results
show that proximity to major lithologic contacts is not a predictor of knickzone location. Instead,
bedrock channels are most perturbed from equilibrium where they flow over convexities at the
intersection between hanging valleys and mainstem valley walls. These results suggest that
glacial imprinting—mediated by variations in bedrock geology—controls Holocene erosion in
ACKNOWLEDGEMENTS
The completion of this project is greatly indebted to Dr. Tamlin Pavelsky for welcoming
me into his research group and for providing an unparalleled degree of insight, critique, and
enthusiasm. My committee members, Dr. Kevin Stewart and Dr. Mike Willis, provided
invaluable direction and commentary throughout. Thanks to Dr. Jason Barnes for bringing me to
UNC and for laying the foundations of my thesis research. Funding was provided through
generous grants from the Geological Society of America, Sigma Xi, and the UNC Martin Fund.
TABLE OF CONTENTS
LIST OF FIGURES……….………...vi
CHAPTER 1: CONTROLS ON FLUVIAL GEOMORPHOLOGY IN THE CANADIAN ROCKY MOUNTAINS……….………1
1. INTRODUCTION………...1
2. BEDROCK RIVER MORPHOLOGY………....2
3. GEOLOGIC SETTING………..……….5
3.1. Geology……….5
3.2. Geomorphology………....6
4. METHODS………..9
4.1. Field Data………..9
4.2. DEM Analysis………...11
5. RESULTS………..12
5.1. Rock Erodibility………..12
5.2. Channel Morphology………..14
6. DISCUSSION AND CONCLUSIONS……….19
6.1. Regional Controls on Channel Morphology………...19
6.2. Future Landscape Evolution………...22
6.3. Conclusions………...…..23
APPENDIX 1: FIELD DATA………...……25
LIST OF FIGURES
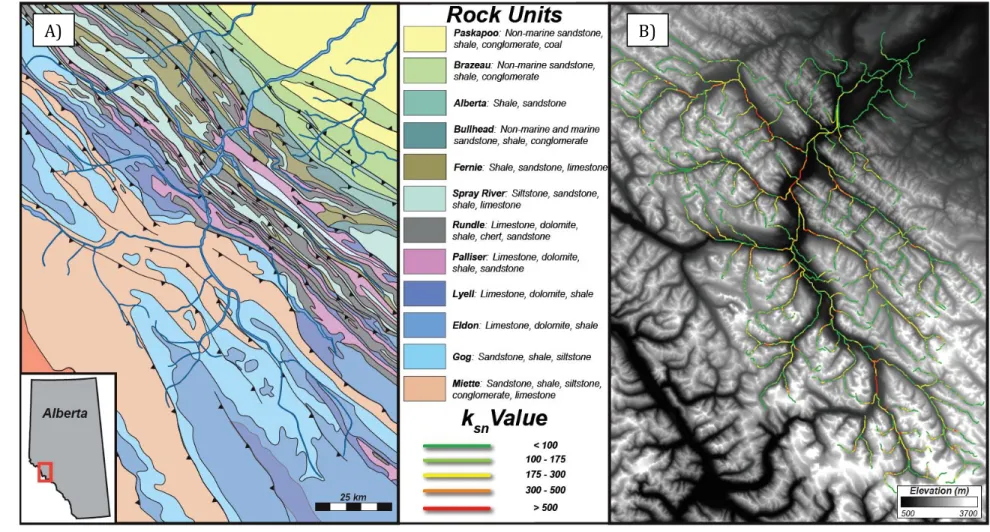
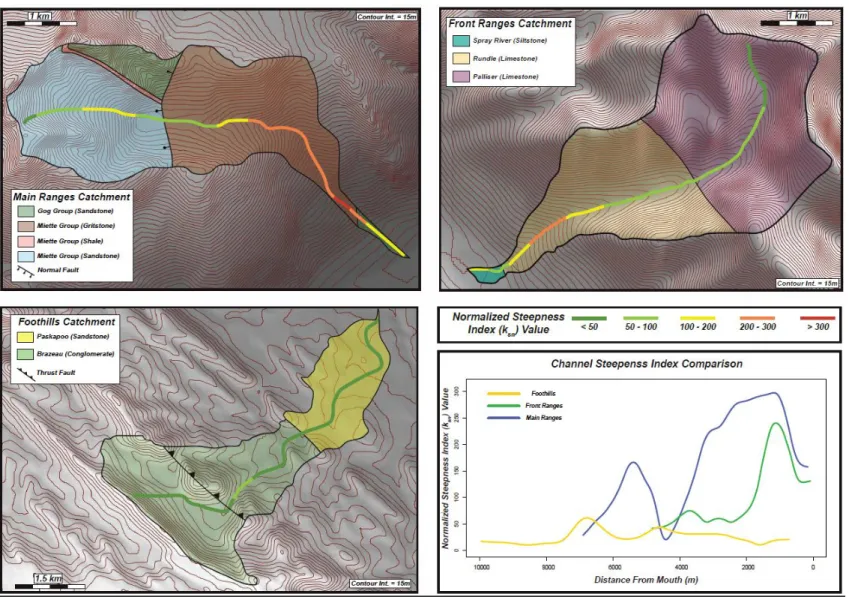
Figure 1 – Geology, topography, and steepness patterns in the Athabasca basin headwaters……3
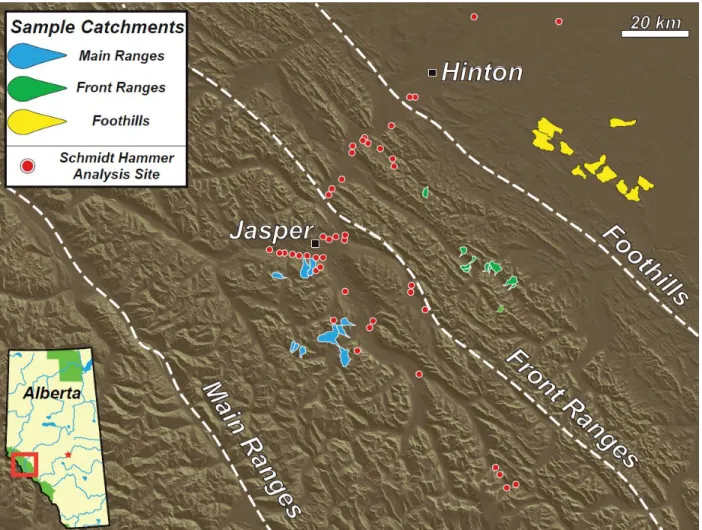
Figure 2 – Map of measurement sites………10
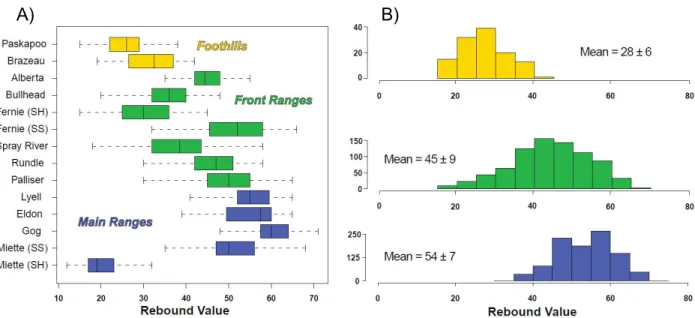
Figure 3 – Schmidt Hammer rebound data………14
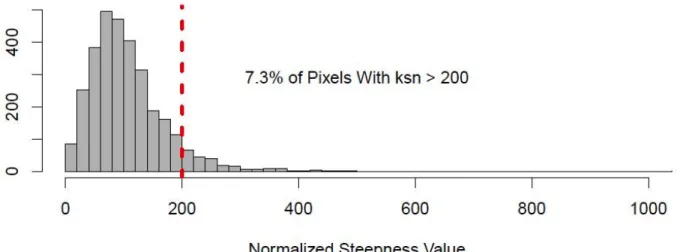
Figure 4 – Distribution of normalized steepness values (ksn) for stream pixels
within the Athabasca River watershed upstream of Hinton, AB……...…………...15
Figure 5 – Representative first-order stream catchments for all physiographic provinces………17
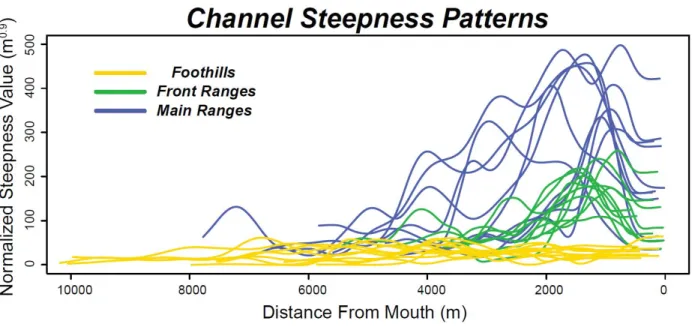
Figure 6 – Along-channel normalized steepness value (ksn) for 30 first-order
streams in the Athabasca River watershed………...……….18
Figure 7 – Typical first-order bedrock channel incision a gorge as it flows
CHAPTER 1: CONTROLS ON FLUVIAL GEOMORPHOLOGY IN THE CANADIAN ROCKY MOUNTAINS
1. INTRODUCTION
Mountain topography is the result of tectonic deformation modified by erosion via
glacio-fluvial processes. In unglaciated alpine environments, bedrock rivers record the impact of
tectonic, climatic, and lithologic variations on mountain landscape development (Tinkler and
Wohl, 1998; Whipple, 2004; Kirby and Whipple, 2012). The erosive capacity of
detachment-limited streams controls the movement of materials through the geomorphic system and thus
creates mountainous physiography (Seidl and Dietrich, 1992). Absent external perturbation,
these stream profiles approach a smooth, concave-upward form in which gradient and discharge
are adjusted to equilibrium (Ritter et al., 1995). When disrupted from equilibrium, streams may
erode the underlying substrate until equilibrium is restored. As such, a fundamental relationship
links a river’s morphology to its potential for incision (Sklar and Dietrich, 1998; Whipple and
Tucker, 1999). Analysis of fluvial geomorphology in mountain environments reveals regional
patterns of erosion and therefore elucidates the modern history of landscape evolution (Burbank
and Anderson, 2011).
In the modern Canadian Rocky Mountains, bedrock rivers are the dominant agents of
Holocene landscape modification. These streams flow over complex and variable fold-and-thrust
belt geology in a landscape recently modified by alpine glaciation (9-10 ka), with ice now
bedrock strength and glacial preconditioning of the landscape (Ballantyne, 2002; Hobley, 2010;
Whitbread, 2012). However, the relative importance of these factors in control of Holocene
fluvial geomorphology is not fully understood. Recent studies of bedrock channel morphology
have primarily addressed actively uplifting orogenic systems with comparably homogenous
bedrock geology and little or no recent glacial activity (e.g. Kirby et al., 2003; Whipple, 2004;
Safran et al., 2005; Wobus et al., 2006; Kirby and Whipple, 2012). Fewer studies have
performed channel analysis in tectonically passive mountain belts with a history of glaciation
(e.g. Bishop and Goldrick, 2010; Egholm et al., 2013). The manner in which fluvial form (and
therefore topography) evolves in mountain belts following both orogenesis and glaciation
remains an area of open inquiry.
This study uses topographic analysis and field-based proxies for bedrock strength to
evaluate the principal controls on fluvial geomorphology within the Canadian Rocky Mountains.
We focus on the montane portion of the Athabasca River watershed in Alberta (Figure 1). The
Athabasca and its tributaries drain a landscape that is representative of the lithology, structure,
and glacial imprinting throughout the orogen. By quantifying channel form and rock erodibility,
we seek to understand the relative influence of bedrock geology and glacial imprinting on
patterns of fluvial morphology and erosion in the Canadian Rocky Mountains.
2. BEDROCK RIVER MORPHOLOGY
Bedrock rivers are high-gradient channels developed in reaches of exposed bedrock
where the underlying substrate exerts a primary influence on fluvial process (after Tinkler and
Wohl, 1998). It is not uncommon for these streams to experience periodic cover of alluvial
A)! B)!
Figure 1. Geology, topography, and steepness patterns in the Athabasca basin headwaters. (A) Bedrock geology is represented at the 1:1,000,000 scale, highlighting the major structural and stratigraphic relationships between major formations in the vicinity of Jasper National Park. Modified from Price et al., 1973. (B) Stream network for major drainages in the montane portion of the Athabasca River watershed. Colors represent per-pixel normalized steepness value (ksn).
!
1993). In such fluvial environments, the primary agents of bedrock erosion are abrasion and quarrying, the former producing more constant (though less efficient) erosion and the latter producing more infrequent, high magnitude erosive events (Hancock et al., 1998). Importantly, the detachment-limited nature of bedrock channels causes these reaches to experience unidirectional morphological change. Whereas alluvial rivers “repair” erosive changes in the streambed with mobile sediment (Leopold et al., 1964), erosion in bedrock rivers creates permanent alterations to the channel form. Consequently, bedrock river processes control patterns and rates of topographic evolution in mountainous regions (Kirby and Whipple, 2012).
The relationship between channel slope (S) and upstream drainage area (A) in natural rivers is commonly expressed by the power law relationship:
!= !!!!!! (1)
in which ks is steepness index and θ is concavity index (Flint, 1974). Repeated study has shown
that the relationship in Equation 1 is robust for a great variety of rivers worldwide (e.g. Howard and Kerby, 1983; Whipple and Tucker, 1999, Ouimet et al., 2009; Karlstrom et al., 2012; and many others). Physically, this equation describes the equilibrium form of a river: at low discharges (approximated here as low contributing drainage area) streams must be steep to move water and sediment; at greater discharges, sediment can be transported at shallower gradients. Thus, when a stream is in equilibrium, gradient and contributing drainage area scale predictably according to Equation 1 and values of ksn do not vary greatly along the length of the river.
Streams in disequilibrium do not exhibit a predictable relationship between slope and drainage area (Kirby and Whipple, 2012). In such reaches, local gradient may be much greater than expected and consequently the value of normalized channel steepness index (ksn) must
substantially from equilibrium form. We classify these reaches as knickzones (Haviv et al.,
2010). Along a channel’s profile, knickzones correspond with reaches where the river is
responding to external forcing.
In mountain environments, common external forcings on channel form include tectonic
perturbations, changes in bedrock lithology, inherited landscape features, and variations in
climate (Stock and Montgomery, 1999; Kirby and Whipple, 2001; Duval et al., 2004; Cyr et al.,
2008). In the Canadian Rock Mountains, where tectonic activity is quiescent, we attribute the
greatest possibility for perturbation to a combination of variable bedrock lithology and landforms
inherited from recent glaciation. Calculating the normalized channel steepness index (ksn) for all
points along a stream channel identifies both the magnitude and spatial extent of perturbation
within the fluvial system. Thus, Equation 1 provides insight into the source of external forcing
driving disequilibrium of fluvial geomorphology in the Canadian Rocky Mountains.
3. GEOLOGIC SETTING
3.1 Geology
The Canadian Rocky Mountains are an alpine landscape topographically characterized by
steep, jagged, high-relief peaks (Cruden and Hu, 1999; Price, 2001). This Northwest-striking
mountain belt is a thin-skinned fold and thrust system formed during a complex period of terrane
accretion dated to the Cretaceous and early Paleocene (Bally et al., 1966; Monger et al., 1982;
Price, 1994; Evenchick et al., 2007; Simony and Carr, 2011). Unlike the predominately
crystalline rock of the Southern Rockies, the Canadian Rockies are largely composed of marine
siliciclastic and carbonate sedimentary rock (Price and Mountjoy, 1970) (Figure 1A). Locally
rarely to higher grade schist (Charlesworth, 1967; Gadd, 2009). In the study area, rock ranges in
age from the metasediments of the Precambrian Miette Group (850 – 542 Ma) to the siliciclastic
Paleocene Paskapoo Formation (62 – 58 Ma) (Price et al., 1973). Though igneous intrusives
cross-cut the Canadian Rockies cover sequence, no substantial outcrops exist within the study
area (Gadd, 2009).
Physiographically, the study area can be divided into three major provinces: the Main
Ranges, Front Ranges, and Foothills (Fermor and Moffat, 1992; Osborn et al., 2006). Within the
study area, the high peaks of the Main and Front Ranges abruptly transition to the muted
topography of the Foothills east of the orogen-bounding thrust fault. In the southwest of the
study area, the mountains of the Main Ranges are composed of Cambrian and Precambrian
metasediments including the Neoproterozoic Miette Group, Lower Cambrian Gog Group,
Middle Cambrian Eldon Formation, and Upper Cambrian Lyell Formation. The mountains of the
Front Ranges are composed of the comparably younger siliciclastics and carbonates of the
Devonian Palliser Formation, Carboniferous/Permian Rundle Group, Triassic Spray River
Group, Jurassic Fernie Formation, Lower Cretaceous Bullhead Group, and Upper Cretaceous
Alberta Group. In the Northeast of the study area, the Foothills consist of the youngest rock in
the region: the Upper Cretaceous Brazeau Formation and Paleocene Paskapoo Formation (Price
et al., 1973).
3.2 Geomorphology
Structural, stratigraphic, and geochronological data suggest that the Canadian Rocky
Mountains were at a uniformly high elevation (i.e. an orogenic plateau) immediately following
uplift ~55Ma (e.g. Price and Fermor, 1985; Kalkreuth and McMechan, 1996; Sears, 2001). The
proposed that differential erosion via surface processes has created the modern mountain
physiography (Osborn et al., 2006). This hypothesis contends that bedrock resistance to erosion
is the principal factor governing long-term (106 year scale) landscape development in the study
area. The complex history of topographic evolution highlights the importance of glacial and
fluvial erosion in the geomorphic history of the Canadian Rocky Mountains.
The modern drainage pattern of the upper Athabasca River watershed is strongly
controlled by geologic structure (Figure 1B). The Athabasca River is the major trunk stream in
the study region and cuts across structure, flowing northeast from the Rockies and across the
adjacent plains to its outlet in Lake Athabasca. In the Main and Front Ranges, NW/SE oriented
thrust sheets create a trellis drainage system with major streams parallel to the strike direction of
the orogen. Smaller first- and second-order detachment-limited tributaries flow perpendicular to
these strike-parallel channels. Consequently, these low-order bedrock rivers flow directly across
major lithologic contacts in the fold-and-thrust structure. In the Foothills, where structural
control is less prevalent and bedrock is more homogeneous, drainage shifts from trellis to
dendritic in form.
The Canadian Rocky Mountains represent an alpine environment transitioning from
dominantly glacial to primarily fluvial erosion processes. As recently as 9ka during the
Wisconsinan glacial episode, the region was glaciated as ice from the local alpine glaciers
merged with the adjacent Cordilleran and Laurentian continental ice sheets (Yorath and Gadd,
1995). Only the most extreme elevations in the mountain belt (~ >3300m) would have stood
above the ice cover as nunataks (Gadd, 2009). Though the Wisconsinan glaciation was in retreat
by ~14ka, ice may have occupied alpine valleys well into the early Holocene. In the last 9ka, the
(Osborn and Luckman, 1988). Movement of materials through the modern environment is
controlled mainly by the fluvial network of the basin. In particular, incision is focused at the
scale of first-order bedrock rivers. In these streams, the geomorphic imprint of glaciation remains
immediately evident. Following deglaciation, rivers reoccupied the valley networks and
transported substantial fluxes of paraglacially derived sediment while reestablishing equilibrium
fluvial form.
The valleys modified by glacial erosion are characteristically U-shaped and commonly
feature hanging valleys where tributary alpine glaciers once met trunk valley glaciers
(MacGregor et al., 2000; Amundson and Iverson, 2006). Glacial erosion is proportional to ice
mass; consequently, smaller tributary glaciers did not remove as much material from valleys as
larger trunk glaciers (Anderson et al., 2006). As such, the tributary streams that occupy these
valleys after deglaciation do not meet trunk streams at grade (Braun et al., 1999).
The result of the geomorphic mismatch between tributary and trunk glaciers is a
longitudinal profile convexity commonly known as a hanging valley. Hanging valleys are
characteristic features of high alpine zones in the Athabasca River Watershed. Because they
constitute a preferential flow pathway, hanging valleys in the study area now frequently contain
streams (Amundson and Iverson, 2006). These zones of convexity are a substantial perturbation
from equilibrium form and thus create large knickzones upstream of the fluvial tributary-trunk
confluence (Valla et al., 2010). Bedrock rivers incise gorges into these hanging valley
knickzones as they move materials to reestablish an equilibrium profile (Crosby and Whipple,
2006). Thus, hanging valleys may be a principal source of glacial imprinting on fluvial form in
4. METHODS
4.1 Field Data
To quantify rock erodibility and observe channel morphologies for bedrock rivers in the
Canadian Rocky Mountains, we collected field measurements in the vicinity of Jasper National
Park in Summer 2013. Rock erodibility was quantified in the field via intact rock strength (as
measured by Type N Schmidt Hammer) and by fracture density (Duvall et al., 2004; Goudie,
2006; Duhnforth et al., 2010). The relationship between Schmidt Hammer rebound value,
fracture density, and bedrock resistance to erosion has been well demonstrated: greater rebound
value and lower fracture density correspond to lower potential for erosion, and vice versa (Selby,
1980; Moon and Selby, 1983; Cargill and Shakoor, 1990).
Using 1:500,000 scale geologic maps, we selected 54 bedrock outcrops for erodibility
analysis by proxy of intact rock strength and fracture density (Figure 2). Outcrops proximal to
bedrock streams were preferred. The selected outcrops encompass all major rock formations in
the regional stratigraphic section and range in age from Neoproterozoic through Cenozoic.
Where appropriate, we subdivided formations with substantial intraformational facies changes.
Specifically, the interbedded Jurassic Fernie sandstone and shale were sampled separately, as
were the Miette gritstone and slate.
For each sample site, we conducted 40 rebound compressions on exposed rock surfaces at
a minimum distance of 6 inches from the nearest fracture plane. Consistent with previous studies,
we rejected measurements that pulverized the rock, elicited a hollow noise upon impact, or
produced a rebound value below 11 (Kirby et al. 2003; Snyder et al., 2003; Duvall et al., 2004;
Fractures facilitate erosion by increasing rock surface area exposed to physical and
chemical weathering processes (Hancock et al., 1998). Therefore, we measured fracture spacing
at all bedrock outcrops to complement the Schmidt Hammer measurements and more thoroughly
quantify bedrock erodibility. We used scan lines perpendicular to dominant bedrock fracture
orientation to measure fracture spacing across the length of the outcrop. To assess variability in
the density of bedrock fractures across the study area, we used an analysis of variance (ANOVA)
test to compare the mean values of fracture density for all major lithologic units.
4.2 DEM Analysis
To better understand the extent to which bedrock geology and glacial preconditioning
control fluvial form and incision patterns, we analyzed their spatial correlation with normalized
steepness index (ksn) values along stream profiles in the montane portion of the Athabasca River
watershed. Many previous studies have demonstrated a positive, monotonic relationship between
normalized steepness index (ksn) and rate of channel incision (e.g. Safran et al., 2005; Harkins et
al., 2007; DiBiase et al., 2010; Cyr et al., 2010; Miller et al., 2012). We analyzed channel
morphology using the 0.75 arc-second (~18m resolution) Canadian Digital Elevation Data
(CDED) Digital Elevation Model provided by the Canadian GeoBase project (www.geobase.ca).
The source data in the DEM is derived from the Canadian National Topographic Data Base
(NTDB). We selected this data product for its high spatial resolution and relative lack of noise.
We interpreted variations in ksn along channel profiles to be a proxy for incision potential.
To locate areas of high incision potential (i.e. knickzones), we calculated per-pixel ksn values for
all streams above a minimum 2.5 km2 contributing drainage area in the study region using
ArcGIS and Matlab methods written for the GeomorphTools plugin (following Snyder et al.,
2000; Kirby et al., 2003). To facilitate regional stream comparison and to avoid autocorrelation
of variables, we assigned a fixed regional concavity index (θref) of 0.45 to determine a
normalized steepness index (ksn in units of m0.9) for points along all streams in the regional
drainage network. The selection of this value for concavity index is consistent with previous
studies (Safran et al., 2005; Wobus et al., 2006).
We compared the distribution of ksn values proximal to major lithologic contacts with
intra-formational (or “background”) ksn values to test for signals of incision potential associated
bedrock geology across the study area exerted any control on river form and incision patterns.
Using a georeferenced 1:1,000,000 scale geologic map (Price et al., 1973), we identified all
locations where streams in the study area crossed lithologic contacts between rocks with
statistically different mean rebound values (95% confidence). We extracted ksn values for all
pixels within a 500m radius of these contacts. The selection of a 500m radius reduced the
likelihood of erroneously misrepresenting the location of lithologic contacts (i.e. if the mapped
location and the true location of the contact differ, or if the knickzone associated with the contact
had migrated along the channel profile). For comparison, we then extracted ksn for all stream
pixels in the entire drainage network, excluding those within the 500m radius of each contact.
To isolate the effects of bedrock geology and glacial preconditioning, we selected 10
sub-basins within each of the three physiographic zones (a total of 30 catchments) for quantitative
channel steepness analysis (Figure 2). For all 30 basins, we calculated ksn values at 18 m intervals
along the major bedrock streams draining the catchments. Selected streams are first-order
bedrock channels between 4 and 10 km in length that traverse lithologic contacts (some also
cross major geologic structures). The selected catchments are representative of the bedrock
geology and regional topography exhibited in the three major physiographic provinces.
5. RESULTS
5.1 Rock Erodibility
Schmidt Hammer rebound data for the 54 measured bedrock outcrops show that rock
strength and stratigraphic age are positively correlated (Figure 3A). The softest rock in the study
area comprises the Cretaceous and Paleocene cover sequence exposed at the Foothills. The
Paleocene Paskapoo and Upper Cretaceous Brazeau formations are very friable in outcrop and
region is the Lower Cambrian Gog Group, a notable ridge-forming unit comprised of very well
indurated quartzose sandstone. Schmidt Hammer analysis yielded no significant differences of
intact rock strength between siliciclastic and carbonate rock. However, all major shale/slate
formations yielded uniformly low rebound values.
There are substantial regional variations in erodibility between Main Range, Front Range,
and Foothills bedrock (Figure 3B). Using a Mann-Whitney-Wilcoxon non-parametric test, we
found that the rock of the Main Ranges (mean rebound = 54±7) is harder than that of the Front
Ranges (mean rebound = 45±9) at a statistically significant level (p-value < 2.2 x 10⁻¹⁶), just as
the rock of the Front Ranges is significantly harder than that of the Foothills (mean rebound =
28±6). This trend is consistent with the development of regional physiography: the high, steep
peaks of the Main and Front ranges are held up by old, hard rock while the comparably subdued
topography of the Foothills is underlain by weak rock unable to support steep slopes (Osborn et
al., 2006). A notable exception to this relationship is the slate member of the upper Proterozoic
Miette Group (mean rebound = 21±6). This extremely weak bedrock underlies much of the
Miette River valley including the Jasper Townsite. However, its inability to form ridges means
that this bedrock is not a major contributor to the development of mountainous topography in the
Main Ranges. For this particular reason, we considered only the ridge-forming gritstone and
sandstone members of the Miette Group for our analysis.
ANOVA test demonstrated that variance in fracture density across outcrops of the same
rock type is as great as or greater than the variance between the means of different rock
formations. As such, there is no statistical reason to believe that fracture density varies
toward regional contrasts in erodibility potential. We therefore considered only the Schmidt
Hammer rebound data in our assessment of rock erodibility.
5.2 Channel Morphology
Comparison of channel steepness values within and outside of a 500m radius of contacts
yielded no statistical evidence that streams flowing over contacts are substantially steeper than
they are elsewhere in the drainage network (Figure 4). For stream pixels proximal to lithologic
contacts, mean ksn was 105±65m0.9. The mean ksn for all stream pixels in the study area
(excluding those within 500m of contacts) was a similar value of 108±101m0.9. In addition to a
slightly lower mean steepness value, the percentage of pixels proximal to contacts with a very
high channel steepness value (ksn > 200m0.9), which are indicative of knickzones, is 7.3% while
the percentage of pixels distal from contacts exceeding ksn values of 200m0.9 is 13.4%. Given Figure 3. Schmidt Hammer rebound data. (A) Boxplot of rebound values for all major geologic formations in the study area, arranged in stratigraphic order from youngest at top to oldest at bottom. Increasing rebound value corresponds to decreasing potential for erodibility. (B) Histograms for rock rebound values, grouped by physiographic province, excluding Miette shale.
these findings, there is no evidence that knickzones are disproportionately abundant in the
vicinity of lithologic contacts.
Figure 4. Distribution of normalized steepness values (ksn) for stream pixels within the Athabasca River
Although lithologic boundaries do not determine knickzone location on a regional scale,
clear differences in channel form exist between catchments across the three physiographic
provinces. Figure 5 compares representative first-order stream catchments from each of the three
physiographic provinces in the study area. For each basin, the 1:50,000-scale geology is overlain
onto a contoured 18m DEM image. The main stream is colorized according to normalized
steepness value. Figure 5A shows a bedrock river in the Main Ranges. The area of increased
channel steepness is a major knickzone. At its maximum value, ksn exceeds 300m0.9. Upon its
confluence with the trunk stream, channel steepness decreases as the stream leaves the zone of
perturbation. In Figure 5B, a bedrock river in the Front Ranges exhibits a similar knickzone
located just above the confluence with the trunk stream. However, both the spatial extent and
steepness magnitude of this channel are lesser than observed for the Main Range bedrock river,
with peak values near 250m0.9. However, both the spatial extent and steepness magnitude of this
channel are lesser than observed for the Main Range bedrock river. Figure 5C shows a
representative channel in the Foothills. Although channel steepness does fluctuate slightly along
profile, the corresponding ksn magnitudes are uniformly low and never exceed 100m0.9. The
notable knickzone near the channel mouth in Main and Front Range streams does not exist here.
Expanding upon the observed relationship between channel form and physiographic
province, normalized channel steepness (ksn) values for bedrock streams in the 30 selected study
catchments show regionally distinct patterns of knickzone extent and magnitude (Figure 6).
Greater variations in ksn along the channel profile suggest more substantial deviation from
equilibrium form. We found that ksn values are highly variable for Main Range and Front Range
bedrock rivers but are essentially constant in Foothills streams. These findings reveal a major
Figure 5. Representative first-order stream catchments for all physiographic provinces. (A) Stream in the Main Ranges that flows over a major glacial hanging valley. (B) Stream in the Front Ranges that shows a comparably less pronounced glacial hanging valley. (C) Stream in the Foothills that is unperturbed from equilibrium form. (D) Channel steepness vs. distance from mouth for
pronounced in the Main Range streams, as demonstrated by the extreme magnitudes of
variability in ksn between 1 and 4 km upstream of channel mouth, with peak ksn values exceeding
500m0.9 (Figure 6; blue lines). These knickzones are also visible in the Front Range bedrock
rivers, though its peak ksn values (~250m0.9) and spatial extent are smaller than in the Main
Range catchments (Figure 6; green lines). Notably, these knickzones does not exist in the
Foothills streams, where ksn values rarely exceed 50m0.9 and never surpass 100m0.9 (Figure 6;
gold lines). This result suggests that the source of perturbation present in the alpine catchments
of the Main and Front Ranges does not affect the Foothills.
Figure 6. Along-channel normalized channel steepness value (ksn) for 30 first-order streams in the Athabasca
6. DISCUSSION AND CONCLUSIONS
6.1 Regional Controls on Channel Morphology
The synthesis of rock erodibility data and bedrock river normalized steepness patterns
suggests a fundamental relationship between bedrock geology, glacial preconditioning, and
modern fluvial geomorphology. Field-quantified bedrock strength suggests that distinct patterns
of erodibility exist within and between the major physiographic provinces. These regional
erodibility contrasts support the hypothesis that long-timescale differential erosion has created a
landscape in which modern mountain topography is adjusted to bedrock strength (Osborn et al.,
2006). Thus, our data support the hypothesis that bedrock strength may be a primary control on
topographic evolution in the Canadian Rockies over million-year timescales.
On the shorter timescales relevant to the fluvial system, however, these bedrock strength
differences do not appear to substantially affect channel morphology and patterns of erosion in
the Athabasca watershed. The lack of significant increases in ksn values at or near lithologic
contacts implies that no strong relationship exists between local variations in bedrock geology
and the presence of major knickzones. It is therefore unlikely that fluvial incision is focused at
lithologic contacts. Indeed, the most iconic waterfalls in the region – Athabasca Falls and
Sunwapta Falls – are developed within homogenous bedrock far removed from contacts and may
have been created by block plucking during glacial retreat (Mountjoy and Price, 2003). We argue
that localized variations in bedrock erodibility are not a regionally important first-order control
on fluvial form and process.
This finding complicates the seemingly straightforward relationship between rock
strength and long-term physiographic development in the Canadian Rocky Mountains. Although
processes active on shorter timescales are more dynamic and complex. Our analysis of
normalized channel steepness shows that streams in this area are in a state of disequilibrium. The
inability of bedrock geology to adequately explain this observation suggests that some other
source of perturbation is disturbing these rivers from equilibrium form.
Combining field observations, DEM analysis, and knowledge of regional Quaternary
history, we interpret the major deviations from equilibrium channel form to be glacial in origin.
Specifically, we suggest that the major knickzones seen in the Main Range and Front Range
bedrock rivers (though conspicuously absent in Foothills rivers) are the expression of the
glacially carved hanging valleys characteristic of the Canadian Rockies. The sudden elevation
change between tributary streams and trunk rivers focuses incision in these oversteepened
reaches (Figure 7). In channel steepness analysis, this knickzone is commonly situated at ~1 to 4
kilometers from the confluence, consistent with the normal location of a hanging valley relative
to the modern trunk river
valley (Amundson and
Iverson, 2006). The
morphology of the fluvial
network that presently
occupies this landscape in the
Main and Front Ranges of
the Canadian Rockies is
fundamentally controlled by
this antecedent glacial
system. Figure 7. Typical first-order bedrock channel incising a gorge as it flows
It is important to note that no hanging valley knickzones (zones of channel steepness exceeding 100m0.9) are displayed in Foothills catchments. The thick cover of young, erodible sedimentary rock exposed at the surface here is incapable of supporting steep slopes or mountainous topography. Additionally, the lack of significant geologic structure east of the orogen-bounding thrust suggests that the Foothills were not substantially uplifted or deformed like the rock of the Main and Front Ranges. Previous work shows that this province was hilly well before recent glaciation (Osborn et al., 2006). Because the Foothills were not mountainous during the Holocene and experienced no alpine glaciation, these streams contain no recognizable alpine glacial signature.
The presence of the glacial hanging valley knickzone is apparent in both the Front and Main Ranges, though its expression is somewhat different across the two physiographic provinces. In the Main Ranges, hanging valley knickzones show extremely variable ksn values
that reach high magnitudes over a wide spatial extent. By contrast, the prominent knickzones in the Front Ranges reach lower overall ksn values and are more tightly constrained in space.
Despite a similar glacial history, the interaction between the inherited landscape and modern fluvial form are different.
channel incision is more efficient in the Front Ranges and the evidence of glacial imprint is eroded from the landscape at an accelerated pace.
6.2 Future Landscape Evolution
Previous studies have attempted to quantify the duration over which glacial influence will endure in the Canadian Rockies and adjacent regions. Such studies have largely focused on the reworking of glacial sediment in the paraglacial environment (e.g. Slaymaker and McPherson, 1977; Church and Slaymaker, 1989; Church et al, 1989; Brardinoni and Hassan, 2007). A reasonable estimate for the longevity of paraglacial conditions throughout all of Canada based upon sediment load is 105 years (Ashmore, 1993). However, local flux in the Rockies is more difficult to constrain because multiple Neoglacial advances have complicated the sedimentary record (Brooks, 1994). While these fluctuations do not substantially change estimates for long-term landscape evolution, they may disproportionately affect geomorphology in first-order alpine catchments such as those examined in this study.
this transition will progress may range anywhere from 100ka to more than 500ka (Dadson and
Church, 2005; Hobley et al., 2010).
Across the Canadian Rockies, relaxation from glacial influence will be controlled at least
in part by variations in rock erodibility across the orogen. Extreme resistance to erosion in the
Main Ranges will delay the restoration of V-shaped valleys, while this process will be
comparably faster in the Front Ranges. However, future Neoglacial fluctuations may maintain a
glacial erosive regime in the highest alpine reaches of both ranges, delaying indefinitely the
complete restoration of fluvial valleys. The Foothills, currently in relative geomorphic
equilibrium, will likely retain their present geomorphic character over these timescales.
6.3 Conclusions
Our findings demonstrate that glacial imprinting is the dominant control on patterns of
river erosion in the modern Canadian Rocky Mountains. Although bedrock geology does not
control fluvial geomorphology at the scale of lithologic boundaries, strength contrasts across the
three physiographic provinces control the preservation of glacial landforms across the region.
Though the presence of hanging valleys and other glacial landforms is well documented in this
region, their overwhelming significance in controlling channel form of montane streams in the
Athabasca River Watershed highlights the importance of lingering glacial signals in the
Canadian Rockies.
Recognizing this first-order control of glacial imprinting on modern fluvial
geomorphology has implications for the broader study of post-orogenic mountain environments.
An enduring mystery in geomorphology is the mismatch between calculated erosion rates in
active orogenic systems and the enduring lifespan of passive mountain belts (Bishop, 2010;
orogens may contribute to improved landscape evolution modeling. Additionally, mountain
systems such as the Canadian Rockies serve as distant-future analogues for modern uplifts such
as the Andes. Constraining the erosive history of passive orogens may lend greater predictive
power to long-term estimates for the topographic development of active orogens as they
APPENDIX 1: FIELD DATA
This dataset compiles all field measurements collected in the vicinity of Jasper Nation
Park in Alberta, Canada during Summer 2013. Stations are arranged in chronological order of
collection. Locations are recorded with WGS84 coordinates in units of decimal degrees.
Formation names were assigned using the 1:1,000,000 scale geologic map (Price et al., 1977).
I.D. Date Latitude Longitude Formation Schmidt #s Scanline Fracture Spacing
01 7/31/13 53.19984 -117.91840 Bullhead (Lower Cretaceous)
N/A N/A N/A
02 7/31/13 53.17753 -117.97148 Spray River (Triassic)
32, 34, 56, 41, 51, 32, 42, 32, 20, 28, 28, 38, 18, 54, 50, 58, 56, 56, 54, 28, 33, 47, 58, 39, 44, 43, 38, 32, 27, 54, 54, 48, 52, 54, 33, 50, 38, 30, 34, 30
13 feet, horizontal
3' 10'', 6' 0'', 7' 11", 12' 2"
03 7/31/13 53.12793 -117.77441 Fernie (Jurassic)
52, 44, 41, 42, 46, 48, 52, 49, 44, 44, 50, 42, 58, 42, 44, 54, 50, 62, 52, 56, 48, 60, 57, 47, 48, 47, 41, 42, 43, 46, 45, 49, 54, 60, 47, 49, 42, 46, 38, 46
9 feet, horizontal
0' 6", 1' 0", 1' 11", 3' 10", 4' 5", 5' 10", 9' 3"
04 7/31/13 53.14490 -117.78050 Fernie (Jurassic)
45, 48, 56, 58, 49, 52, 58, 56, 45, 58, 60, 48, 42, 48, 42, 39, 52, 46, 48, 55, 42, 42, 62, 66, 62, 58, 54, 57, 58, 42, 55, 52, 51, 51, 53, 42, 42, 42, 51, 41
13 feet, vertical
05 7/31/13 53.17533 -117.83955 Fernie (Jurassic)
32, 51, 43, 40, 32, 60, 59, 57, 57, 59, 55, 55, 45, 42, 51, 53, 54, 56, 57, 46, 40, 60, 60, 58, 44, 45, 45, 50, 66, 59, 60, 50, 52, 55, 50, 54, 42, 55, 40, 42
7 feet, vertical
0' 0", 0' 11", 1' 10", 2' 6", 3' 0", 3' 6", 4' 2", 4' 8", 6' 0"
06 8/1/13 53.19522 -117.90406 Bullhead (Lower Cretaceous)
39, 36, 35, 32, 34, 32, 43, 35, 38, 35, 32, 42, 33, 36, 38, 32, 37, 29, 38, 36, 42, 29, 30, 36, 42, 33, 28, 40, 35, 28, 38, 32, 30, 33, 38, 46, 44, 30, 50, 29
13 feet, horizontal
0' 5", 2' 10", 3' 3", 4' 4", 4' 10", 6' 6", 7' 3", 7' 8", 10' 7", 11' 9"
07 8/1/13 53.19522 -118.07282 Spray River (Triassic)
30, 39, 36, 42, 28, 33, 29, 24, 22, 24, 28, 26, 38, 39, 25, 28, 26, 27, 32, 30, 33, 35, 18, 23, 25, 24, 40, 39, 52, 41, 21, 39, 24, 32, 35, 20, 24, 20, 31, 36
6 feet, vertical
0 ' 3", 0' 5", 0' 9", 0' 11", 1' 2", 1' 5", 2' 3", 2' 7", 2' 11", 3' 8", 3' 11", 4' 3", 4' 7", 5' 0", 5' 5", 5' 11", 6' 0"
08 8/1/13 53.05261 -118.07154 Palliser (Devonian)
56, 41, 48, 38, 43, 47, 51, 48, 41, 50, 50, 44, 45, 48, 44, 53, 41, 50, 54, 51, 43, 56, 44, 40, 48, 56, 43, 59, 51, 47, 40, 56, 52, 58, 48, 56, 55, 47, 45, 62
6 feet, vertical
0' 3", 0' 6", 1' 2", 1' 10", 2' 0", 2' 1", 2' 5", 2' 9", 2' 11", 3' 0", 3' 10", 4' 0", 4' 6", 4' 11", 5' 0", 5' 2", 5' 5", 5' 6", 5' 9", 6' 3"
09 8/1/13 53.19895 -117.92225 Bullhead (Lower Cretaceous)
32, 22, 28, 34, 32, 24, 38, 38, 40, 48, 28, 38, 29, 25, 29, 44, 42, 44, 36, 32, 42, 38, 48, 47, 42, 45, 30, 42, 32, 43, 40, 44, 30, 42, 35, 40, 32, 35, 41, 40
10 8/1/13 53.19880 -117.92234 Bullhead (Lower Cretaceous)
40, 36, 40, 30, 35, 36, 30, 45, 41, 40, 25, 39, 36, 45, 34, 41, 40, 40, 36, 37, 43, 40, 32, 30, 35, 34, 38, 33, 26, 39, 32, 34, 36, 37, 32, 25, 20, 36, 33, 28
8 feet, horizontal
0' 0", 0' 7", 1' 6", 2' 0", 2' 8", 3' 2", 3' 10", 4' 5", 5' 1", 5' 10", 6' 8", 7' 3", 7' 6"
11 8/1/13 53. 16653
-117.97532 Palliser (Devonian)
54, 47, 44, 50, 54, 48, 43, 64, 61, 46, 54, 42, 50, 40, 46, 55, 52, 50, 49, 58, 52, 60, 49, 45, 55, 53, 48, 51, 57, 50, 45, 50, 49, 50, 45, 43, 46, 48, 53, 53
8 feet, vertical
0' 0", 1' 2", 1' 8", 2' 9", 3' 5", 5' 2", 5' 6", 6' 11", 7' 2", 7' 9"
12 8/1/13 53.16724 -117.97329 Palliser (Devonian)
46, 48, 49, 55, 53, 55, 58, 51, 50, 42, 44, 54, 50, 65, 58, 58, 60, 45, 56, 58, 62, 61, 63, 59, 57, 56, 52, 65, 63, 59, 55, 53, 49, 57, 60, 55, 59, 60, 49, 62
8 feet, vertical
0' 0", 1' 1", 1' 6", 1' 10", 2' 5", 2' 10", 3' 2", 3' 6", 5' 10", 6' 5", 6' 9", 7' 7"
13 8/1/13 53.08702 -118.02502 Rundle (Permian)
53, 50, 50, 46, 51, 49, 48, 46, 48, 48, 58, 48, 52, 50, 49, 42, 45, 44, 52, 52, 44, 47, 48, 56, 51, 50, 53, 58, 52, 54, 53, 57, 50, 54, 52, 51, 45, 46, 44, 50
11, feet, vertical
0' 0", 0' 3", 0' 6", 0' 7", 0' 9", 1' 1", 1' 3", 1' 9", 2' 0", 2' 5", 2' 7", 2' 10", 3' 0", 3' 4", 3' 5", 3' 9", 3' 11", 4' 5", 4' 11", 5' 2",5' 5", 5' 9", 6' 0", 6' 6", 7' 2", 7' 6", 8' 1", 8' 9", 9' 6", 10' 1", 10' 3", 10' 10" 14 8/1/13 53.04153 -118.08802 Palliser
(Devonian)
37, 33, 56, 45, 38, 36, 30, 39, 58, 46, 40, 42, 44, 42, 39, 41, 45, 58, 45, 50, 55, 46, 54, 51, 56, 52, 58, 44, 53, 45, 45, 44, 48, 38, 50, 44, 40, 38, 58, 52
7 feet, vertical
15 8/1/13 52.91780 -118.05354 Miette Group (Precambrian)
47, 41, 48, 45, 49, 43, 39, 48, 39, 45, 47, 41, 48, 47, 49, 42, 41, 44, 49, 46, 55, 49, 44, 46, 45, 48, 42, 40, 62, 52, 58, 60, 62, 45, 52, 64, 44, 56, 58, 50
1 per 8ft
16 8/2/13 52.91733 -118.00653 Rundle (Permian)
34, 30, 58, 38, 50, 35, 34, 40, 40, 39, 40, 42, 43, 39, 45, 42, 43, 35, 36, 40, 46, 39, 46, 47, 48, 39, 31, 45, 40, 45, 43, 39, 45, 38, 40, 36, 37, 39, 35, 40
11 feet, horizontal
0' 0", 1' 10", 2' 2", 3' 10", 4' 8", 5' 0", 7' 3", 8' 0", 8' 11", 10' 11"
17 8/2/13 52.92033 -118.00285 Palliser (Devonian)
38, 42, 36, 46, 52, 43, 55, 56, 58, 45, 50, 38, 37, 55, 56, 37, 52, 50, 45, 49, 45, 48, 49, 55, 55, 50, 50, 42, 52, 62, 46, 40, 43, 52, 48, 43, 46, 45, 53, 50
11 feet, horizontal
0' 0", 1' 10", 2' 2", 3' 10", 4' 8", 5' 0", 7' 3", 8' 0", 8' 11", 10' 11"
18 8/3/13 52.71722 -117.61589 Spray River (Triassic)
36, 42, 36, 32, 43, 62, 39, 38, 35, 39, 44, 41, 33, 41, 39, 38, 52, 48, 45, 51, 36, 32, 28, 40, 49, 36, 36, 42, 30, 28, 39, 38, 37, 33, 35, 30, 39, 36, 33, 33
11 feet, vertical
0' 0", 1' 0", 1' 10", 2' 9", 3' 1", 3' 10", 4' 6", 5' 5", 5' 9", 6' 2", 7' 5", 8' 10", 10' 3", 10' 8"
19 8/3/13 52.71722 -117.61589 Spray River (Triassic)
54, 55, 40, 42, 30, 54, 43, 39, 42, 39, 40, 48, 30, 36, 44, 46, 46, 33, 39, 44, 48, 56, 46, 42, 44, 35, 39, 40, 42, 43, 40, 44, 50, 46, 34, 40, 38, 40, 41, 39
11 feet, vertical
20 8/3/13 52.76879 -117.68496 Gog (Cambrian)
51, 52, 58, 46, 46, 52, 50, 52, 62, 50, 61, 52, 63, 48, 53, 56, 56, 58, 56, 52, 50, 50, 60, 58, 59, 51, 57, 55, 50, 59, 60, 53, 56, 58, 60, 65, 53, 54, 61, 58
8 feet horizontal
0' 0", 0' 11", 3' 3", 5' 2", 5' 10", 6' 7", 8' 0"
21 8/3/13 52.78508 -117.68720 Rundle (Permian)
46, 42, 58, 45, 49, 46, 34, 48, 40, 42, 54, 50, 54, 44, 46, 55, 52, 50, 51, 39, 52, 55, 56, 50, 56, 45, 45, 50, 51, 51, 57, 51, 52, 45, 49, 43, 54, 49, 51, 47
8 feet, horizontal
0' 0", 0' 7", 0' 11", 1' 4", 1' 7", 2' 4", 3' 2", 3' 6", 3' 7", 7' 2", 8' 0"
22 8/4/13 52.88093 -118.35069 Miette Group (Precambrian)
49, 51, 50, 48, 50, 50, 49, 46, 46, 54, 51, 44, 45, 45, 43, 40, 49, 38, 52, 35, 46, 47, 40, 45, 52, 46, 58, 40, 43, 50, 48, 50, 45, 46, 45, 43, 52, 49, 49, 50
6 feet, diagonal
0' 0", 1' 8", 2' 0", 2' 9", 2' 11", 3' 6", 4' 1", 4' 5", 4' 8", 5' 2", 5' 6", 5' 11"
23 8/4/13 52.87286 -118.30289 Miette Group (Precambrian)
48, 54, 59, 58, 57, 50, 58, 59, 58, 56, 55, 54, 58, 55, 50, 59, 59, 55, 52, 56, 58, 60, 55, 61, 60, 63, 64, 60, 59, 60, 60, 58, 60, 65, 59, 65, 59, 55, 60, 66
8 feet, horizontal
0' 0", 1' 4", 1' 10", 2' 5", 3' 3", 3' 11", 4' 6", 5' 4", 6' 0", 7' 5"
24 8/4/13 52.87252 -118.29174 Miette Group (Precambrian)
33, 32, 35, 34, 35, 35, 36, 30, 33, 31, 30, 30, 36, 30, 35, 30, 32, 30, 29, 36, 30, 30, 35, 31, 33, 25, 28, 31, 29, 33, 28, 31, 30, 38, 25, 31, 28, 36, 35, 36
15 feet, diagonal
25 8/4/13 52.86647 -118.24937 Miette Group (Precambrian)
58, 55, 55, 50, 60, 58, 63, 50, 50, 55, 57, 50, 50, 49, 56, 59, 50, 50, 51, 49, 53, 48, 52, 58, 52, 49, 55, 49, 2, 58, 51, 51, 60, 63, 50, 59, 60, 63, 60, 52
15 feet 0' 0"
26 8/4/13 52.86254 -118.21318 Miette Group (Precambrian)
49, 51, 49, 55, 54, 50, 49, 51, 56, 52, 51, 55, 46, 47, 51, 51, 58, 55, 56, 51, 48, 54, 57, 55, 50, 51, 49, 55, 50, 55, 50, 51, 45, 45, 54, 45, 56, 55, 56, 49
20 feet 20' 0"
27 8/4/13 52.86060 -118.18167 Miette Group (Precambrian)
50, 50, 55, 50, 45, 49, 49, 50, 48, 51, 48, 50, 45, 55, 49, 48, 51, 59, 55, 60, 50, 55, 56, 50, 45, 49, 54, 49, 47, 47, 45, 52, 48, 50, 51, 45, 49, 55, 50, 49
13' 5" horizontal
0' 4", 3' 1", 4' 5", 7' 9", 9' 10", 13' 0"
28 8/4/13 52.86060 -118.18167 Miette Group (Precambrian)
23, 24, 23, 25, 20, 19, 22, 24, 20, 22, 18, 12, 15, 19, 15, 23, 22, 19, 23, 23, 22, 18, 21, 19, 23, 20, 22, 24, 19, 22, 18, 20, 19, 15, 21, 20, 22, 18, 19, 20
10 feet, horizontal
0' 0", 0' 10", 1' 5", 1' 11", 2' 6", 2' 10", 3' 5", 3' 9", 4' 4", 5' 3", 5' 6", 6' 2", 7' 5", 8' 1", 8' 8", 9' 6"
29 8/4/13 52.85735 -118.13426 Miette Group (Precambrian)
30 8/4/13 52.86200 -118.10952 Miette Group (Precambrian)
56, 50, 65, 56, 53, 52, 62, 59, 63, 57, 58, 50, 51, 49, 55, 53, 50, 55, 50, 51, 54, 48, 60, 48, 57, 60, 58, 61, 52, 48, 60, 52, 60, 60, 61, 56, 51, 51, 58, 50
10 feet, diagonal
0' 0", 3' 4", 5' 5", 6' 8", 7' 8", 8' 3", 9' 1"
31 8/5/13 52.83014 -118.10952 Miette Group (Precambrian)
50, 55, 49, 60, 58, 59, 63, 50, 57, 60, 66, 68, 61, 58, 65, 65, 63, 64, 53, 65, 62, 65, 59, 53, 66, 55, 60, 63, 63, 66, 60, 64, 49, 60, 58, 62, 59, 63, 61, 65
7 feet, horizontal
0' 0", 0' 5", 1' 0", 1' 3", 2' 6", 3' 5", 5' 7"
32 8/5/13 52.82866 -118.12783 Miette Group (Precambrian)
20, 18, 19, 18, 17, 16, 15, 20, 18, 15, 15, 15, 20, 18, 15, 22, 21, 19, 17, 15, 18, 20, 21, 25, 23, 24, 20, 22, 19, 15, 20, 19, 15, 16, 19, 21, 18, 19, 18, 17
6 feet, horizontal
0' 0", 1' 3", 2' 0", 3' 4", 4' 1", 4' 10", 5' 5"
33 8/5/13 52.82723 -118.13531 Miette Group (Precambrian)
16, 15, 15, 16, 14, 15, 12, 14, 15, 14, 12, 20, 15, 14, 14, 19, 18, 18, 12, 15, 14, 15, 21, 19, 14, 17, 15, 14, 19, 16, 15, 18, 21, 20, 12, 16, 19, 18, 15, 15
6 feet, horizontal
0' 0", 1' 3", 2' 0", 3' 4", 4' 1", 4' 10", 5' 5"
34 8/5/13 52.82641 -118.13982 Miette Group (Precambrian)
49, 50, 49, 46, 49, 48, 48, 46, 40, 49, 60, 48, 55, 46, 47, 52, 45, 50, 58, 55, 61, 48, 49, 56, 52, 51, 54, 53, 57, 58, 53, 50, 56, 50, 47, 59, 61, 56, 55, 58
6 feet, horizontal
35 8/5/13 52.82884 -118.14052 Miette Group (Precambrian)
50, 50, 49, 48, 51, 49, 51, 52, 48, 51, 46, 48, 53, 52, 51, 47, 46, 49, 51, 48, 50, 50, 52, 48, 51, 46, 50, 52, 48, 46, 41, 49, 52, 47, 54, 53, 49, 53, 50, 46
5 feet, horizontal
0' 4", 0' 9", 1' 0", 1' 5", 1' 10", 1' 11", 2' 6", 2' 10", 3' 7", 4' 1", 4' 6", 4' 11"
36 8/6/13 52.20898 -117.23329 Eldon (Cambrian)
60, 59, 53, 60, 55, 61, 50, 62, 58, 59, 54, 56, 54, 57, 61, 59, 58, 60, 59, 56, 54, 60, 58, 59, 56, 49, 59, 57, 60, 65, 63, 64, 59, 60, 60, 62, 63, 57, 65, 64
3 feet 0' 8", 1' 6", 2' 4"
37 8/6/13 52.21030 -117.23375 Eldon (Cambrian)
50, 60, 55, 59, 52, 55, 59, 58, 60, 58, 60, 59, 61, 60, 58, 60, 55, 55, 59, 58, 60, 58, 57, 56, 54, 58, 60, 62, 63, 60, 65, 64, 65, 64, 60, 55, 62, 60, 61, 57
5 feet, horizontal
0' 0", 1' 2", 3' 8", 4' 1", 4' 9", 5' 0"
38 8/6/13 52.24736 -117.26542 Eldon (Cambrian)
53, 55, 60, 58, 60, 60, 52, 61, 58, 45, 59, 58, 58, 61, 57, 60, 59, 62, 58, 61, 55, 56, 61, 59, 55, 61, 60, 59, 64, 56, 50, 53, 57, 57, 59, 55, 52, 57, 60, 58
[same as KQ-36]
39 8/7/13 52.68141 -118.04933 Gog (Cambrian)
40 8/7/13 52.76671 -117.99751 Miette Group (Precambrian)
48, 53, 45, 50, 55, 59, 48, 59, 49, 48, 58, 47, 50, 55, 58, 57, 49, 47, 55, 50, 60, 48, 53, 58, 59, 51, 43, 49, 55, 49, 54, 60, 48, 59, 53, 55, 54, 52, 57, 43
5 feet, horizontal
0' 0", 0' 2", 1' 9", 2' 11", 4' 0", 5' 0"
41 8/7/13 52.66525 -117.88160 Gog (Cambrian)
63, 65, 62, 51, 61, 50, 49, 64, 56, 60, 60, 58, 66, 60, 58, 45, 59, 66, 62, 64, 61, 63, 63, 60, 60, 63, 62, 61, 52, 67, 61, 61, 65, 70, 60, 60, 63, 62, 61, 60
10 feet, horizontal
0' 0", 5' 3", 9' 8"
42 8/7/13 52.66525 -117.88160 Gog (Cambrian)
55, 65, 58, 60, 62, 62, 66, 64, 60, 65, 62, 63, 64, 60, 50, 57, 60, 61, 60, 58, 50, 51, 60, 55, 60, 58, 60, 59, 62, 64, 60, 60, 64, 62, 64, 50, 60, 55, 58, 62
[same as KQ-41]
43 8/7/13 52.53238 -117.64463 Eldon (Cambrian)
49, 46, 40, 42, 47, 50, 42, 45, 45, 48, 45, 44, 40, 47, 43, 40, 40, 44, 50, 46, 47, 43, 46, 47, 39, 46, 40, 47, 40, 46, 47, 47, 43, 40, 41, 45, 49, 46, 40, 39
10 feet horizontal
0' 0", 0' 8", 1' 0", 1' 6", 2' 3", 3' 0", 3' 10", 4' 5", 5' 0", 5' 4", 6' 6", 6' 10", 7' 8", 8' 1", 9' 5"
44 8/7/13 52.68049 -117.87132 Gog (Cambrian)
70, 69, 67, 70, 69, 71, 64, 63, 65, 66, 67, 68, 68, 66, 70, 69, 68, 70, 67, 65, 67, 70, 67, 68, 68, 67, 68, 68, 68, 67, 67, 66, 66, 67, 62, 62, 65, 58, 67, 66
5 feet, horizontal
45 8/10/13 53.54143 -116.99100 Paskapoo (Paleogene)
28, 35, 34, 30, 29, 35, 38, 28, 34, 27, 35, 33, 35, 38, 24, 22, 20, 23, 25, 24, 23, 22, 21, 22, 22, 23, 23, 20, 20, 27, 18, 21, 23, 24, 29, 28, 22, 25, 29, 21
N/A N/A
46 8/10/13 53.55551 -117.39812 Paskapoo (Paleogene)
15, 19, 28, 29, 26, 28, 27, 30, 24, 27, 26, 21, 27, 20, 21, 20, 20, 28, 35, 25, 24, 28, 23, 18, 20, 26, 25, 30, 29, 26, 27, 23, 31, 29, 28, 28, 29, 15, 32, 27
5 feet, horizontal
0' 0", 0' 8", 1' 4", 1' 9", 2' 2", 2' 7", 3' 0", 3' 11", 4' 9"
47 8/10/13 53.32169 -117.69856 Brazeau (Late Cretaceous)
25, 25, 24, 26, 33, 35, 37, 33, 38, 30, 31, 25, 40, 28, 39, 35, 34, 40, 20, 28, 19, 22, 42, 39, 28, 33, 32, 19, 30, 29, 27, 36, 38, 30, 40, 23, 35, 34, 37, 40
6 feet, horizontal
0' 0", 1' 4", 1' 10", 2' 9", 3' 5", 4' 10", 5' 0"
48 8/10/13 53.32341 -117.69146 Alberta (Cretaceous)
44, 43, 44, 42, 35, 48, 45, 42, 46, 45, 46, 37, 48, 47, 42, 42, 45, 55, 49, 42, 38, 52, 46, 48, 50, 48, 38, 47, 44, 51, 35, 40, 44, 32, 41, 48, 41, 49, 42, 46
6 feet, vertical
0' 0", 0' 8", 1' 9", 2' 0", 2' 3", 3' 1", 3' 6", 4' 4", 5' 1"
49 8/10/13 53.24000 -117.78945 Fernie (Jurassic)
38, 36, 25, 30, 25, 26, 29, 25, 30, 36, 19, 25, 24, 27, 38, 33, 39, 45, 37, 38, 32, 36, 36, 20, 34, 33, 32, 45, 15, 21, 20, 22, 27, 26, 31, 38, 30, 32, 30, 24
4 feet, diagonal
50 8/10/13 53.24000 -117.78945 Fernie (Jurassic)
62, 63, 64, 58, 56, 64, 62, 61, 65, 62, 62, 63, 65, 62, 63, 61, 58, 64, 64, 66, 45, 50, 49, 57, 56, 61, 55, 54, 57, 55, 58, 57, 60, 48, 61, 50, 59, 58, 60, 58
5 feet, vertical
0' 0", 0' 9",1' 3", 1' 8", 2' 11", 3' 5", 4' 1", 4' 10"
51 8/11/13 52.91926 -118.09380 Miette Group (Precambrian)
48, 50, 55, 40, 42, 45, 47, 46, 43, 55, 60, 50, 53, 40, 48, 39, 44, 50, 56, 45, 44, 45, 32, 41, 44, 40, 42, 40, 41, 41, 37, 44, 45, 51, 40, 39, 46, 40, 38, 52
6 feet, horizontal
0' 0", 0' 3", 0' 8", 0' 9", 1' 5", 1' 10", 2' 4", 2' 5", 3' 1", 3' 11", 4' 2", 4' 4", 4' 10", 5' 7"
52 8/11/13 52.91742 -118.08065 Miette Group (Precambrian)
45, 45, 38, 39, 45, 44, 43, 48, 50, 44, 36, 43, 51, 49, 40, 41, 52, 38, 51, 46, 48, 40, 50, 43, 47, 41, 44, 42, 43, 46, 40, 57, 44, 48, 39, 47, 39, 50, 46, 47 53 8/12/13 52.59689 -117.93593 Gog
(Cambrian)
57, 49, 50, 61, 52, 60, 59, 50, 60, 63, 50, 49, 66, 61, 60, 54, 63, 58, 57, 62, 66, 63, 62, 65, 63, 55, 65, 60, 61, 66, 62, 60, 65, 62, 66, 60, 60, 66, 58, 65
10 feet, diagonal
0' 0", 4' 2", 9' 11"
54 8/13/13 52.21968 -117.19070 Lyell (Cambrian)
55, 53, 58, 58, 60, 63, 62, 60, 53, 50, 49, 61, 59, 55, 50, 62, 57, 54, 53, 59, 53, 54, 63, 57, 56, 49, 58, 60, 61, 52, 50, 57, 48, 60, 54, 47, 59, 45, 60, 55
10 feet, horizontal
55 8/13/13 52.26783 -117.28579 Lyell (Cambrian)
55, 50, 54, 57, 56, 52, 54, 48, 62, 63, 63, 65, 54, 53, 51, 56, 61, 55, 50, 60, 52, 56, 52, 49, 62, 44, 49, 61, 55, 56, 48, 53, 56, 48, 43, 60, 53, 56, 58, 41
5 feet, horizontal
APPENDIX 2: DEM DATA
Listed below are along-channel normalized steepness values for 30 study catchments in
the three physiographic provinces – Main Ranges, Front Ranges, and Foothills. Distances are
recorded from the channel mouth (minimum value) to the headwaters (maximum value). To
avoid artificial spikes in channel steepness at confluences, some streams are truncated upstream
of their junction with the trunk river (i.e. measurements begin at some distance greater than 0m).
Main Ranges 1 Main Ranges 2 Main Ranges 3
ksn Values (m0.9) Upstream
Distance (m)
ksn Values (m0.9) Upstream
Distance (m)
ksn Values (m0.9) Upstream
Distance (m) 166
166 166 166 166 166 166 166 166 166 166 166 166 166 166 166 166 166 166 166 166 271 271 271 271 271 271 271 271 271 271 340 340 340 340 340
174 192 218 243 261 287 312 338 363 389 414 440 465 491 516 542 567 593 618 644 669 695 720 746 771 797 822 848 873 899 924 950 975 1001 1026 1052
269 269 269 269 269 269 269 269 269 269 269 269 269 269 269 269 269 269 269 269 269 269 269 304 304 304 304 304 304 304 304 304 304 304 304 304
74 92 110 129 147 166 184 202 228 247 265 284 302 328 354 380 406 432 458 484 510 528 554 580 606 632 651 677 695 721 740 766 784 810 828 847
286 286 286 286 286 286 286 286 286 286 286 286 286 286 286 286 286 286 286 286 286 286 286 286 286 396 396 396 396 396 396 396 396 396 396 396
53 53 53 53
3252 3270 3288 3314
67 67 67 67 48 48 48 48 48 48 48 48 48 48 48 33 33 33 33 33 33 33 33 33 33 33
3264 3290 3308 3326 3345 3371 3397 3423 3449 3475 3493 3512 3538 3564 3590 3616 3642 3668 3686 3704 3723 3741 3760 3778 3804 3830
Main Ranges 4 Main Ranges 5 Main Ranges 6
ksn Values (m0.9) Upstream Distance (m)
ksn Values (m0.9) Upstream Distance (m)
ksn Values (m0.9) Upstream Distance (m) 152
152 152 152 152 152 152 152 152 152 152 152 152 152 152 152 152 152 152 152 152 152 152 203
126 144 162 181 199 218 236 254 273 291 317 336 362 388 414 432 458 484 510 536 562 588 614 640
179 179 179 179 179 179 179 179 179 179 179 179 179 179 179 179 179 179 179 179 179 179 179 250
18 37 55 74 92 110 129 155 181 207 233 259 285 311 337 363 389 407 433 459 485 511 537 563
68 68 68 68 68 68 68 68 68 68 68 68 68 68 68 68 68 68 68 68 68 68 68 68
44 44 44 44 44 44 44 28 28 28 28 28 28 28 28 28 28 28 20 20 20 20 20 20 20 20 20 20 20 20
6490 6508 6527 6553 6579 6605 6631 6649 6675 6701 6727 6753 6772 6790 6808 6827 6845 6864 6882 6900 6926 6945 6963 6982 7008 7026 7044 7070 7096 7122
99 99 99 99 99 99 99 99 99 99 99 99 140 140 140 140 140 140 140 140 140 140 140 122 122 122 122 122 122 122 122 122 122 122 73 73 73 73 73 73 73 73 73 73 73 73 73
6801 6819 6838 6856 6874 6893 6919 6945 6971 6989 7008 7034 7060 7086 7104 7130 7148 7167 7185 7211 7230 7256 7274 7300 7326 7352 7370 7389 7407 7426 7444 7470 7496 7522 7548 7566 7585 7603 7622 7640 7658 7677 7695 7714 7740 7758 7776
40 40
6596 6622
Main Ranges 7 Main Ranges 8 Main Ranges 9
ksn Values (m0.9) Upstream
Distance (m) ksn Values (m
0.9) Upstream
Distance (m) ksn Values (m
0.9) Upstream Distance (m) 424
424 424
92 110 129
35 35 35
81 107 133
164 164 164
56 56 56 56 56 56 56 52 52 52 52 52 52 52 52 52 52 52 52 49 49 49 49 49 49 49 49 49 49 49 49 49 49 31 31 31 31 31 31 31 31 31 31
4728 4746 4765 4783 4802 4820 4838 4857 4875 4894 4912 4930 4956 4982 5001 5027 5045 5064 5082 5100 5119 5137 5156 5174 5192 5211 5229 5248 5266 5284 5303 5321 5340 5358 5384 5410 5436 5462 5480 5506 5532 5558 5584
74 74 74 74 74 74 74 74 74 74 91 91 91 91 91 91 91 91 91 91 91 91 89 89 89 89 89 89 89 89 89 89 89 89 89 89
5150 5169 5195 5221 5239 5258 5276 5294 5313 5331 5350 5376 5394 5412 5431 5449 5468 5486 5504 5523 5541 5567 5586 5604 5622 5641 5659 5678 5696 5714 5733 5751 5770 5788 5806 5825
Main Ranges 10 Front Ranges 1 Front Ranges 2
ksn Values (m0.9) Upstream Distance (m)
ksn Values (m0.9) Upstream Distance (m)
ksn Values (m0.9) Upstream Distance (m) 280
280 280 280 280 280 280
199 218 236 254 273 291 310
84 84 84 84 84 84 84
37 55 74 92 110 129 147
36 36 36 36 36 36 36
59 59 59 59 59 59 59 31 31 31 31 31 31 31 31 31 31 31 15 15 15 15 15 15 15 15 15 15 23 23 23 23 23 23 23 23 23 23 23 23 23 23 31 31 31 31 31 31 31 31 31 31 31 41
2582 2608 2634 2652 2671 2689 2708 2734 2752 2778 2804 2830 2856 2874 2893 2911 2937 2956 2974 3000 3026 3052 3078 3104 3130 3148 3167 3193 3219 3237 3256 3274 3292 3311 3329 3348 3366 3384 3403 3421 3440 3458 3484 3510 3536 3562 3588 3606 3625 3651 3669 3688 3706 3724
152 152 152 152 146 146 146 146 146 146 146 146 146 146 146 98 98 98 98 98 98 98 98 98 98 58 58 58 58 58 58 58 58 58 58 58 58
41 41 41 41 41 41 41 41 41 50 50 50 50 50 50 50 50 50 50 50 59 59 59 59 59 59 59 59 59 59 59 59 51 51 51 51 51 51 51 51 51 51 51 51 51
3780 3806 3832 3850 3876 3902 3920 3939 3957 3983 4002 4028 4046 4064 4090 4109 4127 4153 4179 4198 4216 4234 4253 4279 4305 4331 4357 4383 4401 4420 4438 4456 4475 4501 4519 4538 4556 4574 4593 4611 4630 4648 4666 4685 4703
Front Ranges 3 Front Ranges 4 Front Ranges 5
ksn Values (m0.9) Upstream Distance (m)
ksn Values (m0.9) Upstream Distance (m)
ksn Values (m0.9) Upstream Distance (m) 131
131 131 131 131
81 100 118 136 155
146 146 146 146 146
208 234 260 286 312
55 55 55 55 55
66 66 66 66 66 66 66 66 66 66 52 52 52 52 52 52 52 52 52 52 52 52 52 45 45 45 45 45 45 45 45 45 45 45 42 42 42 42 42 42 42 42 42 42 42 42
3891 3909 3935 3961 3980 3998 4024 4042 4068 4087 4105 4124 4142 4160 4179 4197 4216 4234 4252 4271 4297 4315 4341 4367 4386 4412 4430 4448 4467 4485 4511 4530 4556 4574 4600 4626 4652 4670 4689 4707 4726 4744 4762 4781 4807 4833
83 83 83 83 83 83 83 83 122 122 122 122 122 122 122 122 122 122 122 122 122 127 127 127 127 127 127 127 127 127 127 127 127 127 87 87 87 87 87 87 87 87 87 87 87 87 49 49 49 49 49 49 49 49
49 60 60 60 60 60 60 60 60 60 60 60 60 61 61 61 61 61 61 61 61 61 61 61 40 40 40 40 40 40 40 40 40 40 40 40
4819 4845 4864 4882 4900 4919 4945 4971 4989 5008 5026 5044 5063 5089 5107 5133 5159 5178 5196 5222 5240 5266 5285 5303 5329 5355 5381 5407 5426 5444 5462 5481 5499 5518 5536 5562
Front Ranges 6 Front Ranges 7 Front Ranges 8
ksn Values (m0.9) Upstream Distance (m)
ksn Values (m0.9) Upstream Distance (m)
ksn Values (m0.9) Upstream Distance (m) 71
71 71 71 71 71 71 71 71 71 71 71 71 71
218 236 254 273 291 310 328 346 365 383 402 428 446 472
110 110 110 110 110 110 110 110 110 110 110 110 110 110
484 510 536 562 588 606 625 643 662 680 698 717 743 761
124 124 124 124 124 124 124 124 124 124 124 124 124 124
47 47 47 47 47 47 47 40 40 40 40 40 40 40 40 40 40 40 40 3338 3356 3382 3400 3426 3445 3471 3489 3508 3526 3552 3578 3596 3615 3633 3659 3678 3704 3730 82 82 82 59 59 59 59 59 59 59 59 59 59 59 59 59 3306 3324 3350 3368 3394 3413 3431 3450 3468 3486 3505 3523 3542 3560 3578 3597
Front Ranges 9 Front Ranges 10 Foothills 1
ksn Values (m0.9) Upstream
Distance (m)
ksn Values (m0.9) Upstream
Distance (m)
ksn Values (m0.9) Upstream
51 51 51 51 51 51 51 51 51 51 49 49 49 49 49 49 49 49 49 49 55 55 55 55 55 55 55 55 55 55 55 55
3170 3196 3222 3248 3274 3293 3319 3345 3371 3397 3415 3434 3460 3486 3504 3530 3556 3582 3600 3626 3645 3663 3682 3708 3734 3760 3786 3812 3830 3848 3867 3885
28 28 28 28 28 28 28 28 28 28 28 28 28 28 28 28 32 32 32 32 32 32 32 32 32 32 32 32 44 44 44 44 44 44 44 44 44 44 44 44 44 40 40 40 40 40 40 40 40 40 40 40 23 23
23 23 23 23 23 23 23 15 15 15 15 15 15 15 15 15 15 15 12 12 12 12 12 12 12 12 12 12 12 16 16 16 16 16 16 16 16 16 16 13 13 13 13 13 13 13 13 13 13 13 9 9 9 9