IN VIVO ANALYTICAL PERFORMANCE ASSESSMENT OF NITRIC OXIDE-RELEASING GLUCOSE BIOSENSORS
Robert Joseph Soto
A dissertation submitted to the faculty at the University of North Carolina at Chapel Hill in partial fulfillment of the requirements for the degree of Doctor of Philosophy in the
Department of Chemistry (Analytical Chemistry)
Chapel Hill 2016
Approved by:
Mark H. Schoenfisch
R. Mark Wightman
James W. Jorgenson
Timothy C. Nichols
iii ABSTRACT
ROBERT JOSEPH SOTO: In Vivo Analytical Performance Assessment of Nitric Oxide-Releasing Glucose Biosensors
(Under the direction of Mark H. Schoenfisch)
The utility of implantable glucose biosensors as continuous glucose monitoring technologies is limited by poor in vivo accuracy, resulting primarily from the foreign body response (FBR). Polymeric membranes capable of releasing nitric oxide (NO)—an endogenous gas and key mediator of inflammation and angiogenesis—have been shown to mitigate the FBR and thus hold promise for improving in vivo glucose sensor function. Herein, the effect of a reduced FBR on in vivo glucose sensor function was studied using NO-releasing membranes.
To address the low NO storage of silica nanoparticles, a new particle system (mesoporous silica) was synthesized for use in glucose sensor membranes. Briefly, an interfacial ion exchange reaction was developed and used to chemically modify mesoporous silica nanoparticles with NO donors. The resulting materials were capable of large NO storage (0.8–2.4 µmol mg-1) and tunable NO-release kinetics (NO-release durations 2–40 h). The NO-releasing nanoparticles were employed as dopants within polyurethane materials and adapted as coatings for amperometric glucose biosensors.
iv
d) implantation period. Sensors capable of ~3 d NO release were also characterized by a shorter response time (<4.2 min) to changing blood glucose levels than burst NO-releasing and control sensors (>5.8 min) at 3, 7, and 10 d.
v
To my parents, Rob and Lorraine, and to my wife, Valerie, who have selflessly given their love and support
and continue to do so each day
“The road goes ever on and on, down from the door from where it began… Now far ahead the road has gone, and I must follow it if I can” –J. R. R. T.
vi
ACKNOWLEGEMENTS
Accepting the risk of being unoriginal, I believe the African proverb “it takes a village to raise a child” certainly extends well beyond the normal adolescent age in my case. I am fortunate that, throughout my life, I have been surrounded by scientists with an unconditional passion for their discipline. To Bob Campbell, Del Thorpe, and Vince Dober—thank you for taking an interest in my science education at an early age and for your patience. I can’t bear the thought of having to teach myself at that age. I am grateful to two of my undergraduate mentors, Prof. Craig Aspinwall and Prof. Victor Hruby, for providing a conducive learning environment and encouraging me to pursue graduate research. Finally, I express my endless gratitude to Prof. Mark Schoenfisch for being a teacher, life mentor, and friend. None of this work would have been possible without your ideas and unmatched persistence. You pushed me to reach for the stars.
vii
of Dr. Elizabeth Merricks, Prof. Timothy Nichols, Prof. Dwight Bellinger, Dr. Lauren Wimsey, Dr. Margaret Whitford, Mark Kloos, and Robin Raymer at the Francis Owen Blood Research Lab. Thank you for all of your work and advice during our studies of the foreign body response and glucose sensor performance in diabetic pigs.
viii
ix
TABLE OF CONTENTS
LIST OF TABLES ... xiv
LIST OF FIGURES ... xvi
LIST OF ABBREVIATIONS AND SYMBOLS ...xx
CHAPTER 1. IN VIVO GLUCOSE BIOSENSORS: ROLE OF BIOCOMPATIBILITY ON ANALYTICAL PERFORMANCE ...1
1.1. Diabetes and blood glucose management ...1
1.2. Analytical technologies for in vivo glucose measurement ...3
1.2.1. Electrochemical glucose detection ...3
1.2.2. Optical glucose detection ...7
1.2.3. Commercial glucose monitoring technologies...8
1.3. Foreign body response ...9
1.3.1. Foreign body response and glucose sensor analytical performance ...11
1.3.2. Foreign body response deficiencies associated with diabetes ...17
1.4. Material strategies to mitigate the foreign body response ...20
1.4.1. Zwitterionic polymers ...20
1.4.2. Porous and nanopatterned coating materials...22
1.4.3. Release of tyrosine kinase inhibitors ...28
1.4.4. Dexamethasone release ...29
1.4.5. Nitric oxide release ...31
1.4.5A. Nitric oxide-release strategies ...33
x
1.5. Summary of dissertation research ...42
1.6. References ...44
CHAPTER 2. IN VIVO ANALYTICAL PERFORMANCE OF NITRIC OXIDE RELEASING GLUCOSE BIOSENSORS ...66
2.1. Introduction ...66
2.2. Experimental section ...69
2.2.1. Materials ...69
2.2.2. Synthesis of nitric oxide-releasing silica nanoparticles ...70
2.2.3. Preparation of nitric oxide-releasing mock sensors ...71
2.2.4. Characterization of nitric oxide-releasing substrates ...72
2.2.5. Fabrication and in vitro performance of nitric oxide-releasing glucose sensors...73
2.2.6. In vivo protocol for assessing glucose biosensor analytical performance ...74
2.2.7. Data analysis ...75
2.3. Results and discussion ...77
2.3.1. In vitro characterization of nitric oxide-releasing glucose biosensors ...77
2.3.2. In vivo biosensor run-in time, glucose sensitivity, and Clarke error grid ...83
2.3.3. Biosensor numerical accuracy and adherence to ISO criteria ...89
2.3.4. Biosensor lag time...93
2.3.5. Post-explantation analysis ...96
2.4. Conclusions ...97
2.5. References ...99
CHAPTER 3. FUNCTIONALIZED MESOPOROUS SILICA VIA AN AMINOSILANE-SURFACTANT ION EXCHANGE REACTION: CONTROLLED SCAFFOLD DESIGN AND NITRIC OXIDE RELEASE...105
3.1. Introduction ...105
xi
3.2.1. Materials ...108
3.2.2. Mesoporous silica nanoparticle synthesis ...109
3.2.3. Nanoparticle characterization ...110
3.2.4. N-diazeniumdiolate modification and nitric oxide release measurements ...111
3.2.5. Statistical analysis ...112
3.3. Results and discussion ...113
3.3.1. Nitric oxide release ...127
3.3.2. Organosilane modification ...132
3.3.3. Aminosilane modification and nitric oxide-release kinetics ...137
3.4. Conclusions ...141
3.5. References ...142
CHAPTER 4. DESIGN CONSIDERATIONS FOR SILICA PARTICLE-DOPED NITRIC OXIDE-RELEASING POLYURETHANE GLUCOSE BIOSENSOR MEMBRANES...149
4.1. Introduction ...149
4.2. Experimental section ...151
4.2.1. Materials ...151
4.2.2. Synthesis of N-diazeniumdiolate-modified silica nanoparticles ...152
4.2.3. Synthesis of S-nitrosothiol-modified silica nanoparticles ...156
4.2.4. Preparation and evaluation of nitric oxide-releasing mock sensors ...158
4.2.5. Nitric oxide-release measurements ...159
4.2.6. Design and analytical performance evaluation of miniaturized nitric oxide-releasing glucose biosensors ...162
4.2.7. Membrane and particle characterization ...166
4.3. Results and discussion ...166
xii
4.3.2. Polyurethane membranes incorporating S-nitrosothiol-modified
silica particles...176
4.3.3. Nitric oxide release from S-nitrosothiol-based polyurethane/silica membranes ...179
4.3.4. Analytical performance of nitric oxide-releasing electrochemical glucose biosensors ...182
4.4. Conclusions ...190
4.5. References ...192
CHAPTER 5. FOREIGN BODY RESPONSE TO NITRIC OXIDE-RELEASING SUBCUTANEOUS IMPLANTS IN A STREPTOZOTOCIN-INDUCED SWINE MODEL OF DIABETES ...198
5.1. Introduction ...198
5.2. Experimental section ...200
5.2.1. Materials ...200
5.2.2. Synthesis of N-diazeniumdiolate-modified mesoporous silica nanoparticles ...201
5.2.3. Synthesis of S-nitrosothiol-modified mesoporous silica nanoparticles ...202
5.2.4. Preparation of nitric oxide-releasing polyurethane-membrane coated implants ...203
5.2.5. Membrane characterization ...204
5.2.6. In vivo protocol ...205
5.2.7. Statistical analysis ...207
5.3. Results and discussion ...207
5.3.1. Characterization of nitric oxide-releasing polyurethanes ...207
5.3.2. Inflammatory response...211
5.3.3. Collagen deposition ...217
5.3.4. Angiogenesis ...221
5.4. Conclusions ...224
5.5. References ...226
xiii
6.1. Summary of dissertation research ...232 6.2. Future directions ...234
6.2.1. Hydrophobic surface modification of N
-diazeniumdiolate-based silica particles ...234 6.2.2. Improving the handling and storage stability of S
-nitrosothiol-based silica particles ...236 6.2.3. Molecular and cellular basis for the anti-inflammatory
capacities of NO ...239 6.2.4. In vivo glucose sensor analytical performance evaluation in
xiv
LIST OF TABLES
Table 2.1. Size and nitric oxide-release characterization for MAP/NO and
MPTMS-RSNO silica nanoparticle dopants ...78
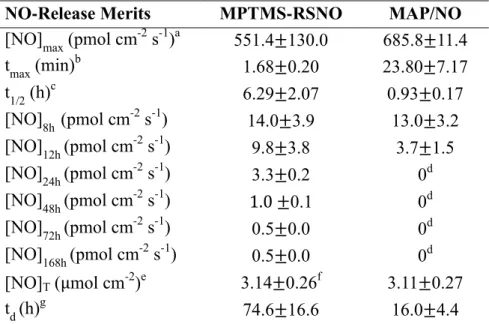
Table 2.2. Nitric oxide release from polyurethane coatings doped with
NO-releasing MPTMS-RSNO and MAP/NO nanoparticles ...81
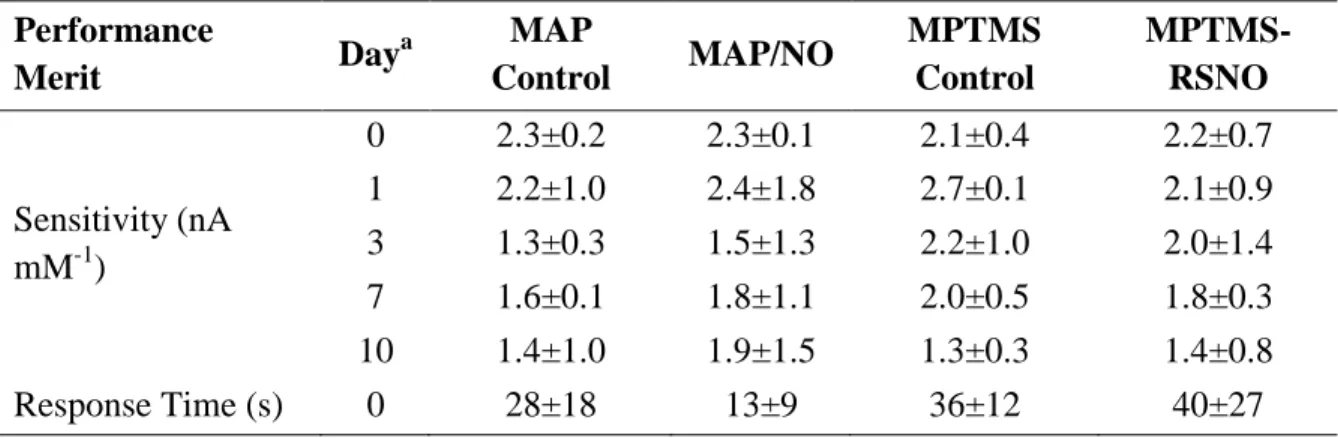
Table 2.3. Glucose sensor analytical performance in phosphate buffered
saline (pH 7.41, 37 oC) ...82
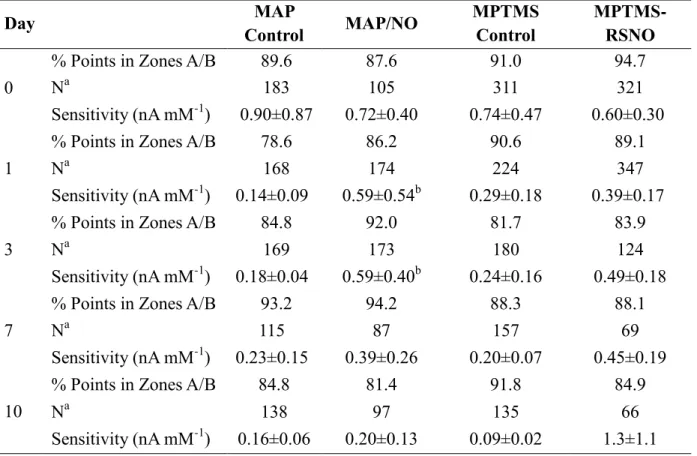
Table 2.4. Clinical performance and apparent in vivo sensitivity of
glucose biosensors ...86
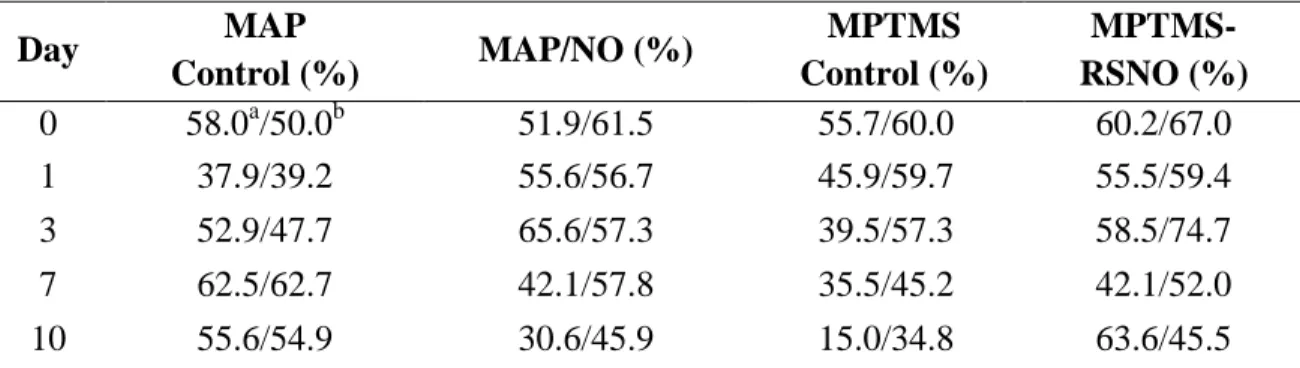
Table 2.5. ISO criteria for NO-releasing and control sensors ...91
Table 3.1. Synthesis conditions and nitrogen physisorption data for MSNs
of varying size ...114
Table 3.2. Characterization of AEAP-modified 1100 nm mesoporous
silica particles as a function of reaction aminosilane
concentration ...117
Table 3.3. Physicochemical characterization of AEAP-functionalized
MSNs of varying size...125
Table 3.4. Chemiluminescent NO release measurements in physiological
buffer (PBS, pH 7.4, 37 oC) from AEAP/NO MSNs of varying
size ...128
Table 3.5. Elemental analysis of 150 nm APTES, BTMS, and MPTMS
particles ...135
Table 3.6. Physicochemical and nitric oxide-release characterization of 30
nm NO-releasing MSNs as a function of aminosilane
modification ...138
Table 4.1. Reaction parameters for synthesis of amine-modified
mesoporous silica nanoparticles ...153
Table 4.2. Reaction parameters for synthesis of thiol-modified silica
nanoparticles ...157
Table 4.3. Nitric oxide-release properties for selected NO donor-modified
silica particles...161
Table 4.4. Analytical performance merits of glucose biosensors coated
xv
Table 4.5. Analytical performance merits of glucose biosensors coated
with different PUs (80 mg mL-1 PU solutions) ...169
Table 4.6. Particle leaching measurements for membranes doped with
RSNO-modified particles of varying MPTMS content ...178
Table 4.7. Particle leaching and NO-release measurements for PU
membranes doped with 75 mol% MPTMS/TEOS particles ...180
Table 5.1. Nitric oxide release from polyurethane membranes doped with
xvi
LIST OF FIGURES
Figure 1.1. Schematic design for the needle type glucose biosensor ...6
Figure 1.2. Foreign body response to implanted glucose sensors ...10
Figure 1.3. Model of macrophage biofouling layer at the surface of
implantable glucose sensors ...14
Figure 1.4. Pore-size dependence of foreign body response to solid and
porous poly(2-hydroxyethyl)methacrylate hydrogels ...24
Figure 1.5. Common NO donors and schematic representation of NO
donor-doped polymers ...34
Figure 1.6. Chemical structures of select NO donor-modified organosilane
precursors ...36
Figure 1.7. Photomicrographs of Masson’s Trichrome or hematoxylin and
eosin stained tissue slices adjacent to control or NO-releasing
xerogels ...38
Figure 1.8. Tissue histology and glucose recovery for control and
NO-releasing microdialysis probes ...40
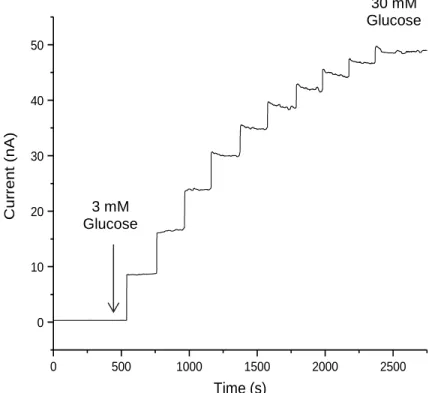
Figure 2.1. Amperometric response for NO-releasing needle type glucose
sensor after pre-conditioning in PBS ...80
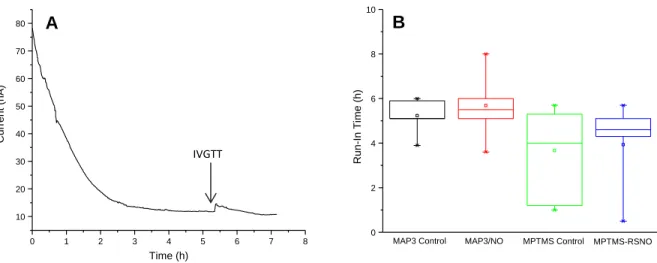
Figure 2.2. Representative current trace for glucose biosensor following
implantation and distribution of estimated run-in times for
NO-releasing and control sensors ...84
Figure 2.3. Clarke error grid for MPTMS-RSNO biosensors on day 0 ...87
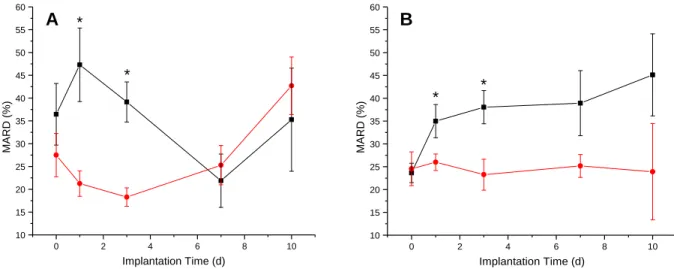
Figure 2.4. Comparison of MARD values for NO-releasing and control
glucose biosensors ...90
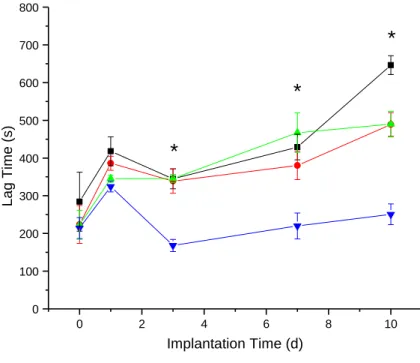
Figure 2.5. Estimation of NO-releasing and control sensor lag times via
cross-correlation ...94
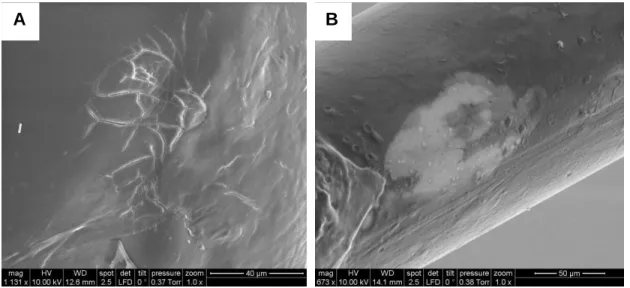
Figure 2.6. Representative post-explantation scanning electron
micrographs of glucose biosensor working electrode surfaces...95
Figure 3.1. Nitrogen sorption isotherms for different-sized, unmodified
mesoporous silica nanoparticles ...115
Figure 3.2. Nitrogen sorption isotherms for 1100 nm AEAP-modified
xvii
Figure 3.3. Solid-state CP/MAS 29Si NMR spectra of 1100 nm MSNs
synthesized at different AEAP concentrations ...120
Figure 3.4. Small-angle X-ray scattering profiles for 1100 nm MSNs
synthesized at different AEAP reaction concentrations ...121
Figure 3.5. Transmission electron micrographs of different-sized AEAP
MSNs ...122
Figure 3.6. Scanning electron micrographs of 1100 nm AEAP-modified
particles with reactant AEAP concentrations of 11.5 and 14.3
mM ...123
Figure 3.7. Solid-state CP/MAS 29Si NMR spectra of different-sized
AEAP-modified particles ...126
Figure 3.8. Small-angle X-ray scattering profiles for different-sized
AEAP-modified particles ...131
Figure 3.9. Proposed mechanism for MSN functionalization with
aminosilanes ...133
Figure 3.10. Transmission electron micrographs of 150 nm MSNs modified
with APTES, BTMS, or MPTMS ...134
Figure 3.11. Real-time NO-release profiles for 30 nm MSNs with different
NO donor modifications ...139
Figure 4.1. Proposed chemical structures of select silanes modified with
either N-diazeniumdiolate (MAP, AHAP, DET) or S-nitrosothiol
(MPTMS) NO donors ...154
Figure 4.2. Inductively coupled plasma optical emission spectrometer
instrumental response to sodium silicate standard solutions and
silica particle standards prepared in pH 7.4 PBS. ...160
Figure 4.3. Scanning electron micrographs of
N-diazeniumdiolate-modified silica nanoparticles ...164
Figure 4.4. Scanning electron micrographs of S-nitrosothiol-modified
silica nanoparticles ...165
Figure 4.5. Initial NO-release measurements and 1 wk leaching assessment
of DET/NO-doped PU membranes ...171
Figure 4.6. Leaching of 800 nm N-diazeniumdiolate-modified particles
from AL-25-80A PU membranes as a function of
aminosilane/NO donor modification ...173
Figure 4.7. Leaching of DET/NO particles from AL-25-80A/SG-85A
xviii
Figure 4.8. Amperometric glucose response for sensors coated with
MPTMS/TEOS-doped HP-93A-100 and PC-3585A topcoat
membranes ...183
Figure 4.9. Nitric oxide release from HP-93A-100 membranes doped with
75% MPTMS/TEOS particles (33 wt% relative to the PU) and
an additional PC-3585A topcoat ...184
Figure 4.10. Amperometric signal for sensors coated with
MPTMS/HP-93A-100 and PC-3585A topcoat membrane upon immersion in
PBS ...185
Figure 4.11. Glucose response for sensors coated with
MPTMS/TEOS-doped HP-93A-100 and PC-3585A topcoat membranes during
2 wk incubation in PBS...187
Figure 4.12. Scanning electron micrographs of sensors coated with
MPTMS/TEOS-doped HP-93A-100 and PC-3585A topcoat
membranes in PBS and in porcine serum ...188
Figure 4.13. Glucose response for sensors coated with
MPTMS/TEOS-doped HP-93A-100 membranes in PBS and in porcine serum ...189
Figure 5.1. Schematic of NO-releasing subcutaneous implants ...208
Figure 5.2. Initial (1 h) NO release from subcutaneous implants in
phosphate buffered saline (37 oC, pH 7.4) ...209
Figure 5.3. Box-and-whisker plot of pigs’ post-prandial glucose values
before and after streptozotocin administration ...212
Figure 5.4. Photomicrographs of hematoxylin and eosin-stained tissues
adjacent to implanted control and NO-releasing materials ...214
Figure 5.5. Inflammatory cell densities in the vicinity of control and
NO-releasing materials ...215
Figure 5.6. Photomicrographs of Masson’s Trichrome-stained tissues
adjacent to implanted control and NO-releasing materials ...218
Figure 5.7. Collagen density in capsular tissue surrounding control and
NO-releasing materials ...220
Figure 5.8. Photomicrographs of anti-CD31 and hematoxylin-stained
tissues adjacent to implanted DET control and DET/NO
materials ...222
Figure 5.9. Blood vessel densities in tissues surrounding DET control and
xix
Figure 6.1. Synthesis of N-acetylpenicillaminepropyltrimethoxysilane
from penicillamine and 3-aminopropyltrimethoxysilane ...238
Figure 6.2. Graph of blood glucose measurements and corresponding
CGM trace demonstrating CGM signal attenuation and lag due
xx
LIST OF ABBREVIATIONS AND SYMBOLS
~ approximately
o
degree(s) o
C degree(s) Celsius
> greater than
> greater than or equal to
< less than
< less than or equal to
% percentage(s)
AP acetaminophen
APTES 3-aminopropyltriethoxysilane
NH3 ammonia
NH4OH ammonium hydroxide
Å angstrom(s)
ANOVA Analysis of Variance
AA ascorbic acid
Arg-2 arginase enzyme
Ar argon
HPU AL-25-80A polyurethane BET Brunauer-Emmett-Teller
BG blood glucose
xxi
cm centimeter(s)
CTAB cetyltrimethylammonium bromide CCL2 Chemokine (C-C motif) ligand 2 CD cluster of differentiation marker CGM continuous glucose monitor Cu+ copper ion (monovalent)
C coulombs
CP/MAS cross-polarization magic angle spinning
d day(s)
DET 3-(trimethoxysilylpropyl)diethylenetriamine
dia diameter
DTPA diethylenetriaminepentaacetic acid
dL deciliter
DLS dynamic light scattering DMF N,N’-dimethylformamide
DX dexamethasone
L-DOPA L-3,4-dihydroxyphenylalanine Deff effective diffusion coefficient
eNOS endothelial nitric oxide synthase enzyme ESEM environmental scanning electron microscopy EGA error grid analysis
et al. et alli; and others EtOH ethanol
xxii FAD Flavin adenine dinucleotide
FBR foreign body response GDH glucose dehydrogenase GOx glucose oxidase
HbA1c glycated haemoglobin level g gravitational acceleration constant
g gram(s)
Hz hertz
h hour(s)
HCl hydrochloric acid H2O2 hydrogen peroxide i.e. id est; that is
iNOS inducible nitric oxide synthase enzyme
ICP-OES inductively coupled plasma optical emission spectrometry IC inflammatory cell(s)
IACUC institutional animal care and use committee
IL interleukin(s)
ISO International Standards Organization
IUPAC International Union of Pure and Applied Chemistry IVGTT intravenous glucose tolerance test
Ir iridium
kDa kilodaltons
kg kilogram(s)
kHz kilohertz
xxiii R2 linear correlation coefficient
LPS lipopolysaccharide(s)
MPTMS (3-mercaptopropyl)trimethoxysilane MIP-1α macrophage inflammatory protein 1α
MC mast cell
[NO]max maximum instantaneous nitric oxide flux MARD mean absolute relative deviation
Hg2+ mercury ion (divalent)
MSN mesoporous silica nanoparticle MOF metal-organic framework
MeOH methanol
MTMOS methyltrimethoxysilane
MΩ megaohm(s)
µg microgram(s)
µL microliter(s)
µm micrometer(s)
µM micromolar
µmol micromole(s)
m meter(s)
mg milligram(s)
mL milliliter(s)
mm millimeter(s)
mM millimolar
mV millivolt(s)
xxiv MCM-41 mobil composition of matter
M molar
mol% mole percentage(s)
O2 molecular oxygen
N2 molecular nitrogen
MCP-1 monocyte chemoattractant protein 1
AEAP N-(2-aminoethyl)-3-aminopropyltrimethoxysilane AHAP N-(6-aminohexyl)aminopropyltrimethoxysilane NAPTMS N-acetylpenicillaminepropyltrimethoxysilane MAP N-methylaminopropyltrimethoxysilane DBHD N,N’-dibutylhexanediamine
nA nanoamperes
ng nanogram(s)
nm nanometer(s)
nM nanomolar
nNOS neuronal nitric oxide synthase enzyme
NO nitric oxide
NOA nitric oxide analyzer
NOS nitric oxide synthase enzyme
NF-ĸB nuclear factor kappa-light-chain-enhancer of activated B cells NMR nuclear magnetic resonance
ppb part(s)-per-billon ppm part(s)-per-million
PBS phosphate-buffered saline
xxv PDGF platelet-derived growth factor
Pt platinum
pHEMA poly(2-hydroxyethyl)methacrylate pCBMA poly(carboxybetaine)methacrylate PDI polydispersity index
PEG poly(ethylene glycol) PEO poly(ethylene oxide)
PLLA poly(L-lactide)/ poly(L-lactic acid) PLGA poly(lactic-co-glycolic)acid PTFE polytetrafluoroethylene
PU polyurethane
PVA poly(vinyl alcohol)
pg picogram(s)
pmol picomole(s)
RF radiofrequency
RNS reactive nitrogen species ROS reactive oxygen species
RANTES regulated on activation, normal T cell expressed and secreted p/p0 relative pressure
SNAP S-nitroso-N-acetylpenicillamine RSNO S-nitrosothiol
SEM scanning electron microscopy
q scattering vector
s second(s)
xxvi
Ag silver
Ag+ silver ion, monovalent AgCl silver chloride
Ag|AgCl silver-silver chloride reference electrode SAXS small-angle X-ray scattering
NaOMe sodium methoxide SCF stem cell factor STZ streptozotocin
SDA structure-directing agent TEOS tetraethylorthosilicate THF tetrahydrofuran
[NO]T total nitric oxide storage TGF-β transforming growth factor β TEM transmission electron microscopy TT TT-2072D-B20 polyurethane TNF-α tumor necrosis factor α
FDA United States Food and Drug Administration
UA urea
VEGF vascular endothelial growth factor
vs. versus
V volt(s), voltage(s)
v/v volume/volume
H2O water
wk week(s)
1
CHAPTER 1. IN VIVO GLUCOSE BIOSENSORS: ROLE OF BIOCOMPATIBILITY
ON ANALYTICAL PERFORMANCE1
1.1 Diabetes and blood glucose management
Diabetes mellitus is a group of metabolic disorders affecting an estimated 21.9 million people in the United States.1 Both subclasses of diabetes (e.g., type I/II) result in impaired production of (or resistance to) insulin, a peptide hormone produced by beta cells in the pancreas that aids in distribution of glucose from blood into tissue cells. A common condition associated with diabetes is persistent hyperglycemia (elevated blood glucose, >130 mg dL-1)2 which, if left unmanaged, is responsible for long-term health complications (e.g., retinal failure, kidney disease).1 Diabetics thus must routinely self-monitor blood glucose (BG) levels and take appropriate therapeutic action (e.g., administer insulin) to avoid hyperglycemia.
Handheld glucometers have proven to be indispensable technologies for personal blood glucose monitoring. Such devices, requiring only ~10 µL blood for accurate glucose determination, provide diabetics with the ability to track trends in blood glucose levels and appropriately adjust insulin, diet, and exercise regimens.3 Landmark studies have shown that rigorous BG management with glucometer technologies reduce both the morbidity and mortality rates of complications associated with persistent hyperglycemia.4-6 Despite the obvious benefits
1
2
associated with the use of glucometers, BG sampling requires patients to pierce their finger with a lance to obtain blood. The discomfort accompanying blood sampling leads to poor patient compliance and infrequent measurement.7 Unfortunately, the routine use of glucometers also results in increased propensity for hypoglycemia (i.e., blood glucose <70 mg dL-1), as glucometers provide only static glucose measurements—such devices are incapable of detecting brief, potentially life-threatening hypoglycemic events.4-6 Although useful for BG monitoring, glucometers alone do not provide the necessary level of diabetes management.
3
1.2 Analytical technologies for in vivo glucose measurement
Accurate glucose measurement requires that the employed analytical method distinguishes glucose from other, structurally similar, natural monosaccharides. The most successful strategies rely on glucose-specific recognition elements (e.g., enzymes,12-14 boronic acid derivatives15) that serve as glucose concentration transducers.16-17 Electrochemical and optical methods are widely utilized for in vivo glucose detection.
1.2.1. Electrochemical glucose detection
Electrochemical glucose sensors represent the most successful technologies to date for glucose measurement.3 The vast majority of electrochemical assays for glucose (both in vivo and ex vivo) rely on glucose-selective enzyme transducers, such as glucose oxidase (GOx) or glucose dehydrogenase (GDH).3,16-17 Glucose oxidase is preferred because the enzyme is regenerated by oxygen following reaction with glucose. In contrast, GDH requires low-abundance electron acceptors (e.g., pyrroloquinoline quinone) as co-substrates.3 In addition, the specificity of GOx (derived from the fungus Aspergillus Niger) for glucose is more than three hundred-fold greater than other, structurally similar monosaccharides (e.g., galactose).13
GOx − FAD + Glucose → GOx − FADH2+ Gluconolactone (1.1)
GOx − FADH2+ O2 → GOx − FAD + H2O2 (1.2)
H2O2 → O2+ 2H++ 2e− (1.3)
4
Amperometry is the preferred detection method due to simpler potentiostat hardware, data analysis, and power requirements.19-31 Of note, low-power instruments for voltammetric glucose measurement were recently described.32
Direct electron transfer from GOx to the electrode surface was initially suggested by Heller.33-34 However, the enzyme redox center (FAD) is significantly removed (tens of Å) from the outer enzyme surface, precluding efficient electron tunneling.35 Degani et al. proposed that “electrically wiring” the enzyme to the electrode surface would overcome the large energetic barrier to electron tunneling.33 This concept was realized by using redox mediators (e.g., [Os(N,N’-dialkylated-2,2’-biimidazole)3]2+/3+) to covalently link GOx to both gold and platinum electrodes.33 Mao et al. reported another approach for glucose detection based on GOx immobilization in redox hydrogels.36 Both methods reduced the electrode potential required for electron tunneling (-0.1 V vs silver-silver chloride (Ag|AgCl), 3 M KCl).36-37 A clear advantage of the lower applied voltage is minimal interference from endogenous electroactive species (e.g., ascorbate). However, the use of heavy metals (e.g., ruthenium, osmium) raises concern regarding toxicity in vivo should such metals leach from the device surface.38
5
platinum microdisk electrodes.19 At least one sensor from an initial pilot study in pigs remained functional for more than a year in vivo. Unfortunately, the accuracy of the device was not assessed in this work. Additionally, the large size of the sensor (3.5 × 1.5 cm) and the need for surgical implantation/removal are shortcomings of this design.
6
Gl
ucos
e
Fl
ux
-Li
m
it
ing
Lay
e
r
Im
m
obi
li
z
e
d
GOx
S
e
le
c
ti
v
it
y
Lay
e
r
Integrated Ag/AgCl Reference Electrode
PTFE Insulation
Epoxy Bead Pt-Ir Electrode
Glucose Gluconolactone O2
H2O2
Figure 1.1. Schematic design for the “needle-type” glucose biosensor.
7
The primary disadvantage associated with hydrogen peroxide oxidation is the high required working potentials (+0.6 V vs. Ag|AgCl on platinum) at which other, endogenous redox species (e.g., ascorbate) may also be oxidized.7 The issue of glucose selectivity has been largely overcome by deposition of additional polymeric layers that obstruct the fluxes of interferents to the sensor surface. For example, cellulose acetate membranes impede ascorbate diffusion via anionic repulsion.45-46 Electropolymerized films of m-phenylenediamine and phenol have been used to impart selectivity for hydrogen peroxide over larger interferents via size-exclusion.47-50 1.2.2. Optical glucose detection
8
fluorescent boronic acid derivative that was immobilized in a porous polyhydroxyethylmethacrylate hydrogel.53
Most glucose binding elements (e.g., Concanavalin A, boronic acid derivatives) do not bind glucose specifically, but are also able to interact with other, structurally similar monosaccharides. For instance, many boronic acid derivatives form strong complexes with galactose and fructose.58 As a result, luminescence-based glucose sensors are susceptible to interference from other saccharides. A recently reported luminescence glucose sensor made use of GOx as the recognition element to circumvent the issue of poor glucose selectivity.55-56 The enzyme was co-immobilized in a poly(2-hydroxyethylmethacrylate-co-acrylamide) hydrogel with a palladium (II) benzoporphyrin phosphor. This species undergoes luminescence quenching by oxygen. The phosphor is interrogated at 630 nm with changes in local oxygen (via glucose reaction with GOx) altering the phosphorescence lifetime (measured at ~810 nm).56
1.2.3. Commercial glucose monitoring technologies
9 deviation) and are approved for a maximum of 7 d use.60
Other, non-invasive CGMs were previously commercialized (i.e., iontophoresis, impedance spectroscopy) but were discontinued due to performance issues.61-63 For example, a non-implantable sensor based on impedance spectroscopic measurements was approved in Europe in 2003.7,62 The device interrogated subcutaneous tissue beneath the sensor using 1–200 kHz electromagnetic waves. Glucose levels were measured indirectly by correlation to impedance measurements via principal component analysis.62-63 However, this method proved unreliable due to the non-specific nature of glucose detection. In addition, changes in skin dielectric properties due to water content and disease state negatively impacted sensor accuracy.61
1.3. Foreign body response
10
Figure 1.2. Foreign body response to implanted glucose sensors. A classical FBR culminates
in the persistence of inflammatory cells (e.g., macrophages, multinucleated giant cells) around the sensor surface for days to weeks. Ultimately, the sensor is sequestered from the surrounding tissue by a dense, avascular collagen capsule. Reprinted with permission from Chemical Reviews, 2013, 113, Nichols, S.P.; Koh, A.; Storm, W. L.; Shin, J. H.; Schoenfisch, M. H. “Biocompatible materials for continuous glucose monitoring devices” pages 2528– 2549, Copyright 2013 American Chemical Society.
Capillaries
Proteins Foreign body Collagen giant cell
Blood vessel Macrophage
Inflammatory cells, bacteria, and proteins
11
1.3.1. Foreign body response and glucose sensor analytical performance
The FBR is initiated upon sensor implantation and damaging of vascularized tissue. Rapid accumulation of serum proteins on the sensor surface occurs within seconds of the initial insult—a process termed “protein biofouling.” Protein biofouling is believed to be partially irreversible.71-72 The concentration of surface-bound proteins in the thin adsorption layer may exceed their bulk (solution) concentration, with an adhered protein layer density (typical values of ~1 g protein cm-3) on some classic polymeric surfaces (e.g., polyurethane) approaching that of pure protein (~1.4 g cm-3).72 A well-known consequence of the accrued protein layer to electrochemical glucose sensors is a loss in analytical sensitivity by up to 40–80%.73 Mechanistic studies of protein adhesion on biomaterial surfaces indicate that small (<15 kDa) fragments of serum albumin and other large proteins are the primary adsorbed biomolecules.74 The initial protein biofouling process is heterogeneous. As a result, the specific identities and dynamics of these adherent proteins remain poorly understood. Nevertheless, the composition of the adsorbed protein layer is still considered to at least partially govern the pathology of the implant wound site during subsequent inflammatory phases.64
12
result, clarifying that decreased sensor output is more likely the result of excess glucose metabolism by leukocytes (macrophages). Normal macrophage glucose metabolism (normalized per cell) is >50-fold greater than for erythrocytes.71 Importantly, Klueh et al.76 and Novak et al.71 agreed that microhemorrhages, which may form intermittently as a result of sensor micromotion,77-78 lead to the observed sensor signal dropout.
Acute inflammation occurs as the initial FBR event during the first several days of implantation, following initial biofouling and provisional matrix formation.64 Mast cells and neutrophils (phagocytic cells) infiltrate the implant site in an attempt to clear the foreign object.79 The neutrophilic response is short-lived (24–48 h) but can be quite severe, contingent upon the degree of initial tissue trauma. In one study, Wang and coworkers implanted silicon chips in the subcutaneous tissue of Sprague-Dawley rats using different-sized needles (18, 16, and 14 gauge) and evaluated the FBR at durations between 3 and 30 d using standard tissue histological methods.80 Implantation of the silicon substrates using a larger needle size (i.e., initial trauma) lead to a more severe 3 d inflammatory response. However, the authors did not observe a significant effect of needle size on the severity of the chronic inflammatory response (>7 d).
13
dropout were frequently observed in the mast cell-sufficient model, whereas glucose sensors in the mast cell-deficient animals were more consistently able to track physiological glucose fluctuations. Histological analysis of the tissue surrounding the implanted sensors revealed a lessened inflammatory response and minimal collagen encapsulation around the implants in the deficient model at 1–4 wk. A separate report by Egozi and coworkers indicated that the neutrophilic response in a mast cell-deficient mouse model (WBB6F1 Kitw/Kitw-v) was reduced compared to analogous WBB6F1 wild-type mice.83 Of note, mast cells are also capable of stimulating fibrocyte translocation from blood vessels to the wound site, with potential implications for subsequent collagen deposition and isolation of the sensor from the native tissue.84 Indeed, Avula et al. showed that collagen deposition was reduced at subcutaneous polyester implants in a mast cell-deficient mouse model (sash model) relative to control mice.85
14
A
B
Figure 1.3. (A) Model of macrophage biofouling layer separating the surface of Minimed
15
16
designation vary widely in terms of their roles in the FBR.97 Given that macrophages are primarily responsible for the chronic inflammatory response, macrophage phenotype may be a more reliable indicator of FBR severity than local macrophage densities. Both classically (M1) and alternatively activated (M2/pro-wound healing) macrophages are recognized to stimulate fibroblast activity (i.e., collagen deposition).98 In particular, expression of transforming growth factor-β by macrophages and FBGCs influences myofibroblast collagen synthesis and deposition.99 An important distinction between the two traditional subclasses of macrophages is that M1 macrophages are considered anti-angiogenic. In contrast, M2a and M2c macrophages, stimulated via IL-4/IL-13 or IL-10/glucocorticoids/secosteroids respectively, are pro-angiogenic.100-101
Macrophages readily adhere to many foreign surfaces through interactions between β1/β2 integrins and surface-bound protein fragments (e.g., Fg fragments) and may remain at the site of an implanted material for months.102 Failure to initiate or maintain proper adhesion to foreign objects triggers frustrated phagocytosis and fusion into foreign body giant cells, which is likely an attempt to escape apoptosis after surface detachment.103 These polynuclear cells are characterized with substantial pro-inflammatory character compared to mononuclear macrophages. Giant cell formation further exacerbates local analyte depletion and increases ROS/RNS production with great propensity to damage sensor components and coatings.104-105 For example, polyetherurethanes—materials that are traditionally used as glucose sensor coatings—are susceptible to stress-cracking and delamination as a result of these intense foreign body reactions,104-106 both of which are widely accepted mechanisms for in vivo sensor failure.104
17
growth and angiogenic factors.75 Collagen deposition, while essential to tissue reconstruction, sequesters the implant from native tissue.67 It has been recognized since the 1990’s that the prototypical foreign body capsule poses a significant diffusion barrier to glucose.107-109 More recent work using a refined two compartment model for glucose transport dynamics showed that the presence of a dense collagen capsule does not overwhelmingly alter glucose concentrations at the sensor surface (vs. bulk concentrations).92 Rather, the foreign body capsule increases the tortuosity of the glucose diffusion path from the vasculature to the sensor surface, creating a pronounced lag (on the order of 20–30 minutes) between glucose concentrations at the sensing surface and corresponding plasma levels. Further compounding this issue, the fibrous capsule surrounding the implant is quite avascular,110 preventing efficient glucose delivery to regions inside the collagen capsule.111 Kumosa et al. observed that oxygen levels in the tissue surrounding fully subcutaneous O2 sensors also decrease over the first several weeks of implantation,20,95 which may further alter glucose sensor response due to limited O2 (the co-substrate for GOx) availability. Of note, the decreased oxygen levels are more likely due to inflammatory cell metabolism and poor vascularization than obstructed diffusion through the capsule. Notwithstanding, the general consequence of both capsule characteristics (avascularity and collagen density) is that in vivo glucose sensors will ultimately fail for long-term sensing applications (i.e., >7 d) due to inadequate analyte permeability and temporal lag to changing analyte concentrations.112
1.3.2. Foreign body response deficiencies associated with diabetes
18
production, cellular recruitment, and angiogenesis.113 Deficient inflammation/wound healing observations are generally extrapolated to include analogous phases in the FBR (i.e., in the presence of a glucose sensor), yet few studies have actually carried out experiments needed to validate these assumptions. This void is partially due to difficulties in producing diabetic animal models that accurately recapitulate FBR in diabetic humans. Animal models of type II diabetes are especially challenging to create, as the disease classification actually encompasses a heterogeneous group of disorders that share the common trait of insulin resistance.114 Nevertheless, several useful models of type I diabetes have been developed that rely on deficiency/depletion of insulin-producing pancreatic β-cells.114-115 For example, the non-obese and biobreeding rat models rely on selective inbreeding of diabetic rats. However, larger animal models of diabetes have not been produced through inbreeding. Chemical induction of diabetes has been accomplished by administration of β-cell toxins, such as streptozotocin (STZ), that cause acute β-cell destruction and rapid onset of hyperglycemia. Such methods reliably induce diabetes in both small (e.g., rats, mice) and large animal models (pigs and baboons).114-116
19
collagen. Despite the reduced inflammatory response, tissue concentrations of the pro-inflammatory cytokines MCP-1 and TNF-α were greater in the diabetic rats (~850 and 0.28 pg per gram of wet tissue, respectively) than in controls (~450 and 0.12 pg g-1, respectively). In addition, the authors observed reduced expression of CD-31 (an endothelial cell cluster of differentiation marker), indicating inhibited angiogenesis. In agreement with Wang et al.,117 Soccarrás et al. also suggested that diabetes delayed the inflammatory response.118
20 excellent utility as a FBR model.121
1.4. Material strategies to mitigate the foreign body response
Strategies to improve the function of implantable glucose sensors are largely directed at mitigating or avoiding key events in the FBR.122-123 Classically, the FBR has been studied as a function of implant surface chemistry.64,69,102-105,124-127 A simple but useful biocompatibility principle that was established early on is that hydrophobic surfaces, such as polystyrene, generally promote a more severe FBR (i.e., greater degrees of macrophage adhesion and frustrated phagocytosis) than hydrophilic surfaces (e.g., polyacrylamide).69,103 However, increased production of pro-inflammatory cytokines was routinely observed on hydrophilic surfaces and was speculated to offset the benefits of any reduced cellular response. As such, proper choice of implant materials/composition alone has not mitigated the FBR to an extent that would benefit the analytical performance of in vivo glucose sensors. The most successful recent tissue biocompatibility strategies, discussed below, aim to simultaneously reduce inflammation and guide appropriate wound healing around the implanted sensor.
1.4.1. Zwitterionic polymers
21
frequently investigated due to ease of synthesis and low-fouling characteristics—however, in vivo degradation/oxidation has limited its usefulness for in vivo glucose sensing.131
22
reduced FBR via pCBMA materials, no reports to date have studied the utility of such biomaterials for improving in vivo glucose sensor performance.
1.4.2. Porous and nanopatterned coating materials
As most surface chemical approaches do not appreciably influence the FBR, researchers have investigated the influence of porosity and surface topography on cellular behavior.138 The most successful illustrations of this approach are porous coatings that have been known to reduce the FBR to implants for more than two decades. Brauker et al. published a seminal report describing the FBR to several commercial polymers (cellulose, polytetrafluoroethylene, and acrylic copolymer) with pore sizes in the range of 0.02–15 µm.139 Vascular structures were consistently observed at large-pore (>0.8 µm) materials that enabled cellular infiltration, irrespective of the chemical composition of the membranes. Neovascularity was enhanced by a factor of 80–100 for polytetrafluoroethylene membranes with a nominal pore size of ~5 µm versus membranes with sub-cellular pore sizes (0.02 µm). Subsequent investigations by Sharkawy and coworkers began to elucidate the mechanisms through which porosity and improved FBR outcomes could impact the performance of in vivo glucose sensors.107-109 In the first of these studies, stainless steel cage implants were coated with either nonporous or porous (60 and 350 µm pores) poly(vinyl alcohol) (PVA) and implanted in rat subcutaneous tissue for tissue histology assessment after 3 and 12 wk.107 Whereas a thick, dense, avascular collagen capsule was observed immediately proximal to the nonporous PVA implants, both porous PVA coatings increased angiogenesis and decreased collagen density. Carefully removed tissue samples adjacent to the implants were used to study fluorescein diffusion through the collagen capsule (as a surrogate for glucose). The measured effective diffusion coefficient (Deff) for
23
s-1) than in subcutaneous tissue alone (2.35×10⁻⁶ cm2 s-1). In contrast, tissues surrounding the 60 and 350 µm porous PVA implants had diffusion coefficients that were more in line with native tissue(2.19×10⁻⁶ and 1.87×10⁻⁶ cm2 s-1, respectively) because of the reduced collagen density. In a follow-up study, tissue response times to changing plasma concentrations of a fluorescent tracer analyte (lissamine-rhodamine) were examined in capsular tissue surrounding the PVA-coated implants.108 As expected, the tissue surrounding 60 µm porous PVA-coated implants responded more quickly to changes in tracer concentrations than in capsules surrounding nonporous PVA materials (~12 and 34 minutes, respectively), implicating neovascularization as an additional key parameter in tissue analyte transport.
24
A
B
C
25
The underlying biological mechanisms and optimal porosity levels were not systematically studied by Koschwanez et al.140-141 due to pore size heterogeneity resulting from the salt-leaching process. Materials with spherical, uniform pore sizes—produced by sphere templating methods—have since been used to study the FBR.142-144 Sussman and coworkers used monodisperse ~34 and 160 µm diameter poly(methyl methacrylate) beads as templates for pHEMA hydrogel fabrication.144 After bead removal in a subsequent Soxhlet extraction step, the resulting porous pHEMA hydrogels were used to examine a potential relationship between pore size and FBR severity in mice. As shown in Figure 1.4, the inability of cells to migrate into the nonporous pHEMA coatings resulted in dense collagen deposition immediately adjacent to the material-tissue interface (Figure 1.4A). In contrast, minimal collagen encapsulation and angiogenesis were hallmarks of the tissue reactions at pHEMA implants with pore sizes on the order of cellular dimensions (~34 µm; Figure 1.4B). Large-pore materials (~160 µm) invoked a more classical FBR, with heavy collagen deposition inside the pores (Figure 1.4C). Other studies by Ratner and coworkers have established favorable FBR outcomes for porous materials with pore sizes on the order of cellular dimensions (~10–20 µm for most leukocytes) irrespective of the identity of the polymer.145 The prevailing hypothesis is that the inability of phagocytic cells (i.e., macrophages) to spread on the material directs them to a more reconstructive M2 phenotype.145-146 Of note, FBR-mitigating pore sizes reported by Brauker et al.,139 Sharkawy et al.,107-109 and Koschwanez et al.140-141 are similar to the optimal pore sizes reported by Ratner’s group.
sensor-26
material incompatibilities (e.g., high temperatures associated with Soxhlet extraction and GOx instability). Electrospinning of polymer solutions represents an alternative approach to fabricating porous sensor membranes. The process of forming nanofibrous polymer mats by electrospinning is straightforward, requiring readily available experimental components (i.e., a syringe pump, high voltage power supply, and metal object to serve as a grounded collector).147 The electrospinning process is typically carried out by applying a high voltage (>5 kV) to a polymer solution droplet at the tip of a metal needle. Repulsive electrostatic forces within the droplet exceed attractive surface tension forces, resulting in the formation of a Taylor cone. The polymer solution stream accelerates toward electrical ground and, upon solvent loss during flight, solidifies into nanofibers that accumulate on the grounded metal collector.147-148 Although the polymer fibers formed by this method are generally polydisperse with respect to fiber diameter, both the fiber size (0.01–10 µm) and porosity of the resulting fiber mats (30–95%) can be controlled by appropriate selection of solution composition (e.g., polymer concentration, polymer identity, conductivity, viscosity) and electrospinning parameters (e.g., voltage, tip-to-collector distance, tip-to-collector geometry, humidity).147-148
27
pro-inflammatory marker, was elevated for macrophages seeded on the 1 µm pore size fiber mats versus macrophages on the larger pore size material. The authors also examined the ability of the polydioxanone fiber mats to influence the phenotypes of macrophages that were pre-polarized to either M1 or M2 states by stimulation with interferon-γ or a cocktail of IL-4/IL-13, respectively. Although the initial macrophage phenotype did impact arginase/iNOS expression, fibers with 15 µm pores consistently yielded macrophages with reduced pro-inflammatory character (i.e., greater arginase/iNOS ratios).150 Based on these results, pore sizes on the order of cellular dimensions (2–20 µm) appear to mitigate the FBR by forcing macrophages and other inflammatory cells to adopt more reconstructive phenotypes.151
Initial work indicates that the orientation of electrospun fibers also appears to be a strong determinant of the FBR. Cao et al. reported that aligned electrospun poly(caprolactone) fibers (~300–500 nm diameter) facilitated greater in vivo cell migration into the fibers compared to randomly oriented fibers in a rat subcutaneous FBR model. Tissue surrounding the aligned fibers consistently exhibited lower grades of inflammation at 1–4 wk post-implantation compared to the tissue at random nanofiber scaffolds. Irrespective of fiber alignment, both types of fibers elicited a 75–90% decrease in collagen capsule thickness (compared to polymeric films) after 4 wk implantation.152
28
electrospun fibers, potential benefits to in vivo glucose sensor analytical performance have not been reported.
1.4.3. Release of tyrosine kinase inhibitors
Tyrosine kinases are a class of enzymes involved in phosphorylation and signal transduction for many biochemical cascades. For instance, the tyrosine kinase KIT (also identified as CD117) serves as a binding receptor for stem cell factor (SCF), an important mast cell growth factor and activator.154 Inhibition of the SCF-KIT pathway limits production of histamine and the pro-inflammatory cytokine IL-4 by mast cells, suggesting suppressed degranulation.155 As outlined in Section 3, mast cells play a crucial role in determining the chronic inflammatory response to implanted sensors.156 Of note, Klueh et al. examined the roles mast cells in the FBR using a mast cell-deficient mouse model (WBB6F1 KITw/KITw-v) produced by selective mutation to the gene encoding KIT.82 The mast cell-deficient mice consequently produced a milder FBR relative to wild-type mice.
29
demonstrating masitinib selectivity toward mast cells.85,158 In a separate study, Avula et al. fabricated electrochemical glucose sensors using the masitinib-releasing coatings. 157 The signal stability of the masitinib-releasing glucose sensors was enhanced versus controls over a 21 d implantation period in mice. Although these results are initially encouraging, the authors did not assess the accuracy of the sensors. In addition, optimal rates and amounts of masitinib (in relation to sensor performance) remain unclear.
1.4.4. Dexamethasone release
Dexamethasone (DX), a synthetic anti-inflammatory glucocorticoid hormone, was one of the initial release agents used to potentially improve the performance of implantable glucose sensors.7 Dexamethasone is a potent agonist for the cytosol-localized glucorticoid receptor that, upon DX binding, translocates to the cell nucleus and achieves its anti-inflammatory effects in part through transactivation/transrepression of key chemokines and cytokines (e.g., IL-1, nuclear factor ĸB, activating protein-1).159-160
Although the mechanisms of DX’s anti-inflammatory action have not been fully elucidated, DX is also known to subdue production of other pro-inflammatory mediators (e.g., tumor necrosis factor-α, IL-6) through other, indirect pathways.161
subcutaneously-30
implanted sensor at pre-determined doses (0.7, 0.28, 0.168, 0.1, or 0.05 mg kg-1 over 28 d). Doses <0.1 mg kg-1 did not incite systemic immune suppression, as illustrated by serum cortisol levels that were similar to those before DX administration. In contrast, DX doses exceeding 0.1 mg kg-1 produced a noticeable decrease in cortisol concentrations. Based on histological analysis of tissues surrounding the implants, it was concluded that the lower DX doses were still sufficient to reduce granulocyte densities at 28 d post-implantation, although the macrophage response was only lessened at DX doses greater than 0.1 mg kg-1.
It is clear from the investigation by Ward et al. that achieving localized anti-inflammatory effects without causing systemic immune suppression requires slow, precisely-controlled DX release.162 Patil et al. developed DX-loaded PLGA microspheres capable of slow hydrolysis in physiological buffer, enabling DX release.163 The PLGA microspheres were immobilized in poly(vinyl alcohol) hydrogels that were shown to release ~4 µg DX per implant over 28 d. These hydrogels were then implanted into the subcutaneous space of rats for histopathological FBR evaluation. Regardless of the implant time (1–28 d), the authors reported reduced inflammatory cell densities at the DX-releasing hydrogels relative to control gels.
31
from a hydrogel inhibited angiogenesis, but simultaneous delivery of DX and L-DOPA increased the formation of blood vessel sprouts relative to controls (i.e., hydrogels that did not contain DX or L-DOPA). While initial results appear promising, achieving optimal delivery rates of both species from sensor coatings remains an arduous task.
Despite the promising histological and immunohistochemical data involving DX-release strategies, few reports have demonstrated improvements to glucose sensor analytical performance. Klueh et al. implanted electrochemical glucose sensors into the subcutis of mice and evaluated the influence of daily intraperitoneal DX injections (1, 6, or 10 mg kg-1) on sensor performance.170 The glucose sensitivity of control sensors degraded rapidly almost immediately after implantation (<1 nA mM-1), with total loss of the glucose response of the sensor within ~24 h. DX treatment helped maintain glucose sensitivity for up to 7 d (3–20 nA mM-1). Histological analysis of tissue samples from the implant site confirmed that a reduced inflammatory response was at least partially responsible for the improved sensor function. The promising sensor performance data notwithstanding, systemic DX administration in this manner is not a viable approach for improving device function outside of the research setting.
1.4.5. Nitric oxide release
32
calmodulin.179 As such, both eNOS and nNOS transiently produce ~nM concentrations of NO (bursts of several minutes in duration) for homeostatic processes such as blood pressure regulation and neurotransmission.178 The endothial NOS isoform is expressed by endothelial cells and platelets, whereas nNOS is expressed in the brain and skeletal muscle.180 The third isoform, iNOS, is not constitutively expressed in tissue but rather produced by immune cells (e.g., macrophages, mast cells) in response to various stimulating factors, including lipopolysaccharides, interferon-γ, and nuclear factor ĸB.181-182 Calmodulin binding for iNOS is less sensitive to intracellular Ca2+ levels and occurs at normal resting cell Ca2+ levels (70–100 nM).179,181 Thus, iNOS activity is largely independent of intracellular calcium and is capable of continuous, high-output (~µM) NO production, primarily as a defense against foreign pathogens.181
33
1.4.5A. Nitric oxide-release strategies
The anti-inflammatory and pro-angiogenic capacities of NO indicate that NO-releasing materials may prove useful for mitigating the FBR and improving the analytical performance of tissue-implanted glucose sensors. However, localized NO delivery from in vivo sensors is not straightforward due to NO’s reactive nature and short lifetime in vivo. The most successful NO-release strategies have relied on the use of NO donors (e.g., N-diazeniumdiolates or S-nitrosothiols) as dopant molecules within polymeric sensor coatings (Figure 1.5). The NO donors are purposefully selected for their ability to undergo chemical breakdown reactions via specific physiochemical triggers with ensuing NO release. N-diazeniumdiolates, formed by the base-catalyzed reaction of secondary amines with gaseous NO, degrade upon protonation of the amine coordinating the NO donor to yield two moles of NO and the regenerated parent amine. The rates of NO production in physiological buffer are predictable and dependent on solution pH, temperature, and the chemical structure of the precursor amine.190 The tunable decomposition rates render N-diazeniumdiolates the most frequently investigated class of NO donors for applications in NO release. S-nitrosothiols (RSNOs), an alternative NO donor, are readily synthesized by reaction of thiols with nitrosating reagents (e.g., acidified sodium nitrite). A number of endogenous RSNOs (e.g., S-nitrosoglutathione) serve as NO transporters that augment NO’s in vivo lifetime.191-192
34
Figure 1.5. Common NO donors and schematic representation of NO-doped polymer
35
36
A
B
C
D
Figure 1.6. Chemical structures of select NO-donor modified organosilane precursors. The
37
Shin et al. initially developed NO-releasing silica xerogels for use as glucose biosensor coatings.23 However, the N-diazeniumdiolate formation reaction necessitated exposure of the underlying glucose oxidase layer to high pressures of NO, resulting in enzyme deactivation. To avoid compromising the stability of the enzyme, Koh et al. synthesized smaller NO-releasing silica nanoparticles (with diameters in the range of 100 nm–1 µm) for use as polyurethane (PU) sensor membrane dopants.21-23 The authors demonstrated control over membrane NO-release kinetics based on either the type of NO-releasing silica particle or the identity of the polyurethane. Glucose sensor analytical performance (i.e., sensitivity and linear dynamic range) was also dependent on polyurethane identity (i.e., water uptake) and membrane thickness. Despite promising initial results, later research indicated that the particles were prone to leaching from the sensor membranes205,213 with the potential to aggravate the FBR.206,214-215
1.4.5B. Subcutaneous tissue biocompatibility of nitric oxide-releasing materials
38
A
B
C
D
Figure 1.7. Photomicrographs of tissue slices stained with
39
to controls. However, this work did not identify optimal NO-release payloads or kinetics.
In subsequent work, Nichols et al. evaluated the severity of the FBR in a swine model as a function of NO-release kinetics.217 Silica particles modified with either N-diazeniumdiolate or S-nitrosothiol NO donors218 were employed as polyurethane dopant molecules to fabricate NO-releasing polymer coatings. The resulting polyurethane/silica composites were diverse with respect to their NO-release kinetics, releasing 2.7–9.3 µmol NO cm-2 for 1–14 d durations depending on the type of silica nanoparticle dopant. Materials capable of releasing NO for at least 2 d both decreased inflammation over the first wk post-implantation and lead to reduced collagen capsule thickness at 3 and 6 wk. In contrast, more rapid NO-releasing materials (~24 h NO-release durations) did not decrease inflammation and were observed to increase collagen density relative to control materials. Although the anti-inflammatory effects of NO were localized to the tissue immediately surrounding the implants, these results indicate the need for precise control of NO-release kinetics for achieving the optimal tissue response.
40
A B
D
C
E
Figure 1.8. Photomicrographs of (A, C) Masson’s trichrome or (B, D) hematoxylin & eosin
41
period (Figure 1.8E). After 8 d, control probe glucose recovery was approximately half that of the NO-releasing probes and further diminished to <5% after 10 d. Tissue histology analysis revealed that the NO-releasing probes induced lower degrees of inflammation and collagen encapsulation than the control probes (Figures 1.8A–D), indicating that the superior glucose recovery for the NO-releasing probes was due in part to a reduced FBR. Based on the favorable improvements to subcutaneous glucose transport, the authors suggested potential benefits of NO release to subcutaneous glucose sensor performance.
42
insufficient to improve sensor performance beyond 24 h. Based on the tissue histology studies by Hetrick216 and Nichols,217 more extended NO release is likely required to improve in vivo glucose sensor analytical performance for longer durations.
1.5. Summary of dissertation research
The focus of this dissertation research was to develop an understanding of the relationships between the foreign body response and the in vivo analytical performance of NO-releasing electrochemical glucose biosensors. Specifically, I sought to translate the NO-NO-releasing silica-based polyurethane sensor membranes to an implantable sensor design for an evaluation of in vivo sensor function. Sensor performance was evaluated as a function of NO-release kinetics using a porcine FBR model. At the same time, the tissue responses to subcutaneously-implanted polyurethanes were assessed in both healthy and diabetic swine models to generate new information on how diabetes and NO impact the FBR. My research aims were to:
(1) evaluate the role of a reduced FBR to NO-releasing glucose sensors on in vivo sensor analytical performance in a pre-clinical swine model;
(2) develop silica nanoparticles with large NO storage and tunable NO-release kinetics for use as dopants in glucose sensor membranes;
(3) systematically develop NO-releasing polyurethanes, adapting the resulting membranes to serve as coatings for electrochemical glucose biosensors;
(4) assess the FBR to subcutaneous implants as a function of disease state (i.e., healthy versus diabetic) and NO-release kinetics.
43
44 REFERENCES
(1) Centers for Disease Control and Prevention "National diabetes statistics report: Estimates of diabetes and its burden in the United States"; Atlanta, GA: U.S. Department of Health and Human Services; 2014.
(2) National Diabetes Data Group "Classification and diagnosis of diabetes mellitus and other categories of glucose intolerance" Diabetes 1979; 1039-1057.
(3) Heller, A.; Feldman, B. "Electrochemical glucose sensors and their applications in diabetes management." Chemical Reviews 2008, 108, 2482-2505.
(4) The Diabetes Control and Complications Trial Group "The effect of intensive treatment of diabetes on the development and progression of long-term complications in insulin-dependent diabetes mellitus" New England Journal of Medicine 1993; 977-986.
(5) UK Prospective Diabetes Study Group "Intensive blood-glucose control with sulphonylureas or insulin compared with conventional treatment and risk of complications in patients with type 2 diabetes" Lancet 1998; 837-53.
(6) UK Prospective Diabetes Study Group "Effect of intensive blood-glucose control with metformin on complications in overweight patients with type 2 diabetes"; Lancet 1998; 854-65.
(7) Nichols, S. P.; Koh, A.; Storm, W. L.; Shin, J. H.; Schoenfisch, M. H. "Biocompatible materials for continuous glucose monitoring devices." Chemical Reviews 2013, 113, 2528-2549.
(8) The Juvenile Diabetes Research Foundation Continuous Glucose Monitoring Study Group "Continuous glucose monitoring and intensive treatment of type 1 diabetes." New England Journal of Medicine 2008, 359, 1464-1476.
(9) Deiss, D.; Bolinder, J.; Riveline, J.-P.; Battelino, T.; Bosi, E.; Tubiana-Rufi, N.; Kerr, D.; Phillip, M. "Improved glycemic control in poorly controlled patients with type 1 diabetes using real-time continuous glucose monitoring." Diabetes Care 2006, 29, 2730-2732.