REMOVAL OF NATURAL ORGANIC MATTER BY ANION EXCHANGE: MULTISCALE EXPERIMENTATION AND MATHEMATICAL MODELING
Treavor H. Boyer
A dissertation submitted to the faculty of the University of North Carolina at Chapel Hill in partial fulfillment of the requirements for the degree of Doctor of Philosophy in the Department of Environmental Sciences and Engineering.
Chapel Hill 2008
Approved by,
Advisor: Philip C. Singer
Reader: George R. Aiken
Reader: Russell F. Christman
Reader: Francis A. DiGiano
Reader: James W. Jorgenson
ABSTRACT
Treavor H. Boyer: Removal of Natural Organic Matter by Anion Exchange: Multiscale Experimentation and Mathematical Modeling
(Under the direction of Philip C. Singer)
Natural organic matter (NOM) is ubiquitous in the aquatic environment and is of concern because it impacts engineered and natural processes. For example, during water treatment, NOM reacts with chlorine to form disinfection byproducts that may be associated with adverse health effects. The conventional water treatment process sequence of coagulation, flocculation, clarification, and filtration is the most common treatment approach used to remove NOM. Anion exchange treatment, however, has the potential to be more effective than conventional treatment. To realize the potential of anion exchange technology, an improved understanding of the interactions among NOM, raw water characteristics, anion exchange resins, and process operating parameters is required.
The experimental scale, flow regime, and test water were systematically varied to investigate the removal of NOM by anion exchange treatment. Bench-scale batch experiments were conducted using synthetic model waters containing NOM isolates and commercially available anion exchange resins, including a magnetic ion exchange (MIEX) resin. The charge density of the NOM isolates was fundamental to understanding anion exchange reactions. Ion exchange was clearly shown to be the mode of removal of NOM by anion exchange resins.
iv
concentration and the resin regeneration ratio, was identified as the most important process operating parameter. The pilot plant study demonstrated that anion exchange treatment could be operated more effectively than previously believed. In addition, the pilot-scale continuous-flow tests and bench-scale batch experiments gave consistent results.
A mathematical model describing the removal of NOM by anion exchange in a completely mixed flow reactor was developed based upon insights gained from the pilot-scale continuous-flow study. Model predictions were found to be in good agreement with experimental data. The validated mathematical model was used to evaluate the relative influence of operating parameters, anion exchange resin properties, and NOM characteristics on process performance. The mathematical model was also used to evaluate various treatment scenarios.
ACKNOWLEDGEMENTS
vi
TABLE OF CONTENTS
Page
LIST OF TABLES ...x
LIST OF FIGURES... xii
LIST OF ABBREVIATIONS AND SYMBOLS ...xv
CHAPTER 1: INTRODUCTION ...1
1.1 BACKGROUND ...1
1.1.1 Chemical Characteristics of NOM ...2
1.1.2 Removal of NOM by Anion Exchange ...5
1.1.3 Magnetic Ion Exchange Treatment ...8
1.2 RESEARCH OBJECTIVES...10
1.3 ORGANIZATION OF DISSERTATION...11
CHAPTER 2: STOICHIOMETRY OF REMOVAL OF NATURAL ORGANIC MATTER BY ION EXCHANGE...14
2.1 ABSTRACT...14
2.2 INTRODUCTION...15
2.3 EXPERIMENTAL SECTION...17
2.3.1 Model Waters...17
2.3.2 Ion Exchange Resins ...19
2.3.3 Ion Exchange Isotherm Experiments ...20
2.4 RESULTS AND DISCUSSION ...21
2.4.1 Ion Exchange Stoichiometry...21
2.4.2 Impact of Resin Structure...27
2.4.3 Isotherms and Separation Factors ...30
CHAPTER 3: REMOVAL OF DISSOLVED ORGANIC MATTER BY ANION EXCHANGE: EFFECT OF DISSOLVED ORGANIC MATTER PROPERTIES...33
3.1 ABSTRACT...33
3.2 INTRODUCTION...33
3.3 MATERIALS AND METHODS...35
3.3.1 DOM Isolates ...35
3.3.2 Model Waters...38
3.3.3 MIEX Resin ...40
3.3.4 Anion Exchange Isotherm Experiments...40
3.4 RESULTS AND DISCUSSION ...41
3.4.1 Characteristics of DOM Isolates ...41
3.4.2 Stoichiometry of Anion Exchange ...42
3.4.3 Effect of Inter-DOM Properties ...45
3.4.4 Effect of Intra-DOM Properties ...50
CHAPTER 4: A PILOT-SCALE EVALUATION OF MAGNETIC ION EXCHANGE TREATMENT FOR REMOVAL OF NATURAL ORGANIC MATERIAL AND INORGANIC ANIONS ...54
4.1 ABSTRACT...54
4.2 NOMENCLATURE...55
4.3 INTRODUCTION...55
viii
4.4.1 Pilot Plant Description and Operation...59
4.4.2 Additional Experiments...63
4.4.3 Analytical Methods ...63
4.5 RESULTS AND DISCUSSION ...64
4.5.1 Raw Water Characteristics ...64
4.5.2 Continuous-Flow Pilot-Scale Testing ...67
4.5.3 Batch Experiments ...75
4.5.4 Regeneration ...77
4.5.5 Unifying Considerations...79
4.6 CONCLUSIONS...82
CHAPTER 5: MODELING THE REMOVAL OF DISSOLVED ORGANIC CARBON BY ION EXCHANGE IN A COMPLETELY MIXED FLOW REACTOR...84
5.1 ABSTRACT...84
5.2 NOMENCLATURE...84
5.3 INTRODUCTION...86
5.4 MATERIALS AND METHODS...88
5.4.1 Experimental Procedures...88
5.4.2 Model Formulation...90
5.5 RESULTS AND DISCUSSION ...99
5.5.1 Estimation of Equilibrium and Kinetic Parameters ...99
5.5.2 Model Verification ...104
5.6 CONCLUSIONS...110
6.1 ABSTRACT...111
6.2 NOMENCLATURE...112
6.3 INTRODUCTION...113
6.4 MODEL DEVELOPMENT...114
6.4.1 Model Formulation...114
6.4.2 Dimensional Analysis...118
6.4.3 Steady-State Analysis...120
6.4.4 First-Order Model of the Residence Time Distribution ...121
6.4.5 Numerical Methods ...122
6.5 RESULTS AND DISCUSSION ...125
6.5.1 Effect of Dimensionless Groupings on Process Performance ...125
6.5.2 Nonlinear Regression Analysis...130
6.5.3 Model Application to MIEX Treatment ...132
6.6 CONCLUSIONS...139
CHAPTER 7: CONCLUSIONS ...140
7.1 CONCLUSIONS...140
7.2 IMPLICATIONS OF FINDINGS...142
APPENDIX A: SUPPORTING INFORMATION FOR CHAPTER 2...146
APPENDIX B: SUPPORTING INFORMATION FOR CHAPTER 3...148
x
LIST OF TABLES
Page
TABLE 2.1 Composition of Model Waters...18
TABLE 2.2 Properties of Ion Exchange Resins ...20
TABLE 3.1 Chemical Properties of DOM Isolatesa...37
TABLE 3.2 Composition of Model Waters Used in Anion Exchange Isotherm Experiments with MIEX Resin...39
TABLE 3.3 Multiple Linear Regression Between DOC Removal at Resin/C0 = 1 and DOM Chemical Propertiesa (Correlation Equation: DOC Removal = ax1 + bx2 + c) ...50
TABLE 4.1 Illustrative Pilot Plant Data...59
TABLE 4.2 Pilot Plant Test Plan ...62
TABLE 4.3 Raw Water Quality During Pilot Plant Study...66
TABLE 4.4 Impact of Resin Regeneration Ratio and Steady-State Resin Concentration on Removal of DOC and UV Absorbance...70
TABLE 4.5 Impact of Resin Regeneration Ratio, Resin Concentration, and Elevated Levels of Bromide and Chloride on Removal of DOC, UV Absorbance, and Bromide...74
TABLE 4.6 Impact of Resin Regeneration Ratio, Resin Concentration, and Elevated Levels of Sulfate on Removal of DOC, UV Absorbance, Bromide, and Sulfate...74
TABLE 5.1 Operating Conditions for NBA Pilot Plant Study (see Mercer et al., 2004)...89
TABLE 5.2 Operating Conditions for Durham Pilot Plant Study (see Boyer and Singer, 2006)...89
TABLE 5.3 Physical Properties of MIEX Resin (Provided by Orica Watercare)...102
TABLE 5.4 Illustrative Raw Water Quality Characteristics ...102
TABLE 5.5 Estimated Diffusion Coefficients...102
TABLE 6.1 Summary of Dimensionless Groups...120
TABLE 6.3 Regression Model Parameters ...131
TABLE 6.4 DOC Characteristics of Selected Raw Drinking Waters (after Boyer et al., 2008)...136
TABLE 6.5 Summary of Typical Process Operating Conditions for Different Reactor Configurations...136
TABLE 6.6 Process Operating Conditions to Achieve 50% DOC Removal by MIEX Resin...138
TABLE 6.7 Summary of Process Operating Parameters for Different Degrees of DOC Removal for Durham...139
TABLE A1 Results for WA-MIEX Ion Exchange Experiment using SRFA I Model Water………..146
TABLE A2 Fractional Uptake of DOC……….146
TABLE A3 Impact of Resin Structure on Removal of DOC and Bicarbonate………….146
TABLE B1 Sources of Aquatic DOM Isolates Used to Study Anion Exchange Uptake by MIEX Resin………...……...…150
TABLE B2 13C NMR Data (% C) for DOM Isolates………....151
TABLE B3 Elemental Composition of DOM Isolates………..152
xii
LIST OF FIGURES
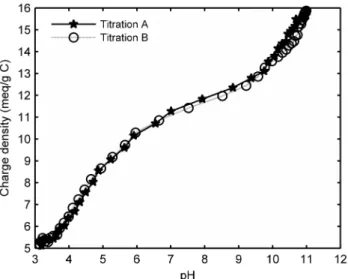
Page FIGURE 2.1 Charge density of SRFA resulting from direct potentiometric titration...25 FIGURE 2.2 Illustrative ion exchange stoichiometry for MIEX resin. Corresponding
model waters are as follows: Control I and II (HCO3–/Cl–), SRFA I and
II (DOC/HCO3–/Cl–), and SRFA III (DOC/Cl–). ...26
FIGURE 2.3 Illustrative ion exchange stoichiometry for five anion exchange resins. Solid symbols represent bicarbonate-chloride exchange (Control I model water); open symbols represent DOC-bicarbonate-chloride
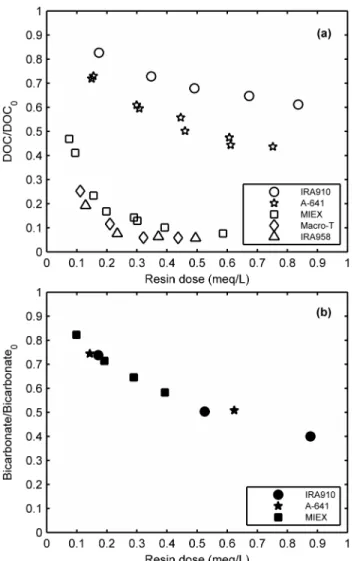
exchange (SRFA I model water)...26 FIGURE 2.4 Impact of resin structure on (a) DOC removal (SRFA I model water)
and (b) bicarbonate removal (Control I model water). All concentrations are normalized by their respective initial model water concentration. ...30 FIGURE 2.5 Illustrative ion exchange isotherms for MIEX resin. Open circles show
DOC isotherm in the presence of bicarbonate and chloride (SRFA I); solid circles show DOC isotherm in the presence of only chloride (SRFA III); and solid triangles show bicarbonate isotherm in the
presence of chloride (no DOC, Control I). ...32 FIGURE 3.1 Charge density of DOM isolates calculated from direct potentiometric
titration results. ...42 FIGURE 3.2 Anion exchange stoichiometry for MIEX resin with different DOM
isolates: (a) exchange of chloride for bicarbonate and (b) exchange of
chloride for bicarbonate and DOC together...44 FIGURE 3.3 Removal of DOC by MIEX resin for a variety of DOM isolates. The
units of resin dose and initial DOC concentration (C0) are meq/L. ...48
FIGURE 3.4 Association between DON and DOC removal by MIEX resin treatment...49 FIGURE 3.5 Anion exchange isotherms for various dissolved constituents. The
average composition (± one standard deviation) of the test waters was xi = 0.19 ± 0.02, xbicarbonate = 0.78 ± 0.02, and xchloride = 0.03 ± 0.01, where i
is DOC, sulfate, bromide, or nitrate. ...49 FIGURE 3.6 Influence of pH on the stoichiometric removal of SRFA by MIEX resin;
the y = x line indicates equivalent exchange of chloride for DOC,
FIGURE 4.1 Illustrative example of batch-testing results using MIEX resin for various raw waters. Data from Singer and Bilyk, 2002; Boyer and
Singer, 2005...58 FIGURE 4.2 Schematic of MIEX pilot plant. ...61 FIGURE 4.3 Impact of resin regeneration ratio on the removal of DOC (15 mL/L
MIEX resin). ...71 FIGURE 4.4 Size exclusion chromatography results for selected raw water and
effluent samples. ...71 FIGURE 4.5 Impact of coagulation with alum on settled water turbidity. ...76 FIGURE 4.6 Illustration of reduction in chlorine demand for MIEX-treated effluents
compared to raw waters...76 FIGURE 4.7 Illustration of mass balance between DOC removed by pilot plant and
DOC recovered during regeneration. ...79 FIGURE 4.8 Impact of effective resin dose on fractional degree of resin saturation;
comparison of batch equilibrium and continuous-flow pilot plant data...82 FIGURE 5.1 Continuous-flow process schematic...87 FIGURE 5.2 MIEX resin particle size data (provided by Orica Watercare). ...97 FIGURE 5.3 Illustrative agreement between numerical methods and analytical
solutions: (a) intraparticle concentration profile in a single spherical porous particle and (b) fractional uptake of solute by spherical porous
particles in a batch reactor. ...99 FIGURE 5.4 Illustrative linear equilibrium isotherms. ...103 FIGURE 5.5 Kinetics of DOC uptake by MIEX resin (MIEX resin dose: SL I = 1
mL/L, SL II = 4 mL/L, and NBA = 2 mL/L)...103 FIGURE 5.6 Illustrative model simulation for NBA water: (a) time-varying, total
concentration of DOC and (b) age distribution of resin particles in the
contactor. ...106 FIGURE 5.7 North Bay Aqueduct: comparison of steady-state model predictions and
observed pilot plant data for various operating conditions (see Table
5.1)...107 FIGURE 5.8 Continuous-flow model fit to Durham pilot plant data. ...109 FIGURE 5.9 Durham: model predictions versus observed pilot plant data for various
xiv
FIGURE 6.1 Agreement between analytical solution and Monte Carlo model. ...124 FIGURE 6.2 Agreement between first-order RTD model (solid lines) and Monte
Carlo model (open circles)...125 FIGURE 6.3 Influence of the inverse of the resin regeneration ratio on steady-state
process performance...128 FIGURE 6.4 Influence of the macroscale mass transfer modulus on steady-state
process performance...129 FIGURE 6.5 Influence of resin size variability on steady-state process performance. ...129 FIGURE 6.6 Influence of the microscale mass transfer modulus on steady-state
process performance...130 FIGURE 6.7 Agreement between regression model and simulation data. ...132 FIGURE 6.8 Fraction of DOC removed by MIEX resin as a function of the effective
resin dose and solids residence time for (a) Sweetwater Lake, (b) North
Bay Aqueduct, and (c) Durham waters. ...137 FIGURE 6.9 Isopleths illustrating combinations of effective resin dose and solids
residence time needed to achieve 50% removal of DOC by MIEX resin. ....138 FIGURE A1 Impact of resin structure on treated water SUVA254; Figure 2.4a shows
corresponding DOC removal. Solid symbols show polystyrene resins (A-641 and IRA910); open symbols show polyacrylic resins (MIEX, Macro-T, and IRA958). All SUVA254 values are normalized by initial
SUVA254 of SRFA I model water (SUVA254,0 = 4.0 L/mg·m)...147
FIGURE A2 Separation factors as a function of resin loading; Figure 2.5 shows
corresponding binary isotherm results………...……147 FIGURE B1 Box and whisker plots illustrating the relative difference (RD) between
chloride release from MIEX resin and DOC plus bicarbonate uptake for different types of DOM. N is the number of data points. The horizontal bar within the box indicates the median value; the upper and lower boundaries of the box indicate the upper and lower quartile (i.e., interquartile range), respectively; the whiskers are a maximum of 1.5 times the interquartile range; outlier values are indicated by a plus
LIST OF ABBREVIATIONS AND SYMBOLS
CNOM concentration of natural organic matter
CT total aqueous concentration of dissolved organic carbon, bicarbonate, and chloride
C0 initial dissolved organic carbon concentration CCFA Coal Creek fulvic acid
CMFR completely mixed flow reactor CV coefficient of variation
DBP disinfection byproduct
DIC dissolved inorganic carbon DOC dissolved organic carbon
DOC0 dissolved organic carbon, initial DOM dissolved organic matter
DON dissolved organic nitrogen
DON0 dissolved organic nitrogen, initial EF1FA Florida Everglades Site F1 fulvic acid
EF1HPOA Florida Everglades Site F1 hydrophobic acid EF1TPIA Florida Everglades Site F1 transphilic acid ERD effective resin dose
FA fulvic acid
FtLHPOA Fort Lauderdale hydrophobic acid FtLTPIA Fort Lauderdale transphilic acid
HAA haloacetic acid
HPOA hydrophobic acid
xvi HRT hydraulic residence time
IHSS International Humic Substances Society LGW laboratory grade water
Mn number-average molecular weight meq milliequivalents MIEX magnetic ion exchange
NBA North Bay Aqueduct
N/C molar ratio of nitrogen to carbon
NMR nuclear magnetic resonance NOM natural organic matter
ODE ordinary differential equation PDF probability density function PLFA Pony Lake fulvic acid POFA Pacific Ocean fulvic acid
resin/C0 ratio of MIEX resin dose to initial dissolved organic carbon concentration
RD relative difference between chloride release and dissolved organic carbon plus bicarbonate uptake
RTD residence time distribution SEC size exclusion chromatography
SL Sweetwater Lake
SRFA Suwannee River fulvic acid
SRT solids residence time
SUVA specific ultraviolet absorbance
SUVA254 specific ultraviolet absorbance at 254 nm
SUVA280 specific ultraviolet absorbance at 280 nm TDN total dissolved nitrogen
THM trihalomethane TOC total organic carbon
TPIA transphilic acid
US United States
USGS U.S. Geological Survey
UV ultraviolet absorbance
UV254 ultraviolet absorbance at 254 nm
WA-MIEX weak-acid MIEX
WLHPOA Williams Lake hydrophobic acid
x equivalent ionic fraction in solution
y equivalent ionic fraction in resin
CHAPTER 1: INTRODUCTION
1.1 BACKGROUND
Natural organic matter (NOM), a ubiquitous component of natural waters, is of concern because it adversely impacts water treatment processes. For example, NOM imparts taste, odor, and color to raw drinking water (Thurman, 1985), increases chemical requirements for oxidation, coagulation, and disinfection (Babcock and Singer, 1979; White et al., 1997), reacts with chlorine to form halogenated organic disinfection byproducts (DBPs), such as trihalomethanes (THMs), haloacetic acids (HAAs), haloacetonitriles, haloketones, haloaldehydes, and halogenated furanones (Christman et al., 1983; Krasner et al., 1989; Krasner et al., 2006), fouls membranes (Lee et al., 2004; Yamamura et al., 2007), promotes biological growth in water distribution systems (Escobar et al., 2001), and facilitates the transport of heavy metals and hydrophobic organic chemicals through natural and engineered environments (Chin et al., 1997; Waples et al., 2005).
1.1.1 Chemical Characteristics of NOM
NOM is a general term used to describe the complex mixture of predominantly acidic, variable molecular weight, aromatic and aliphatic organic molecules found throughout aquatic and terrestrial environments. This discussion will focus on aquatic NOM due to its impact on drinking water treatment. Leenheer and Croue (2003) and Abbt-Braun et al. (2004) provide a comprehensive review of aquatic NOM. The chemical characteristics of aquatic NOM are directly influenced by the origin of the organic precursor material (see Thurman, 1985; Krasner et al., 1996; and McKnight and Aiken, 1998). Aquatic NOM is derived from both the breakdown of terrestrial plants and as the byproduct of bacteria, algae, and aquatic plants. Furthermore, an end-member environment is defined as a water body that contains only terrestrially- or microbially-derived organic matter. The Suwannee River in southern Georgia is an example of a terrestrial end-member environment. Suwannee River NOM is characterized by high aromatic carbon content and is of predominantly lignin origin (Leenheer, 1994). Conversely, Pony Lake in Antarctica is an example of a microbial end-member environment. Microbially-derived NOM, such as NOM from Pony Lake, has a higher content of aliphatic carbon and more organic nitrogen than terrestrially-derived NOM, which is attributable to carbohydrate, protein, and lipid precursor materials (Leenheer, 1994; McKnight et al., 1994).
3
(Leenheer, 1981; Thurman and Malcolm, 1981; Aiken et al., 1992; Leenheer et al., 2004). The hydrophobic acid fraction is the operational definition given to aquatic humic substances that are retained on XAD-8 resin, i.e., humic and fulvic acids. Hydrophobic acids typically account for >50% by mass of aquatic NOM in temperate freshwaters (Thurman, 1985). The remaining fraction of aquatic NOM is known as non-humic or polar NOM, and is fractionated into transphilic and hydrophilic fractions using XAD-4 resin. Aiken et al. (1992) showed that the transphilic fraction of NOM had greater amounts of carboxyl and aliphatic carbon and a lesser amount of aromatic carbon compared with the hydrophobic acid fraction. Total organic carbon (TOC), dissolved organic carbon (DOC), ultraviolet (UV) absorbance at 254 nm (UV254), and specific UV absorbance (SUVA) are several methods that
are commonly used to characterize both whole water samples of NOM and NOM isolates. DOC is defined as the organic carbon concentration of a sample filtered through a 0.45 µm pore diameter filter. The DOC concentration is equal to >90% of the TOC concentration for most natural waters (Thurman, 1985). UV254 is directly proportional to the concentration of
aromatic and unsaturated carbon within NOM, and has been shown to be a useful surrogate for the concentrations of DOC and THM precursors in raw drinking water (Edzwald et al., 1985). SUVA is defined as the ratio of UV absorbance at a specific wavelength (typically 254 or 280 nm, i.e., SUVA254 or SUVA280, respectively) to the DOC concentration, and is
reported to be strongly correlated with the aromatic carbon content of NOM, the molecular weight of NOM, and the formation of THMs and HAAs (Reckhow et al., 1990; Chin et al., 1994; Kitis et al., 2002; Weishaar et al., 2003). Furthermore, SUVA254 has been shown to be
inversely correlated with the alkalinity of raw drinking water, i.e., SUVA254 decreases as
and ion exchange, have been shown to be more effective in raw waters with a SUVA254 >3
L/mg·m (Singer and Bilyk, 2002; Boyer and Singer, 2005; Archer and Singer, 2006b). Carboxyl and phenolic groups are the two dominant classes of acidic functional groups within NOM. Over the pH range of natural waters, the acidity of NOM is approximately equal to its carboxyl content. These negatively charged carboxyl groups allow NOM molecules to take part in anion exchange reactions, as discussed below. The acidity of NOM is typically determined by direct potentiometric titration (Perdue et al., 1980; Ritchie and Perdue, 2003; Lin et al., 2005). Ritchie and Perdue (2003) measured the acidity of 14 NOM samples obtained from the International Humic Substances Society (IHSS) and reported the following order of carboxyl acidity: terrestrial fulvic acid > aquatic fulvic acid > Suwannee River NOM > aquatic humic acids > terrestrial humic acids. This trend illustrates that carboxyl acidity is inversely proportional to molecular weight and aromaticity because fulvic acids generally have lower molecular weight and lower aromatic carbon content than humic acids (Ravichandran et al., 1998).
5 1.1.2 Removal of NOM by Anion Exchange
The removal of NOM by anion exchange resins has been studied extensively (e.g., Anderson and Maier, 1979; Rook and Evans, 1979; Boening et al., 1980; Brattebo et al., 1987; Fu and Symons, 1990; Kim and Symons, 1991; Croue et al., 1999a; Fettig, 1999; Hongve et al., 1999; Bolto et al., 2002a; Bolto et al., 2002b; Humbert et al., 2005; Humbert et al., 2007; Tan and Kilduff, 2007; Cornelissen et al., 2008). Nevertheless, anion exchange treatment would benefit from a comprehensive understanding of the interactions between NOM, raw water characteristics, anion exchange resins, and process operating conditions. Therefore, a brief overview of anion exchange treatment is provided to place this dissertation research into the context of previous work.
The effectiveness of anion exchange treatment for the removal of NOM is influenced by the selectivity of anion exchange resins for NOM and the configuration of the treatment process. Resin properties, NOM characteristics, and competing inorganic anions have been previously shown to influence the affinity of anion exchange resins for NOM (Fu and Symons, 1990; Croue et al., 1999a; Bolto et al., 2002a). The configuration of the anion exchange treatment process is discussed in the subsequent section.
macroporous resins consist of a porous solid phase with a connected set of liquid filled pores (Li and SenGupta, 2000). The classification of an anion exchange resin as either a weak- or strong-base resin is determined by the nature of the amine function group, which determines the effective pH range of the resin. Weak-base resins contain primary, secondary, or tertiary amine functional groups and are most effective under acidic conditions where they tend to be protonated. Strong-base resins typically have quaternary amine functional groups and are protonated over a wide range of acidic and basic pH values (Helfferich, 1995). Most strong-base anion exchange resins are used in the chloride form, i.e., the chloride ion is the counter-ion to the positively charged amine functcounter-ional group. Thus, polymer compositcounter-ion, pore structure, and basicity of the resin will influence the selectivity of anion exchange resins for NOM.
Strong-base anion exchange resins have a greater ion exchange capacity than weak-base resins at the pH of natural waters. As a result, strong-weak-base resins remove more NOM than weak-base resins (Anderson and Maier, 1979; Cornelissen et al., 2008). Accordingly, the remaining discussion will focus on strong-base anion exchange resins. In general, macroporous polyacrylic anion exchange resins have been shown to remove more NOM than other types of anion exchange resins (Fu and Symons, 1990; Bolto et al., 2002a). The effective removal of NOM by macroporous polyacrylic resins is attributed to their high water content and open structure. In addition, poor removal of NOM by gel-type polystyrene resins is believed to be due to size exclusion of NOM by the resin (Fu and Symons, 1990; Croue et al., 1999a; Tan and Kilduff, 2007).
7
exchange treatment to other physical-chemical treatment processes, and to investigate competition between NOM and inorganic anions. Whole water samples of NOM allow for a specific water source to be studied in detail, whereas synthetic model waters allow for individual NOM properties to be examined under controlled solution conditions. The mechanism of removal of NOM by anion exchange resins, i.e., ion exchange versus adsorption, influences all aspects of anion exchange treatment, yet the mode of removal is inconclusive based on the published literature. For example, using synthetic model waters, Fu and Symons (1990) presented evidence that ion exchange was the dominant mechanism of removal. However, similar work by Croue et al. (1999a) suggested that a combination of ion exchange and adsorption was responsible for removal of NOM. In addition, Cornelissen et al. (2008) reported that a substantial portion of the neutral fraction of NOM was removed by adsorption.
The preference of anion exchange resins for various fractions of NOM is also inconclusive. For example, several researchers have reported that anion exchange resins have the strongest affinity for high charge density, hydrophilic NOM (Anderson and Maier, 1979; Croue et al., 1999a; Bolto et al., 2002a), while others have observed greater removal of UV-absorbing, aromatic NOM (Humbert et al., 2005; Cornelissen et al., 2008). In addition, Tan and Kilduff (2007) reported that anion exchange resins preferentially removed NOM with a molecular weight of ~1000 Da to the exclusion of both higher and lower molecular weight fractions.
the NOM influence the effectiveness of the two treatment processes. For example, coagulation preferentially removes high molecular weight, low charge density, hydrophobic NOM (Collins et al., 1986; Liang and Singer, 2003), while anion exchange resins have been shown to remove a variety of NOM fractions with the exception of particulate NOM (Boyer and Singer, 2005; Singer et al., 2007). As a result, the combination of anion exchange pre-treatment followed by coagulation has been shown to be a very effective process for removing NOM. For example, a substantial reduction in membrane fouling has been reported due to the removal of a wide range of molecular weight, acidic, and hydrophobic/hydrophilic fractions of NOM (Humbert et al., 2007).
Finally, the anionic composition of a water affects the removal of NOM by anion exchange resins. In particular, sulfate has been reported to compete with NOM for ion exchange sites, thereby adversely affecting removal of NOM (Anderson and Maier, 1979; Fu and Symons, 1990; Tan and Kilduff, 2007). Anion exchange resins typically have a greater preference for NOM over chloride and bicarbonate (Anderson and Maier, 1979). The competition between NOM and other inorganic anions, such as bromide and nitrate, has been investigated to a limited extent (Humbert et al., 2005).
1.1.3 Magnetic Ion Exchange Treatment
9
(MIEX) resin that is designed to be used in a slurry form in a CMFR has been the recent focus of anion exchange treatment research. MIEX resin was designed specifically to remove NOM from raw drinking water and was developed jointly by Orica Watercare of Victoria Australia, the Australian Commonwealth Scientific Industrial Research Organization, and the South Australian Water Corporation. MIEX resin is a strong-base anion exchange resin with a macroporous, polyacrylic structure in the chloride form. Magnetic iron oxide is incorporated into the resin structure to aid in settling. Batch treatment studies have shown that MIEX resin removes greater amounts of DOC and UV254-absorbing substances than
coagulation; MIEX resin removes a wider range of molecular weight and organic acid fractions of NOM than coagulation; treatment with MIEX resin substantially lowers the demand for ozone and chlorine; and MIEX resin removes bromide, which reacts with chlorine and NOM to form halogenated organic DBPs (Singer and Bilyk, 2002; Drikas et al., 2003; Fearing et al., 2004; Johnson and Singer, 2004; Boyer and Singer, 2005; Humbert et al., 2005). Singer and Bilyk (2002) and Boyer and Singer (2005) showed that the removal of NOM by MIEX resin increased with increasing SUVA254 of the raw water. As mentioned
previously, high SUVA waters are characterized by the predominance of hydrophobic NOM and low ionic strength, whereas low SUVA waters tend to have more hydrophilic NOM and high ionic strength. It is uncertain whether MIEX resin removes more NOM in high SUVA waters because the NOM is more hydrophobic or because there are less competing anions, or both.
continuous-flow basis, and most of that work is from pilot plant studies. Pilot plant studies are valuable for verifying that the performance of MIEX resin scales up from batch treatment studies, but they are limited with respect to performing controlled experiments. Nevertheless, continuous-flow pilot-scale studies have shown that the removal of NOM by MIEX resin was highest in raw waters that were characterized by a high SUVA and a low sulfate concentration, and that pre-treatment with MIEX resin lowered the subsequent coagulant demand (Hammann et al., 2004; Fonseca et al., 2005; Singer et al., 2007). An advantage of pilot plant studies is that the regeneration process can be investigated. For example, Wong et al. (2002) analyzed the concentrate from the regeneration of MIEX resin and showed that MIEX resin had a high affinity for the hydrophobic acid fraction of DOC, and that MIEX resin removed a wide range of molecular weight fractions of DOC.
Full-scale treatment with MIEX resin has also been evaluated. The results of full-scale studies have shown that pre-treatment with MIEX resin followed by coagulation was very effective at removing a wide range of molecular weight fractions of DOC, and that the subsequent coagulation step required substantially lower doses of coagulant than enhanced coagulation alone (Morran et al., 2004; Allpike et al., 2005; Warton et al., 2007).
In summary, pilot-scale and full-scale continuous-flow studies have corroborated the results of batch treatment experiments, which illustrate that treatment with MIEX resin is very effective for removing NOM and reducing downstream chemical requirements.
1.2 RESEARCH OBJECTIVES
11
and test water. Consequently, bench-scale and pilot-scale studies were conducted, batch and continuous-flow experiments were used, and raw drinking waters and synthetic model waters containing NOM isolates and select inorganic anions were examined. The mathematical modeling work coupled the microscale removal of NOM by anion exchange with the macroscale continuous-flow treatment process. The objectives of this research were as follows: (1) elucidate the interactions between NOM, inorganic anions, and anion exchange resins as they relate to the removal of NOM by anion exchange; (2) evaluate anion exchange treatment on a continuous-flow pilot-scale basis and compare to batch treatment results; and (3) formulate a mathematical model to describe removal of NOM by anion exchange treatment in a CMFR and apply the model to the design of anion exchange treatment processes.
1.3 ORGANIZATION OF DISSERTATION
This dissertation contains five papers that are in various stages of preparation or publication. These papers are presented as Chapters 2 through 6. Chapter 2, published in
Chapter 3, submitted to Environmental Science & Technology in 2008, is entitled “Removal of dissolved organic matter by anion exchange: Effect of dissolved organic matter properties,” and expands upon the work in Chapter 2 by evaluating the removal of ten aquatic NOM isolates by MIEX resin. All NOM isolates were clearly removed by ion exchange. However, differences in the chemical properties of the NOM isolates, notably their charge density and aromatic carbon content, influenced their removal by MIEX resin. Supporting Information for Chapter 3 is presented in Appendix B. Chapter 3 is currently under review.
Chapter 4, published in Water Research in 2006, is entitled “A pilot-scale evaluation of magnetic ion exchange treatment for removal of natural organic material and inorganic anions,” and describes the results of an eight-month pilot-plant study conducted at a local water treatment plant in North Carolina. The continuous-flow pilot-plant study confirmed the results of previous bench-scale batch experiments that showed that MIEX resin effectively removes NOM from raw drinking waters, and defined the process operating conditions that influence performance.
Chapter 5, published in Water Research in 2008, is entitled “Modeling the removal of dissolved organic carbon by ion exchange in a completely mixed flow reactor,” and presents the formulation and verification of a mathematical model that was developed based upon insights gained from the pilot plant study. Model predictions were found to be in good agreement with the results of two continuous-flow pilot plant studies.
13
on the removal of NOM by anion exchange treatment. Chapter 6 is a draft manuscript planned for submission to Water Research.
CHAPTER 2: STOICHIOMETRY OF REMOVAL OF NATURAL ORGANIC MATTER BY ION EXCHANGE1
2.1 ABSTRACT
Five anion exchange resins, including a magnetic ion exchange (MIEX) resin, were evaluated for removal of Suwannee River fulvic acid (SRFA) in the presence of bicarbonate and chloride. The charge density of SRFA, obtained by potentiometric titration, was used to perform charge balances for ion exchange reactions involving SRFA, bicarbonate, and chloride under different solution conditions. The results clearly show the equivalence of SRFA uptake and chloride release by ion exchange. Although the structure of the anion exchange resins did not affect the stoichiometry of the reaction, the polyacrylic resins did exhibit greater removal of SRFA than the polystyrene resins. The hindered removal of SRFA by the polystyrene resins was hypothesized to be a result of size exclusion. The MIEX resin, which has a polyacrylic structure, performed similarly to the other polyacrylic resins. For the MIEX resin, the separation factor for SRFA over chloride was ~8 times greater than for bicarbonate over chloride. This work provides an improved understanding of the interactions between natural organic matter (NOM), inorganic anions, and anion exchange resins, and should result in more effective applications of ion exchange for the removal of NOM in the treatment of drinking water.
1
15 2.2 INTRODUCTION
The composition of most resins is either polystyrene or polyacrylic. Polystyrene resins are more hydrophobic than polyacrylic resins; as a result, polyacrylic resins tend to have a more open structure and higher water content. The porosity of resins is defined as either macroporous or gel. Macroporous resins are highly porous solids, while gel resins do not contain any pores (Fu and Symons, 1990). Strong-base resins typically contain either Type I (–N+(CH3)3) or Type II (–N+(CH3)2(C2H4OH)) quaternary ammonium functional groups. Due
to their ethanolic content, Type II resins are more hydrophilic than Type I resins (Gregory and Dhond, 1972). Most strong-base anion exchange resins are used in the chloride form.
17
Accordingly, the objective of this research was to elucidate the interactions between NOM, inorganic anions, and anion exchange resins. The ternary ion exchange reaction of interest was the exchange of NOM and bicarbonate for chloride. The specific aims of this work were to quantify the contributions of ion exchange and adsorption to DOC removal and to examine the impact of resin structure on DOC uptake. Based upon previous work, the initial hypothesis was that DOC is removed by ion exchange.
2.3 EXPERIMENTAL SECTION 2.3.1 Model Waters
nitrogen atmosphere. The NaOH solution was added in 0.1 mL increments; the pH was recorded after each addition of titrant. All samples were titrated up to approximately pH 11. The charge density of SRFA was calculated based on the pH measurements and a charge balance of the solution as follows:
NOM
] OH [ ] Na [ ] H [ C) (meq/g density Charge
C
− +
+ + −
= , (2.1)
where the concentrations of H+, Na+, and OH– are in milliequivalents per liter and CNOM is
the NOM concentration of the solution (g C/L) (Lin et al., 2005). Potassium and chloride were not included in the charge balance since they were opposite in charge and equal in concentration.
TABLE 2.1 Composition of Model Waters Model water pH DOC
(mg C/L)
DOC (meq/L)
Bicarbonate (meq/L)
Chloride (meq/L)
CTa
(meq/L) SRFA I 7.70–7.83 9.2–9.9 0.11–0.12 0.43–0.45 0.009–0.038 0.56–0.61
SRFA II 7.49 9.7 0.11 0.43 0.12 0.67
SRFA III 6.56 11.0 0.12 0 0.097 0.21
Control I 7.88–8.04 0 0 0.47–0.48 0.008–0.016 0.48–0.49
Control II 7.50 0 0 0.45 0.092 0.54
aC
19 2.3.2 Ion Exchange Resins
TABLE 2.2 Properties of Ion Exchange Resins
Resin Structurea Capacityb (meq/mL) Water contentb (% (m/m))
IRA910 Polystyrene, Type II 1.0 (≥ 1.0) 43 ± 6 (54–61) A-641 Polystyrene, Type I 0.93 ± 0.02 (1.0) 58 ± 2 (56–64) MIEX Polyacrylic, Type I 0.52 ± 0.02 65 ± 1
Macro-T Polyacrylic, Type I 0.65 ± 0.01 (0.85) 68 ± 1 (66–72) IRA958 Polyacrylic, Type I 0.86 ± 0.02 (≥ 0.8) 69 ± 1 (66–72)
a Macroporous, chloride-form. b Average ± one standard deviation (manufacturer’s data).
2.3.3 Ion Exchange Isotherm Experiments
21
dividing the resin-phase concentration of DOC by the dose of ion exchange resin. Equivalent ionic fractions for bicarbonate and chloride were calculated in the same manner.
2.3.4 Analytical Methods
An Accumet AB15 pH meter with a calomel combination pH electrode was used to measure pH. Ultraviolet (UV) absorbance was measured on either a Hitachi 2000 or U-3300 spectrophotometer using a 1 cm quartz cell. DOC and dissolved inorganic carbon (DIC) were measured on a Shimadzu TOC-VCPH Total Organic Carbon Analyzer. All DOC and
DIC samples were measured in duplicate with average values reported; the relative difference (defined as the absolute difference divided by the mean) between DOC and DIC duplicates was <10% and <5%, respectively. The bicarbonate concentration was calculated by correcting the DIC concentration for temperature and pH (Stumm and Morgan, 1996). Chloride was measured according to U.S. Environmental Protection Agency Method 300.0 (1999) on a Dionex DX-300 Series Ion Chromatograph equipped with an IonPac AG4A-SC guard column and an AS4A-SC analytical column. The relative difference between chloride duplicates was <10%.
2.4 RESULTS AND DISCUSSION 2.4.1 Ion Exchange Stoichiometry
(2003) reported a carboxyl acidity of 12.2 meq/g C for SRFA). The charge density of SRFA was used to calculate the DOC concentration on an equivalent charge basis and to quantitatively examine the hypothesis that DOC was removed via ion exchange.
The ion exchange reaction of interest is the equilibration of an anion exchange resin in the chloride form with a solution containing DOC, bicarbonate, and chloride. The charge balance equation for this reaction is written as follows:
− − −
− −
−
− +DOC+HCO +Cl =DOC+HCO +Cl +DOC+HCO +Cl
Cl 3 3 3 , (2.2)
23
bicarbonate concentration was adjusted based on the measured DIC concentration and pH. The variations in pH did not affect the capacity of the ion exchange resins since all resins had strong-base functional groups. The legend in Figure 2.2 indicates the chemical species taking part in the ion exchange reaction, e.g., HCO3–/Cl– indicates bicarbonate-chloride exchange.
The y = x line in Figure 2.2 represents the stoichiometric exchange of chloride on the resin for bicarbonate and DOC in the solution. The bicarbonate-chloride exchange experiments in the absence of DOC were conducted as a control since it was expected that bicarbonate would be removed exclusively via ion exchange. Figure 2.2 shows that all of the data points for HCO3–/Cl– are clustered about the y = x line and verifies that bicarbonate was indeed
removed via ion exchange; the relative difference between chloride release and bicarbonate uptake was <18%. Of particular interest, are the data points for the DOC/HCO3–/Cl–
experiments and the DOC/Cl– experiments. For both systems, the points are also tightly
clustered about the y = x line; the relative difference between chloride release and DOC/bicarbonate uptake was <15%. The results of the DOC exchange experiments mirrored the results of the control experiments and clearly show that, at approximately pH 8, SRFA was removed entirely by ion exchange. The range of DOC removal observed in these experiments was ~5–9 mg C/L (0.06–0.1 meq/L); bicarbonate removal was ~0.01–0.2 meq/L, indicating that the changes in DOC were comparable to those of bicarbonate.
result, any removal of DOC could only occur by adsorption. After two days of mixing, no DOC or bicarbonate removal by WA-MIEX was observed (see Table A1 in Appendix A). These results confirm the results illustrated in Figure 2.2 that removal of SRFA occurred exclusively via ion exchange.
Additional ion exchange experiments were conducted with the other resins using SRFA I and Control I model waters. Figure 2.3 shows the results of these experiments in an analogous fashion to Figure 2.2. As discussed above, the DOC and bicarbonate concentrations were adjusted based on the equilibrium pH. For duplicate samples, both the mean increase in chloride and the mean decrease in bicarbonate and DOC had a CV of <14%. The ion exchange resins are identified in the legend; solid symbols represent bicarbonate-chloride exchange in the NOM-free (control) solution, while open symbols represent DOC-bicarbonate-chloride exchange. As expected, the bicarbonate-chloride exchange data for IRA910 and A-641 illustrate equivalent exchange of chloride for bicarbonate; the relative difference between chloride release and bicarbonate uptake was <6%. All of the data for the DOC-bicarbonate-chloride system in Figure 2.3 are tightly clustered about the y = x line (the relative difference between chloride release and DOC/bicarbonate uptake was <11%), and illustrate the stoichiometric exchange of DOC and bicarbonate for chloride. Both the polystyrene resins (IRA910 and A-641) and the polyacrylic resins (MIEX, Macro-T, and IRA958) exhibited the same ion exchange stoichiometry.
25
DOC removals for the data in Figure 2.3. The range of fractional DOC uptakes for the polystyrene and polyacrylic resins were 0.14–0.29 and 0.33–0.84, respectively. (The finding that the polyacrylic resins have a higher fractional uptake of DOC than the polystyrene resins will be discussed in the next section.) The data in Table A2 indicates that DOC uptake accounted for a substantial fraction of the material balance, and that the ion exchange stoichiometry shown in Figures 2.2 and 2.3 required DOC removal for closure. The results in this section quantitatively confirm the stoichiometric removal of SRFA by ion exchange.
FIGURE 2.2 Illustrative ion exchange stoichiometry for MIEX resin. Corresponding model waters are as follows: Control I and II (HCO3–/Cl–), SRFA I and II (DOC/HCO3–/Cl–), and
SRFA III (DOC/Cl–).
27 2.4.2 Impact of Resin Structure
In previous ion exchange studies, researchers often compared ion exchange resins on an equal volume or mass basis (Croue et al., 1999a; Bolto et al., 2002a; Humbert et al., 2005). Using this approach, however, it is difficult to separate the influences of resin structure (i.e., polymer composition, water content, and porosity) and ion exchange capacity on solute removal. Therefore, to compare the resins on an equivalent basis and to isolate the impact of resin structure, resin doses were converted to milliequivalents of exchange capacity per liter of solution using the apparent density and volumetric ion exchange capacity of each resin. Figures 2.4a and 2.4b show the relative concentrations of DOC and bicarbonate, respectively, as a function of resin dose. Removal of DOC was evaluated using the SRFA I model water, while removal of bicarbonate was evaluated using the Control I model water. As will be discussed in the subsequent section, the presence of bicarbonate did not adversely affect removal of DOC. For duplicate samples, resin doses had a CV of 3–14% (the variation in the resin dose was primarily due to experimental uncertainty in the apparent density), DOC removal had a CV of <12%, and bicarbonate removal had a CV of <3%.
that the polyacrylic resins exhibited greater removal of DOC and had higher water contents (65–69% versus 43–58%) than the polystyrene resins. It is often difficult, however, to distinguish between the effects of polymer composition, water content, and porosity. For example, Bolto et al. (2002a) observed a direct relationship between DOC removal and water content, without reporting the pore size of the resins, and concluded that water content, in general, was a good predictor of resin performance. Although IRA910 (Type II resin) had a lower water content than A-641 (Type I resin), it is somewhat surprising that IRA910 removed less DOC than A-641, since strong-base anion exchange resins with Type II functional groups have been previously shown to remove more NOM than would be expected based on their water content (Bolto et al., 2002a). In addition, other researchers have attributed poor removal of DOC by polystyrene resins to size exclusion (Aiken et al., 1979; Fu and Symons, 1990; Croue et al., 1999a). The specific UV absorbance (SUVA) was calculated for the data in Figure 2.4a to assess the possibility of size exclusion. SUVA254
(L/mg·m) is defined as the ratio of the UV absorbance at 254 nm (UV254 (1/cm)) to the DOC
concentration (mg C/L), and is reported to be directly correlated with the aromatic carbon content and molecular weight of NOM (Chin et al., 1994; Weishaar et al., 2003). The analysis showed that the SUVA254 of the water decreased following treatment with the
polyacrylic resins, whereas the SUVA254 increased following treatment with the polystyrene
resins (see Figure A1 in Appendix A). These findings demonstrate that the polyacrylic resins preferentially removed UV254-absorbing organic compounds, and suggest that NOM with a
29
FIGURE 2.4 Impact of resin structure on (a) DOC removal (SRFA I model water) and (b) bicarbonate removal (Control I model water). All concentrations are normalized by their respective initial model water concentration.
2.4.3 Isotherms and Separation Factors
Ion exchange isotherms for SRFA and bicarbonate on MIEX resin were compared to elucidate the SRFA-bicarbonate-chloride system. Figure 2.5 shows the equivalent ionic fraction of anion A in the resin (yA) as a function of its equivalent ionic fraction in solution
(xA). The solid circles and triangles represent binary isotherms for SRFA-chloride and
31
binary and ternary systems, the DOC concentrations were approximately equal for both systems. The diagonal line illustrates the hypothetical scenario in which MIEX resin has equal preference for both generic anion A and chloride. In addition, isotherms that fall above the diagonal illustrate favorable exchange, while isotherms that fall below the diagonal illustrate unfavorable exchange. Considering only the binary isotherms (i.e., solid symbols), Figure 2.5 shows that MIEX resin favors SRFA over chloride while, at best, the resin has approximately equal preference for bicarbonate and chloride.
Separation factors were calculated for the binary isotherms to quantify the affinity of MIEX resin for SRFA and bicarbonate. The separation factor for anion A over chloride is defined as αA/Cl = (yAxCl)/(xAyCl), where A can represent either SRFA or bicarbonate. If αA/Cl
is >1, then anion A is preferred by the resin. At yA = 0.5, the separation factors for
SRFA-chloride and bicarbonate-SRFA-chloride were 5.7 and 0.76, respectively. In addition, Figure A2 in Appendix A illustrates that the separation factors for SRFA and bicarbonate are relatively constant with respect to resin loading. To the authors’ knowledge, these are the first published separation factors for MIEX resin. Figure 2.5 shows that when the total ionic strength of the model water is increased by the addition of sodium bicarbonate, the affinity of MIEX resin for SRFA increases (see solid and open circles). Semmens and Gregory (1974) reported a similar relationship between selectivity and ionic strength for carboxylate uptake by a strong-base anion exchange resin. Thus, the removal of SRFA is not adversely affected by the presence of bicarbonate; rather, it appears to be slightly promoted.
resins. This is hypothesized to be a result of size exclusion by the polystyrene resins. In addition, MIEX resin had a greater affinity for SRFA over bicarbonate and chloride. Although not investigated as part of this research, it would be of interest to know how changes in NOM characteristics, e.g., charge density, aromaticity, and molecular weight, would affect NOM uptake via ion exchange, and how inorganic anions, such as sulfate, would compete with NOM for ion exchange sites. (This is the subject of a follow-up study.) A selectivity sequence for well-characterized NOM extracts and strongly-competing inorganic anions could potentially be developed. Such a study would further elucidate the behavior of NOM with respect to its removal by ion exchange and ultimately improve the efficacy of ion exchange treatment for removal of NOM.
CHAPTER 3: REMOVAL OF DISSOLVED ORGANIC MATTER BY ANION EXCHANGE: EFFECT OF DISSOLVED ORGANIC MATTER PROPERTIES2
3.1 ABSTRACT
Ten isolates of aquatic dissolved organic matter (DOM) were evaluated to determine the effect that chemical properties of the DOM, such as charge density, aromaticity, and molecular weight, have on DOM removal by anion exchange. The DOM isolates were characterized as terrestrial, microbial, or intermediate humic substances or transphilic acids. All anion exchange experiments were conducted using a magnetic ion exchange (MIEX) resin. The charge density of the DOM isolates, determined by direct potentiometric titration, was fundamental to quantifying the stoichiometry of the anion exchange mechanism. The results clearly show that all DOM isolates were removed by anion exchange; however, differences among the DOM isolates did influence their removal by MIEX resin. In particular, MIEX resin had the greatest affinity for DOM with high charge density and the least affinity for DOM with low charge density and low aromaticity. This work illustrates that the chemical characteristics of DOM and solution conditions must be considered when evaluating anion exchange treatment for the removal of DOM.
3.2 INTRODUCTION
Anion exchange treatment using a magnetic ion exchange (MIEX) resin has been previously shown to be very effective at removing dissolved organic matter (DOM) from raw
2
drinking waters (Fearing et al., 2004; Boyer and Singer, 2005; Humbert et al., 2005; Boyer and Singer, 2006; Singer et al., 2007). The subsequent coagulant demand, chlorine demand, and formation of trihalomethanes and haloacetic acids were all decreased as a result of the substantial removal of DOM by MIEX resin. Recent work by the authors evaluated the removal of a well-characterized aquatic DOM isolate by MIEX resin and four conventional polymeric anion exchange resins (Boyer and Singer, 2008). For the DOM isolate investigated, it was shown that anion exchange is the operative mechanism of removal of DOM by the polyacrylic and polystyrene anion exchange resins, that polyacrylic resins exhibit a greater removal of DOM than polystyrene resins, and that MIEX resin, a magnetically enhanced polyacrylic resin, performs similarly to conventional polyacrylic resins. Due to the heterogeneity of aquatic DOM, however, additional work is required to demonstrate conclusively that anion exchange is the operative mechanism of removal for an array of DOM with different properties and to determine the effect of these properties on the anion exchange process.
35
obtain DOM fractions that are chemically well-defined. In this work, DOM isolates were chosen to represent a range of chemical properties.
The goal of this research was to determine which DOM properties have the greatest influence on the removal of DOM by anion exchange. This is important for understanding fundamental interactions between DOM and anion exchange resins, and for maximizing the removal of DOM during water treatment to improve treatment outcomes. DOM properties of interest included the charge density, aromatic and aliphatic carbon content, molecular weight, and nitrogen content. The objectives of this work were to quantify the effects of inter- and intra-DOM properties on the stoichiometry of anion exchange and on the removal of DOM by MIEX resin. Inter-DOM properties were evaluated by comparing several well-characterized DOM isolates, while intra-DOM properties were evaluated by studying a single DOM isolate under different solution conditions.
3.3 MATERIALS AND METHODS 3.3.1 DOM Isolates
Ocean fulvic acid (POFA), and Williams Lake hydrophobic acid (WLHPOA) were obtained from the U.S. Geological Survey (USGS).
Chemical properties of the DOM isolates are listed in Table 3.1. Table B1 in Appendix B provides a brief description of the source of each aquatic DOM isolate. Ultraviolet (UV) absorbance was measured on a Hitachi U-2000 spectrophotometer using a 1 cm quartz cell. Dissolved organic carbon (DOC), total dissolved nitrogen (TDN), and dissolved inorganic carbon (DIC) were measured on a Shimadzu TOC-VCPH Total Organic
Carbon Analyzer with a TNM-1 Total Nitrogen Measuring Unit. All samples were analyzed in duplicate with average values reported; the relative difference (defined as the absolute difference divided by the mean) between DOC, TDN, and DIC duplicates was <10%, <20%, and <5%, respectively. The concentration of dissolved organic nitrogen (DON) was set equal to the concentration of TDN in the absence of inorganic nitrogen. Specific UV absorbance (SUVA254) was calculated by dividing the UV absorbance determined at 254 nm by the DOC
concentration.
37 TABLE 3.1 Chemical Properties of DOM Isolatesa Isolate SUVA254b
(L/mg·m)
N/Cc Carboxyl acidityd
(meq/g C)
Mne
(Da)
% aliphatic carbonf
% aromatic carbonf
CCFA 4.6 0.019 11.9 1180g 34.7h, i 28.0h, i
EF1FA 4.6 0.025 11.3 850j 43.4j, k 20.1j, k
EF1HPOA 4.7 0.021 11.2 1031j 45.0j, k 18.2j, k
EF1TPIA 3.3 0.046 14.5 832j 43.5j, k 13.1j, k
FtLHPOA 3.9 0.021 11.2 NA 44.5m, i 21.7m, i
FtLTPIA 2.1 0.037 16.7 NA 45.2m, i 9.7m, i
PLFA 3.1 0.092 10.9 ± 0.5 NA 61n, i 12n, i
POFA 0.7 0.020 10.6 532o 56.9h, i 7.3h, i
SRFA 4.0 0.011 11.8 ± 0.1 1390p 33n, i 24n, i
WLHPOA 2.1 0.025 9.7 772o 50.0o, i 13.8o, i
a Data from literature identified by superscript. b SUVA
254 (L/mg·m) = (UV254 (1/cm)/DOC
(mg C/L))×100. c Determined by measuring DOC (mg C/L) and DON (mg N/L).
d Interpolated at pH 8 using data in Figure 3.1. e Number-average molecular weight
determined by size exclusion chromatography; see references. f Percent carbon determined by
13C-NMR; aliphatic I C (0–62 ppm) and aromatic C (110–160 ppm) unless noted otherwise in
the literature. g Chin et al., 1994. h Weishaar et al., 2003. i Liquid-state 13C NMR. j
3.3.2 Model Waters
DOM-containing model waters were prepared by adding freeze-dried DOM isolates and sodium bicarbonate to laboratory-grade water (LGW). DOM-free model waters were prepared by adding potassium sulfate, sodium bromide, sodium nitrate, and sodium bicarbonate to LGW. The pH of the model waters was adjusted using either NaOH, HCl, or HNO3 solutions. A majority of the experimental work was conducted between pH 7.69 and
39 TAB LE 3 .2 C omp os it io n o f M od el W at er s U se d in A nio n E xc ha ng e I so th er m E xp er im en ts w ith M IE X R es in Sa mp le p H D O C (m g C/ L )
DON (mg N
/L ) Cha rge de ns ity a (m eq /g C)
DOC (meq
/L ) B ica rb on at e (m eq /L ) Chl ori de (m eq /L ) Su lf at e (m eq /L ) N itr at e (m eq /L ) B ro mid e (m eq /L ) CCF A 7. 69 9. 9 0. 21 11. 7 0. 12 0. 44 0. 016 – – – E F1F A 7. 76 8. 9 0. 26 11. 2 0. 10 0. 45 0. 014 – – – E F1H PO A 7. 97 8. 9 0. 22 11. 1 0. 10 0. 46 0. 017 – – – E F1T PI A 7. 70 8. 7 0. 46 14. 4 0. 124 0. 44 0. 012 – – – Ft L H P O A b 7. 89–8 .0 4 8. 7–9 .3 0. 22 11. 1–1 1. 2 0. 096– 0. 10 0. 44 0. 016– 0. 01 8 – – – Ft L T PI A b 7. 74–8 .0 5 7. 8–8 .2 0. 32–0 .3 5 16. 6–1 6. 8 0. 13–0 .14 0. 46–0 .49 0. 020– 0. 02 5 – – – PL FA 7. 79 8. 6 0. 92 10. 8 0. 093 0. 47 0. 018 – – – PO FA 7. 76 10. 5 0. 24 10. 5 0. 11 0. 47 0. 010 – – – SR FA/ pH ~ 8 b 7. 78–7 .8 3 9. 2–9 .9 0. 12 11. 65– 11. 68 0. 11–0 .12 0. 43–0 .46 0. 017– 0. 03 8 – – – SR FA /p H 4 (H Cl ) 4. 07 9. 4 N M 6. 6 0. 062 0 0. 49 – – – SR FA/ pH 4 ( H NO 3 ) 4. 02 9. 9 N M 6. 5 0. 064 0 0. 032 – 0. 53 – W L H PO A 7. 70 10. 5 0. 31 9. 6 0. 10 0. 43 0. 017 – – – B ic ar bo na te 7. 88 – – – – 0. 47 0. 011 – – – Su lf at e 7. 92 – – – – 0. 48 0. 013 0. 12 – – N itr at e 7. 78 – – – – 0. 47 0. 008 – 0. 095 – B ro m id e 7. 88 – – – – 0. 48 0. 006 – – 0. 10
a In
te rp ol at ed a t p H o f t es t w at er u si ng da ta in F ig ur e 3. 1.
b R
3.3.3 MIEX Resin
MIEX resin (Orica Watercare) is a magnetically enhanced, macroporous, polyacrylic, strong-base anion exchange resin that is used in the chloride form (Boyer and Singer, 2008). MIEX resin did not require any pre-treatment and was used as received.
3.3.4 Anion Exchange Isotherm Experiments
41 3.4 RESULTS AND DISCUSSION 3.4.1 Characteristics of DOM Isolates
The chemical characteristics of the aquatic DOM isolates evaluated in this work are a reflection of the origin of the DOM, as illustrated by the DOM properties in Table 3.1. SUVA254 is reported to be directly proportional to the number-average molecular weight (Mn)
and the aromatic carbon content of DOM (Chin et al., 1994; Weishaar et al., 2003), and the molar ratio of nitrogen to carbon (N/C) is indicative of the microbial origin of DOM (McKinght et al., 1994; McKnight and Aiken, 1998). For example, SRFA and CCFA have properties that are associated with terrestrial and higher plant sources, such as high SUVA254,
low N/C, high Mn, and high aromaticity, whereas PLFA, POFA, and WLHPOA have
end-member properties that are associated with microbial sources, such as low SUVA254, high
N/C, low Mn, and high percentage of aliphatic carbon relative to aromatic carbon. These
properties are consistent with trends reported in the literature (Thurman, 1985; Leenheer, 1994; McKnight et al., 1994; McKnight and Aiken, 1998). EF1FA, EF1HPOA, and FtLHPOA possess intermediate chemical properties, and will be referred to as intermediate humic substances. The chemical properties of EF1FA and EF1HPOA are very similar, as expected, since fulvic acid accounts for a majority of the hydrophobic acid fraction (Thurman and Malcolm, 1981; Aiken et al., 1992). Table 3.1 shows that the TPIA isolates have a lower molecular weight, are more enriched in organic nitrogen, and have a lower percentage of aromatic carbon compared to corresponding HPOA isolates. These results are consistent with expectations based on the XAD-8/XAD-4 fractionation procedure. Aiken and co-workers (1992) reported that, based on 13C NMR, the TPIA fraction had greater amounts of carboxyl
observe that the TPIA and the microbially derived humic substances are both enriched in organic nitrogen, have a high proportion of aliphatic carbon relative to aromatic carbon, and have similar molecular weights. Figure 3.1 shows that the TPIA isolates have a greater charge density than the HPOA and FA isolates. The general trend in the carboxyl acidity of the DOM isolates is as follows: TPIA > terrestrial > intermediate > microbial.
FIGURE 3.1 Charge density of DOM isolates calculated from direct potentiometric titration results.
3.4.2 Stoichiometry of Anion Exchange
43
exchange isotherm experiments using MIEX resin. The DOM isolates are identified in the legend; the bicarbonate model water did not contain any DOM. The y-axis shows the net increase in the aqueous concentration of chloride (i.e., equilibrium chloride concentration minus initial chloride concentration), while the x-axis shows the net decrease in the aqueous concentration of bicarbonate. For duplicate samples, the mean increase in chloride had a CV of <10% and the mean decrease in bicarbonate had a CV of <20%, which was mostly due to changes in the bicarbonate concentration of <0.02 meq/L. The y = x line represents the stoichiometric exchange of chloride on the resin for bicarbonate in a DOM-free solution. Figure 3.2a shows that the data points for the bicarbonate model water are in good agreement with the y = x line, as expected for binary inorganic anion exchange. In contrast, the data points for the DOM-containing model waters diverge considerably from the y = x line, e.g., at a bicarbonate uptake of 0.1 meq/L the corresponding chloride release was ~2 times greater than the bicarbonate uptake. Figure 3.2a indicates that removal of DOM must account for a substantial fraction of the chloride that was released into solution.
chemical properties among the DOM isolates had a negligible influence on the anion exchange mechanism.
45 3.4.3 Effect of Inter-DOM Properties
Although all of the DOM isolates were removed quantitatively by anion exchange, differences among the DOM isolates, such as charge density and aromaticity, were expected to influence the extent of DOM removal. The effect of inter-DOM properties on anion exchange is analogous to inorganic anion exchange where anions, such as chloride, nitrate, sulfate, and phosphate, are removed by anion exchange yet exhibit different anion-resin selectivity coefficients (Gregory and Dhond, 1972; Gu et al., 2004). The effect of inter-DOM properties on the removal of DOC by MIEX resin is evaluated in Figure 3.3. The results in Figure 3.3 were interpreted by comparing the fraction of DOC removed to the ratio of MIEX resin dose to initial DOC concentration (resin/C0). Both the resin dose and C0 were expressed
in meq/L as discussed previously (Boyer and Singer, 2008). The three regions of interest in Figure 3.3 are identified as follows: resin/C0 < 1, resin/C0 = 1, and resin/C0 > 1.
At resin/C0 < 1, there is a shortage of anion exchange sites with respect to the initial
concentration of DOC. As a result, removal of DOC is very similar for all DOM isolates, as shown in Figure 3.3. The amount of DOC removed at resin/C0 = 1 is a measure of the affinity
of MIEX resin for the various DOM isolates, as will be discussed in more detail below. FtLTPIA was removed to the greatest extent, i.e., 78% DOC removal, whereas the microbial humic substances (PLFA, POFA, and WLHPOA) were removed to the least extent, i.e., 54– 58% DOC removal. Removal of DOC for the other DOM isolates was bracketed by the above results, and is presented quantitatively in Table B4 in Appendix B. The maximum removal of DOC at resin/C0 = 1 was <100% and indicates that not all of the anion exchange
bicarbonate and chloride. At resin/C0 > 1, there is an excess of anion exchange sites with
respect to the initial DOC concentration. Figure 3.3 shows that the microbial humic substances are removed to a lesser extent than the other DOM isolates in this region, although all DOM isolates exhibited substantial removal. Resin/C0 = 5 is equivalent to ~1.0
mL of wet MIEX resin per liter of solution, which is a common MIEX resin dose used in practice (Boyer and Singer, 2006).
Table 3.3 shows the results of a stepwise multiple linear regression analysis between the fraction of DOC removed at resin/C0 = 1 (see Figure 3.3 and Table B4 in Appendix B)
and the DOM properties listed in Table 3.1. DOC removal was correlated strongly and positively with carboxyl acidity (R2 = 0.89). Somewhat surprisingly, none of the other DOM properties was correlated with DOC removal (R2 ≤ 0.45). A multiple linear regression analysis was conducted between DOC removal and carboxyl acidity and the other DOM properties shown in Table 3.1. (Carboxyl acidity was not autocorrelated with any of the other DOM properties in Table 3.1; R2 < 0.08.) Table 3.3 illustrates that the addition of the
aromatic carbon content to the carboxyl acidity showed the greatest improvement in the correlation between DOC removal and DOM properties (R2 = 0.94). In addition, the aromatic carbon content, Mn, and SUVA254 (which are all autocorrelated (Chin et al., 1994; Weishaar
et al., 2003)) were correlated positively with DOC removal, whereas the aliphatic carbon content and N/C were correlated negatively with DOC removal. In summary, the charge density of DOM had the greatest effect on anion exchange uptake. The aromatic and aliphatic carbon content, molecular weight, SUVA254, and nitrogen content, when coupled with