THE RELATIONSHIP BETWEEN LOWER EXTREMITY LEAN MASS, MOVEMENT PROFILE, & VERTICAL GROUND REACTION FORCE IN PHYSICALLY ACTIVE
COLLEGE-AGED FEMALES
By Hanna Gierman
A DOCUMENT SUBMITTED IN FULFILLMENT OF THE REQUIREMENTS FOR THE SENIOR
HONORS THESIS IN THE DEPARTMENT OF EXERCISE & SPORT SCIENCE
THE UNIVERSITY OF NORTH CAROLINA AT CHAPEL HILL
APRIL 2016
CHAPTER 1
INTRODUCTION
Lower extremity mass composition as well as BMI are factors that contribute to
biomechanical function and performance.28 Mass composition in the lower extremities includes both fat and muscle mass; the ratio of fat to muscle in physically active college-aged females can affect individual performance on levels that may include baseline movement profile, loading symmetry, and vertical ground reaction force (vGRF). This is supported in the literature, which found that increased fat composition (BMI) can lead to dangerous landing strategies in both males and females due to increased force on the joints.18 Misic et al. explored this relationship between leg mineral free lean mass (MFLM) and whole-body fat mass, stating it is intuitive that higher levels of physical fitness would be related to higher MFLMLEG quantity and quality, and lower levels of fat mass. Therefore, increased fat composition is linked with decreased lean muscle composition, thus resulting in mass asymmetry. Mass asymmetry has been linked to asymmetrical loading and ground reaction force.30 Lower extremity mass composition may therefore help explain how and why movement profile and vGRF biomechanics change over a period of intense physical activity.
composition demonstrate less dramatic alteration in muscle recruitment patterns. This would be observed through the adoption of a posture that may protect knee structures during hip flexion at initial and peak stance, and knee flexion at peak stance.8 This idea was supported in the study by Cortes et al, which discovered that highly trained NCAA Division I collegiate athletes were better able to sustain neuromechanical adaptations within the first 50% of a fatigue protocol. Because lower extremity lean mass composition and neuromuscular control during fatigue have been found to affect risk of injury, it is hypothesized that females with a higher ratio of lower extremity lean muscle to fat mass are believed to demonstrate a reduced risk of ACL injury. Likewise, females with a lower ratio of lower extremity muscle to fat mass are believed to demonstrate an increased risk of ACL injury. According to the literature, smaller amounts of lean muscle mass and strength in the lower extremities of females compared with males result in greater task difficulty, and may explain sex differences in energy absorption strategies during landing maneuvers.31 Females often possess less lean muscle than males because they possess 150-200% more fat.18 Although these studies compare male risk to female risk, the amount of lean mass in the lower extremities is indicative of potential ACL injury for both genders. This was found in a study performed by Bell et al, in which it was discovered that the morphological factor of lean mass asymmetry was a contributor to force and power asymmetry. Greater
this is due to increased forces placed on joints, ligaments, tendons, and the individual’s
musculoskeletal system.12 Therefore, a higher ratio of fat to muscle mass throughout the body, in addition to the lower extremities, may be suggestive of an increased risk of injury. This means that both fat and lean muscle composition of the lower extremities may be strong indicators of injury risk level for physically active college-aged females.
There are a variety of tools that can be used to measure body composition. One tool is the DXA scan, which provides whole body information regarding bone mineral density and body mass composition (fat and muscle). Force plates can also prove useful in analyzing vertical ground reaction force biomechanics. By utilizing these two tools, whole body information and landing biomechanics may be assessed in an attempt to identify and reduce risk of lower extremity injury. Thus far, evidence from other studies in regards to lower extremity injury and lower extremity mass composition seems promising, though some sources indicate little
Operational Definitions:
Baseline Movement Profile
o Excellent
No medial knee displacement
Score “soft” (0) to “average” (+1) for total sagittal plane joint displacement
o Poor
Medial knee displacement
Score “average” (+1) to “poor” (+2) for total sagittal plane joint displacement
Peak vertical ground reaction force (vGRF)
o Total magnitude
Sum of peak value for left and right limbs Peak power
Loading Asymmetry
o Magnitude between limbs
Right peak force divided by left peak force Dominant Limb
o Limb reportedly used to kick a soccer ball for maximum distance Stance phase
Lower Extremity Lean Mass (LELM)
Lower Extremity Fat Mass (LEFM)
DXA Variables Operational Definition
Total % fat Percent body fat as reported by DXA scan
Subtotal lean mass normalized to body mass (g/kg) Lean mass of body excluding head divided by body mass
Subtotal lean mass normalized to body mass + BMC (g/kg) Lean mass of body excluding head divided by body mass summed with bone mineral content Trunk lean mass normalized to body mass (g/kg) Lean mass of trunk divided by body mass
Lower extremity lean mass normalized to body mass (g/kg) Lean mass of legs and pelvis divided by body mass Lower extremity lean mass normalized to total body lean mass (g/kg) Lean mass of legs and pelvis divided by total lean mass
Lower extremity lean mass normalized to lower extremity total mass (g/kg) Lean mass of legs and pelvis divided by total mass of legs and pelvis Trunk & lower extremity lean mass normalized to body mass (g/kg) Lean mass of trunk, legs, and pelvis divided by body mass
Trunk & lower extremity lean mass normalized to total body lean mass (g/kg) Lean mass of trunk, legs, and pelvis divided by total lean mass of body
vGRF Biomechanics Variables Operational Definition
Peak vGRF symmetry normalized to BW Peak vGRF summed between left and right leg divided by body weight Peak vGRF asymmetry normalized to body mass Peak vGRF subtracted between left and right leg, divided by body mass Peak vGRF normalized to body mass Peak vGRF divided by body mass
Research Questions & Hypotheses:
1. Is there an influence of baseline movement profile on lower extremity lean mass composition in physically active college-aged females?
a. IV: Baseline movement profile (excellent vs poor)
b. DV: Lower extremity lean mass (LELM) composition (provided by DEXA scan) a. LELM was divided by total body mass
b. LELM was divided by total LELM
c. We hypothesized that physically active college-aged females who present an excellent baseline movement profile would have a higher ratio of lower extremity lean mass.
d. We hypothesized that physically active college-aged females who present a poor baseline movement profile would have a lower ratio of lower extremity lean mass.
2. Is there a difference in symmetry of vGRF biomechanics between groups (poor and excellent) during the loading phase of a jump-landing in physically active college-aged females?
a. IV: Baseline movement profile (excellent vs poor) b. DV: Peak loading value
i. We hypothesized that physically active college-aged females with greater lean mass in the lower extremities would demonstrate smaller peak loading values.
ii. We hypothesized that physically active college-aged females with less lean mass in the lower extremities would demonstrate greater peak loading values.
c. DV: Loading asymmetry
Delimitations:
1. The subjects were women between the ages of 18 and 25 that either are currently participating on a varsity or club field/court team at the collegiate level, or have participated at a competitive level within the last six years.
2. Exclusion criteria for subjects will limit subjects to have no lower extremity surgery within the past year, no history of lower extremity joint surgery, no history of prior ACL or meniscal injury, no history of lower extremity injury in the last 6 months that
prevented participation for more than 3 consecutive days, are not currently injured, have never had knee surgery, have no history of neuroendocrine, neurological, or metabolic disease or condition, no history of amenorrhea or dysmenorrhea within the past 6 months, and no history of systematic or cardiorespiratory conditions that would prevent
participation in high intensity exercise.
Limitations:
1. Measurements only apply to physically active females between the ages of 18 and 25 with either poor or excellent baseline movement profiles. Findings may only be applied to this population.
Assumptions:
1. All subjects put forth their best efforts and followed the guidelines before participating in the protocol.
2. Subjects were properly nourished and hydrated.
CHAPTER II
REVIEW OF THE LITERATURE
INTRODUCTION
While there are health benefits to physical activity, there is also a level of inherent risk, such as sport-related injury.11 This presents a conflict between participation in physical activity and health; such a conflict signifies a need to promote the safety of individuals partaking in high levels of activity. In order to ensure the safety of those participating in sports, level of injury risk must be reduced. Lower extremity injuries are a common occurrence that result from
participation in physical activity and sports.11 Many of these injuries can be predicted based on how physically demanding the sport is, in addition to the biomechanical risk of the participant.2, 29 Such injuries tend to follow certain patterns due to vulnerabilities linked with anatomy or skeletal immaturity.2 Lower extremity mass composition has been identified as an important risk factor for noncontact lower extremity injury.8, 17, 18, 27, 39 In this review, mass composition is broken down into two compartments: fat mass and lean mass. Increased adipose tissue is associated with low muscle attenuation,48 and muscle power is an important variable that contributes to optimal physical function in adults, and reduced injury risk.45 The purpose of this review is to provide information regarding lower extremity mass composition, and how it may influence lower extremity biomechanics and injury risk. Specifically, this review will provide background information on variables affected by lower extremity mass composition, such as vertical ground reaction force biomechanics and movement profile.
Previous literature has implicated lower extremity mass composition is associated with variables of physical function. Specifically, thigh mass composition seems to play a large role in stability.8 A greater ratio of lean muscle-to-fat mass is ideal for physical function and
performance.26, 27, 44, 45, 48 High adipose tissue content has been observed to have an inverse relationship with muscle content, and has been identified as a risk factor for physical function in adults of all ages.8, 17, 39 Additionally, muscle quality (along with aerobic fitness and muscle strength) rather than quantity has been found to be an indicator of optimal function.26, 45
Part of the age-related struggle with physical function is the gradual replacement of lean mass with increased adipose tissue mass.8, 45, 48 DXA analyses revealed that femoral lean mass declines with age and is linked with biomechanical issues in the elderly.8 Research has found that the fatty infiltration into muscle is likely to blame for such problems, because it may impair muscle strength to a greater degree than muscle atrophy.18, 48 However, regardless of age, myosteatosis (infiltration of fat into muscle) is increasingly recognized as an important
lower extremity relative strength.18, 21 Higher adiposity has also been found to be a more
significant contributor to physical function than lean mass. This is because higher fat content can create a burden on the individual due to increased load transfer.45
Evidence suggests that body composition influences athletic performance.24 Though the athletic population typically has lower amounts of fat mass than the non-athletic population,40 most studies of body composition in athletes focus on fat mass. This is because fat mass serves as an important indicator of performance, with higher amounts of fat being associated with limited performance.27, 39 An analysis by Legaz, et al concluded that even a slight excess of fat was not beneficial for high-performing endurance runners; the study found that such excess fat was not conducive to obtaining a high performance at any distance. This study found that after three years of training, 30 runners had increased their performance by 3.11%, with significant decreases in their sum of six skinfolds (a decrease in body fat percent). The study also found that 7 runners decreased their performance by 3.40%, which was associated with an increase in the sum of their six skinfolds (an increase in body fat percent). A reduction in performance can lead to fatigue and aberrant changes in biomechanics, which may lead to a greater risk of injury.12, 35 Estimated fat mass in females increases more rapidly between adolescence and young
adulthood.24 This could be one reason why female athletes are at a higher risk for injuring their ACL or sustaining other lower extremity injuries, especially after puberty. For example, during the transition from childhood to adolescence, estimated fat mass increases more rapidly in females than in males, with females having about 1.5 times the amount of fat mass that males possess.24Puberty and maturation play a rather large role in contributing to females’ risk of
injury in contrast to males; this is because females may have greater generalized joint laxity
associated with the menstrual cycle may explain females’ increased risk of ACL injury.29
Structural and physiological changes that occur during puberty such as alterations in passive
joint restraints, may affect the type, severity and incidence of injuries in the maturing adolescent
population.41Various studies have attempted to examine how joint laxity may play a role in
lower extremity injury. During et al found evidence suggesting that high-risk biomechanics may be modifiable through strength training. The purpose of this would be to increase the muscle mass around the knee. Many discussions of body composition in athletes focus on relative fatness because of the potentially negative influence of excessive fatness on performance.24 As previously stated, there is a consensus that increases in lean mass are related to improvements in physical performance or the application of strength training targeted at specific muscle groups.14, 30
Muscle atrophy and reduced lean mass content have also been associated with increased risk of lower extremity injury, since greater muscle composition and lower levels of fat mass allow for better energy absorption during landing.26, 27 Risk of injury is also increased in individuals with lower lean mass, since there is a reduced ability to produce adequate forces to safely control landing; the ability to decelerate is also reduced.2 Findings from studies that focused on groups of all ages seem to reach similar conclusions regarding the importance of muscle quality. Therefore, it is likely that trends in obesity, sarcopenia and myosteatosis may highlight the importance of muscle quality in physically active populations of all ages.
MOVEMENT PROFILE
sagittal plane, in addition to medial knee displacement in the frontal plane.35 This means that an individual’s trunk does not go through a significant amount of movement, and their knee(s) may cross over their great toe during the landing-absorption phase of a jump-landing task. There has been some research regarding how an increase in one’s lean mass via strength training may positively impact their movement profile. For example, Myer et al, performed a study in which participants underwent a strength training protocol. The participants that exhibited medial knee displacement prior to undergoing the strength training protocol demonstrated significant improvement post training. Specifically, untrained subjects demonstrated greater varus and valgus knee torques than the trained subjects (those who received the treatment). Their knee alignment during landing was also significantly improved. According to the literature, the effects of training can increase strength in female athletes, which is an effect of increased muscular composition in the lower extremities.30
with higher LESS scores are described to exhibit a poor jump-landing technique, while those with lower LESS scores are described to have excellent movement technique.35 The LESS is founded on the principle that specific movement patterns may indicate an increased risk of lower extremity injury, including noncontact ACL injury.35 This is because stiffer landings (decreased knee and trunk flexion) are linked with increased shear forces on the knee, as well as increased vGRF; the frontal plane allowed for identification of knee valgus, which is manifested in medial displacement upon landing.35 Padua et al further tested the accuracy of the LESS as a screening tool for an ACL injury-prevention program in female elite soccer players. Despite sample-size limitations, the findings of the study supported the LESS as an effective screening tool to determine ACL injury risk.36 Another study, by Cameron et al, supports the LESS as a valid instrument for subjectively assessing jump-landing movement patterns. Cameron et al found that
for every additional movement error documented at baseline, there was a 15% increase in the
incidence rate of lower-extremity stress fracture during follow-up.9
Quantitatively, kinetics may be assessed via force plates, which gather and report data concerning vGRF biomechanics, such as impulse, loading symmetry, peak loading, and peak power. One method that assesses muscle function through analysis of countermovement jumps, is jumping mechanography. Jumping mechanography is highly reproducible and uses
quantitative data to assess jump-landing biomechanics with force plates. It is also one method that can help prevent fall and fracture risk.7
affect human biomechanics; decreased neuromuscular control is associated with high-risk biomechanics, linked to lower extremity injury. A study by Cortes et al exposed participants to a short fatiguing exercise protocol. Cortes et al found that fatigue influenced several kinematic variables. At 100% fatigue, participants’ risk of ACL injury was increased as a result of
progressive changes in lower extremity mechanics for knee flexion and hip abduction angles, and internal adduction moment. The study also noted that participants adopted certain postures that were believed to better protect the knee from injury. However, highly trained participants (NCAA Division I athletes) demonstrated a better ability to handle fatigue within the first 50% of the protocol. Such findings support the idea that baseline movement profile is an important indicator of noncontact lower extremity injury risk. It also signifies the importance of lower extremity mass composition, since the literature reveals a relationship between lower extremity mass composition and physical function.14, 20, 21, 26, 27, 39, 40, 45, 48, 49 These findings may also suggest that lower extremity mass composition plays an influential role in predicting risk of lower extremity injury by impacting movement profiles throughout fatiguing physical activity.
VERTICAL GROUND REACTION FORCE
A study by Yu et al concluded that increased joint motion of the hip and knees reduces the impact forces that can occur when landing. Increased joint motion has been found to be indicative of “excellent” biomechanics.35 Padua et al demonstrated such findings, concluding that limited sagittal plane motion is associated with decreased hip and trunk flexion, leading to higher vGRF.35 The literature also agrees that smaller joint motions of the hip and knee, in addition to increased knee valgus (medial knee displacement) increase one’s risk of lower extremity injury.35, 50 Females are at an especially greater risk for sustaining injury than their male counterparts because their biomechanics tend to be more limited, as revealed by hip and knee joint motions upon impact.50 Additionally, landing from greater heights increases the force exerted on the body and joints, and also leads to decreased flexion and stiffer biomechanics.5 This is associated with increased risk of injury.
PEAK POWER OUTPUT
During physical activity, athletes are required to generate forces across a range of velocities, with a resulting power-load spectrum.46 Peak power output has been found to be an important variable that can determine performance, since it represents the balance between force and velocity.46 While Turner et al performed a study that utilized male subjects, the experiment nevertheless demonstrates the relationship between peak power output and performance. The study determined that peak power output was higher when lower loads were applied, and also decreased when greater loads were applied. vGRF was found to be inversely proportional to PPO46 (peak power output), which may show that performance is increased when an individual carries lighter loads. While Turner states that PPO is variable across individuals, it appears that the findings may link a better capacity to distribute loading forces with greater PPO.
LOADING SYMMETRY
Loading symmetry is determined by the amount of loading forces absorbed between each lower limb. Increased loading on one limb may place it at a higher risk of injury.35 The literature suggests that loading asymmetry during landing presents an increased risk of lower extremity injury.5 Greater loading asymmetry refers to a disparity in force distribution between limbs at impact; if there is asymmetry in the lower limb mass, then one limb is absorbing more vGRF than the other. This could mean that the overloaded limb is at an increased risk of injury.5 Females often have greater vGRF in their non-dominant limb upon landing.5, 6 This increases asymmetry, which is determined by the difference in peak vGRF between legs.
the case, then performance could possibly be compromised, thus increasing the potential for injury. There is a strong correlation between lean mass asymmetry and asymmetrical force output between limbs.6 For example, individuals who have undergone ACL reconstruction surgery have been found to place 15% more of their weight on the uninvolved leg during jump-landing tasks.6 This is because the uninvolved leg is stronger than the injured/recovering leg. Often, the goal of rehabilitation after reconstructive surgery is to strengthen the affected limb, so that pre-injury levels of function can be restored.37 Strength asymmetries greater than 15% have also been associated with increased risk of injury, and individuals often place more weight on their dominant limb.6 Lean mass asymmetry is a factor in explaining force and power asymmetry during landing.6 Bell’s study suggests that asymmetry in power negatively influences
performance; the results showed that greater than 10% asymmetry power resulted in performance deficits. Fortunately, asymmetry in lean mass can be corrected with strength training and
conditioning.
IMPULSE
Impulse is defined as the amount of force during the loading phase of activity multiplied by the amount of time spanned during the phase. Various studies have found that impulse
this is due to the fact that leg stiffness influences the kinematics and mechanics of how the body interacts with the ground.38 As with peak loading values, smaller values of impulse reflect favorable biomechanics, because lean mass functions to absorb forces associated with the loading phase.6, 18. 21, 27
CONCLUSION
The literature has found significant data supporting the notion that higher lean muscle content is beneficial to lower extremity physical function and reduction in injury risk. It is hypothesized that greater volume of lean muscle affords the individual with a greater capacity to absorb landing forces,6, 18, 21, 27 promotes efficient biomechanics,30 and may possibly aid in
reducing fatigue (due to increased endurance).3 Greater lean mass is associated with landing energetics that may be linked to a decreased risk of injury and joint loading.27 The literature supports the fact that lower extremity lean mass composition plays an important role in
movement profile, which can serve as an indicator of susceptibility to injury.35 Movement profile may be improved, and risk of injury may be reduced with the implementation of strength
training, which is meant to increase muscular mass around the knee.14
volume is an important indicator of joint torque, which has an impact on prevalence of lower extremity injury.15 Greater muscle volume has been observed to be correlated with reduced risk of lower extremity injury, since it is a major determinant of joint torque.15 Females subjected to strength training demonstrated increased muscular strength, power, and speed; this type of training also improves force absorption, active joint stabilization, muscle imbalances, and functional biomechanics through increased strength of structural tissues.30 Each outcome is likely related to a reduction in risk of injury. Studies exploring strength training have also found that it significantly altered participants’ biomechanics and movement patterns during landing.30 Post training results reveal that injury risk is likely reduced due to the beneficial adaptations that occur in bones, ligaments, and tendons.30
vGRF biomechanics are variables that are influenced by an individual’s lean mass
composition.10, 18, 21, 38, 46 The cause of high forces during landing may be related to fat and muscle composition, as well as fatigue and neuromuscular control.23 A higher amount of lean mass can help absorb higher impacts during landing, and is therefore a crucial element in preventing lower extremity injury.27 Asymmetry in mass distribution can also lead to an increased risk of injury, since greater loading asymmetry refers to the unevenness of force distribution at impact. In lower limb mass, asymmetry means that one limb is absorbing more vGRF than the other, which places the overloaded limb at increased risk of lower extremity injury.
affect human biomechanics. Decreased neuromuscular control is associated with poor
biomechanics, and an elevated risk of injury.30 Neuromuscular control can be improved through strength training, thus lowering one’s risk of injury by improving biomechanics and
performance.30 This type of training also improves force absorption, active joint stabilization, muscle imbalances, and functional biomechanics through increased strength of structural tissues.30 Each outcome is likely related to a reduction in risk of injury.
METHODS
SUBJECTS
Twenty female subjects from the university setting volunteered for this study. The subjects’ ages range from 18-25 years of age. Subjects were included in the study if they meet the required movement profile characteristics of either poor or excellent movers, as operationally defined by the LESS clinical movement assessment. Subjects must have been actively
participating in physical activity for at least thirty minutes per day, three days per week at the time of the study. Subjects also had to have participated in either field or court sports (i.e. soccer, volleyball, field hockey, lacrosse, tennis, and basketball) competitively within the last two years. Subjects were excluded from this study if she had suffered a lower extremity injury in the last six months that prevented her from sport participation for more than four days consecutively; has undergone a lower extremity surgery in the past year; currently injured or currently experiencing pain more than muscle soreness at the time of the study. Subjects were also excluded if they were pregnant.
Body composition and mass distribution was assessed using a Dual-Energy X-ray Absorptiometry (DXA). DXA is a common clinical imaging technique employed for bone densitometry, body composition, and mass distribution assessment in the general population.
Segment kinematic data was collected using two Bertec force plates. Each participant underwent a jump-landing task. The force plates sampled both ground reaction force and center of pressure data. The force plates sampled ground reaction force and center of pressure data during the jump-landing task. Data gathered by the force plates was sampled at 1000 Hz and passed through a 64 channel A/D board connected to a computer, and streamed into the Vicon Nexus motion capture software. vGRF data was imported into the Motion Monitor software for data analysis.
PROTOCOL
Movement Screening – Session I
Upon the potential subject’s arrival to The Sports Medicine Research Laboratory, a member of the research team confirmed that the screening candidate met demographic inclusion/ exclusion criteria with a checklist. Candidates that met study inclusion/exclusion criteria
completed Institutional Review Board approved consent documentation prior to the movement screening assessment. Following the informed consent process, participants underwent the LESS screening procedure.
plane. Members of the research team then analyzed the potential participant’s movement in each plane based on a point system. Only individuals who met the criteria of an excellent or poor
mover were invited to participate in the study. Excellent movers were identified as possessing no medial knee displacement in the frontal plane, with a soft-average landing in the sagittal plane.
Excellent movers were identified as individuals that received a score of 0 to +1 (soft to average)
for total sagittal plane joint displacement. Poor movers were identified as possessing medial knee displacement in either an individual limb or both limbs, with an average-stiff landing in the sagittal plane. Poor movers were identified as individuals that have received scores of +1 to +2 (average to poor) for total sagittal plane joint displacement.
If individuals met the standards of either movement profile group, they were invited to participate in the study.
Testing Session –Session II
Subjects arrived at the Sports Medicine Research Laboratory, and a member of the research team assessed their height and weight. Subjects were then asked to provide a urine sample, so that they could be assessed for hydration status using the urine specific gravity method. If subjects were normally hydrated (1.002 to 1.035 g/ml), they were deemed eligible to undergo a DXA scan.
Prior to the subject’s preparation for motion analysis, the principal investigator described the jump tasks. Subjects were permitted to complete 1-3 practice trials of the jump-landing task from a box set at a distance corresponding to their height. The jump-landing trials were
performed 3 jump-landing tasks, while ensuring that their feet land on each respective force plate.
Next, a DXA scan was performed in order to assess body composition and muscle distribution in the lower extremity. Prior to the DXA scan, a member of the research team explained the process and purpose of the DXA scan to subjects. Subjects were instructed to lay supine and “still” during the scan lasting approximately 6 minutes.
ANALYSIS OF DATA
Using Hologic Discovery Software, a multi-compartment model was used to calculate total body fat-free (kg) and fat mass (kg) composition as well as customized segmental regions of interest. Regions of interest included mass composition of the pelvis, total lower extremity, and right and left leg bilaterally. Isolated segment compartments were summed to determine the total lower extremity lean and fat mass composition.
vGRF was calculated as the vertical component of the ground reaction force vector coinciding with the z-axis; vGRF was evaluated as three variables: force magnitude and magnitude symmetry between legs. All vGRF data was processed in the Motion Monitor software package for import into a custom MatLab software program for further data reduction. From this program, the stance phase of the jump-landing tasks was identified from the ground reaction force. The stance phase of the jump-landing task was defined as the point of initial ground contact to toe-off. Initial ground contact was defined as the first time point the vertical ground reaction force exceeds 10N. Toe-off was defined as instant vGRF is <10N.
1. Is there an influence of baseline movement profile on lower extremity mass composition in physically active college-aged females?
a. Independent samples t-test
i. IV: Baseline movement profile (excellent vs poor) ii. DV: Lower extremity mass composition
T-tests are meant to use separate samples for treatment conditions. Two separate samples were compared: excellent movers and poor movers. Once the data from the DXA scans were analyzed, the difference between groups was determined.
2. Is there an influence of lower extremity mass composition on the symmetry of vertical ground reaction force biomechanics during the loading phase of a jump-landing in physically active college-aged females?
a. Independent samples t-test
i. IV: lower extremity mass composition symmetry ii. DV: vGRF biomechanics
RESULTS
Anthropometric Data
A table of descriptive statistics of anthropometric data of subjects can be found below in table 1. Table 1. Sample Demographics
Group n Age (SD) yrs Height (SD) cm Mass (SD) kg
All 42 20 (1.6) 167.7 (7.13) 62.9 (7.25)
Excellent 21 21 (1.9) 166.7 (7.21) 64.8 (7.87)
Poor 21 20 (1.2) 168.9 (7.05) 61.00 (6.20)
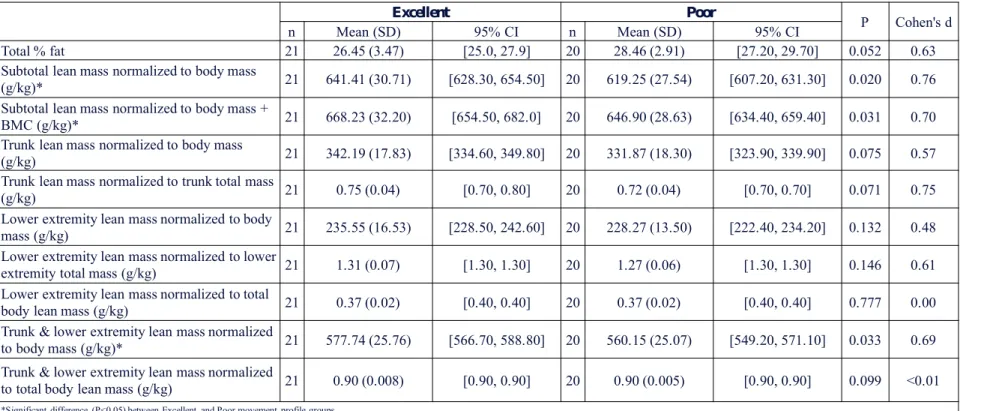
Table 2. DXA Results
Excellent Poor
P Cohen's d
n Mean (SD) 95% CI n Mean (SD) 95% CI
Total % fat 21 26.45 (3.47) [25.0, 27.9] 20 28.46 (2.91) [27.20, 29.70] 0.052 0.63 Subtotal lean mass normalized to body mass
(g/kg)* 21 641.41 (30.71) [628.30, 654.50] 20 619.25 (27.54) [607.20, 631.30] 0.020 0.76 Subtotal lean mass normalized to body mass +
BMC (g/kg)* 21 668.23 (32.20) [654.50, 682.0] 20 646.90 (28.63) [634.40, 659.40] 0.031 0.70 Trunk lean mass normalized to body mass
(g/kg) 21 342.19 (17.83) [334.60, 349.80] 20 331.87 (18.30) [323.90, 339.90] 0.075 0.57 Trunk lean mass normalized to trunk total mass
(g/kg) 21 0.75 (0.04) [0.70, 0.80] 20 0.72 (0.04) [0.70, 0.70] 0.071 0.75
Lower extremity lean mass normalized to body
mass (g/kg) 21 235.55 (16.53) [228.50, 242.60] 20 228.27 (13.50) [222.40, 234.20] 0.132 0.48 Lower extremity lean mass normalized to lower
extremity total mass (g/kg) 21 1.31 (0.07) [1.30, 1.30] 20 1.27 (0.06) [1.30, 1.30] 0.146 0.61 Lower extremity lean mass normalized to total
body lean mass (g/kg) 21 0.37 (0.02) [0.40, 0.40] 20 0.37 (0.02) [0.40, 0.40] 0.777 0.00 Trunk & lower extremity lean mass normalized
to body mass (g/kg)* 21 577.74 (25.76) [566.70, 588.80] 20 560.15 (25.07) [549.20, 571.10] 0.033 0.69 Trunk & lower extremity lean mass normalized
to total body lean mass (g/kg) 21 0.90 (0.008) [0.90, 0.90] 20 0.90 (0.005) [0.90, 0.90] 0.099 <0.01
An independent samples t-test was performed to evaluate the difference in subtotal
lean mass between individuals with poor and excellent movement profiles. Individuals with
an excellent movement profile have significantly greater (P=0.020) normalized subtotal
lean mass than individuals with poor movement profiles. Individuals with an excellent
movement profile have significantly greater (P=0.031) normalized subtotal lean mass.
Individuals with an excellent movement profile have significantly greater (P=0.033)
normalized trunk and lower extremity lean mass. In poor movers, total percent fat trended
towards significance (P=0.052). There were no other significant differences between
groups.
Table 3. vGRF Biomechanics
Excellent Poor
P Cohen's d n Mean (SD) 95% CI n Mean (SD) 95% CI
Total vGRF 21 3268.84 (823.01) [2916.8, 3620.9] 21 3443.87 (692.55) [3147.7, 3740.1] 0.460 0.23 Peak vGRF symmetry
normalized to BW 21 0.43 (0.35) [0.3, 0.6] 21 0.61 (0.40) [0.4, 0.8] 0.123 0.48 Peak vGRF asymmetry normalized to
Body Mass (kg) 21 4.21 (3.47) [2.7, 5.7] 21 6.0 (3.88) [4.3, 7.7] 0.123 0.49 Peak vGRF
normalized to Body Mass (kg) 21 50.38 (10.33) [46.0, 54.8] 21 56.82 (11.64) [51.8, 61.8] 0.065 0.59 Peak vGRF normalized to Subtotal
Lean Mass (kg) 21 78.73 (16.69) [71.6, 85.9] 21 91.67 (21.23) [82.6, 100.7] 0.034 0.68
An independent samples t-test was performed to evaluate the difference in vGRF
biomechanics between individuals with poor and excellent movement profiles. Individuals
with a poor movement profile have significantly greater (P=0.034) normalized peak vGRF
than individuals with excellent movement profiles.
CHAPTER 5
DISCUSSION
The primary findings of this study demonstrated that excellent movers possess more total lean body mass than poor movers, with subtotal lean mass normalized to body mass, as well as subtotal lean mass normalized to body mass and bone mineral content being significantly greater (p < 0.05); trunk and lower extremity lean mass normalized to body mass was also found to be significantly greater. While total percent body fat was not found to be significant, the variable showed a trend towards significance, with poor movers possessing more body fat than excellent movers. The significance of these variables likely plays a role in the expression of biomechanics variables such peak loading, asymmetry, and lower extremity lean mass.
This study also found that poor movers exhibited greater peak loading.
Individuals with poor movement profiles experienced greater peak vGRF normalized to subtotal lean mass and peak vGRF normalized to subtotal lean mass and body weight (p < 0.05). Contrary to our initial hypothesis there was no difference in loading symmetry between the movement profile groups (p > 0.05).
These findings support our hypotheses that excellent movers possess greater amounts of lean mass than poor movers (roughly 1.3 kg more), and that excellent movers demonstrate smaller peak loading values during the loading phase of a jump-landing task. There was also a strong trend towards significance for total percent body fat, with poor movers exhibiting more than excellent movers.
may reduce the ability to produce force and power while jumping.6 This study serves as a model that highlights the importance of lean mass and the impact of body composition on performance. Lean mass is an important indicator of performance and injury risk, since greater lean mass composition allows for better energy absorption during landing, thus reducing risk of injury. This can be explained by the fact that lean muscle plays a
significant role in impact forces, as muscle functions to dynamically dampen force, with all muscles playing a significant role in the management of peak vGRF.21 Another study by Montgomery et al also found that less lean mass may limit an individual’s ability to safely control their landing, which places them at an increased risk of injury. Likewise, Montgomery believed that stiffer biomechanics (ie poor movement profiles) could lead to more energy absorption by anatomical structures other than lean mass, such as bone and cartilage, thus placing the individual at an increased risk of injury.27 Murphy et al also determined that low muscle strength and muscle imbalances increase the risk of injury, with imbalance in athletes leading to higher rates of injury.29 Athletes with reduced quadriceps strength were more likely to sustain non-contact injuries.29 It can be inferred from these studies and our findings that increased lean mass plays a significant role in protecting an individual during the loading phase of a jump-landing task via energy absorption. This absorption by lean mass likely prevents surrounding structures from absorbing excessive force, and may reduce the risk of injury. This may also explain the difference in peak loading values between groups; poor movers with less lean mass likely subject their surrounding structures to greater force absorption.
performance. For example, Myer et al found that neuromuscular training significantly improved performance and lower extremity biomechanics in female athletes. It would be useful to further study how neuromuscular training can benefit females that are at a higher risk of injury, since various studies have found that dynamic neuromuscular training can reduce differences in force absorption, active joint stabilization, muscle imbalances, and functional biomechanics.30 Neuromuscular training also has been shown to increase strength of structural tissues.30 Therefore, while our study demonstrated the importance of lean mass and its role in performance, other studies seem to conclude that neuromuscular control and training play a significant role in performance and injury prevention.
Loading asymmetry was not found to be significantly different between the two groups (p > 0.05). The literature states that loading asymmetry can lead to increased risk of injury. Greater loading asymmetry refers to a disparity in force distribution between limbs at impact; if there is asymmetry in the lower limb mass, then one limb is absorbing more vGRF than the other. A study by Bates et al concluded that an overloaded limb may be at an increased risk of injury.5 Asymmetry during a jump-landing task may also lead to performance deficits. However, our findings suggest that uninjured females, regardless of movement profile, do not seem to demonstrate a significant amount of asymmetry between limbs during such a task.
during the jump-landing task. The software utilized frame values in increments of five, rather than exact increments of one. This could have an effect on the time between contact and peak load placed on joints during the task.
Further Study
Further research should be performed in order to continue to develop an
understanding of how these results can lead to injury and injury prevention. For example, studies that emphasize the impact of neuromuscular training on lean mass may prove useful, such as the one performed by Myer et al (2005). This study sought to determine whether neuromuscular training programs would be useful in altering movement profiles, thus improving one’s lean mass and reducing risk of injury.
While both groups demonstrated similar limb asymmetry magnitudes during the loading phase of the jump-landing task, the movement profile groups differed in the amount of impact load taken on. It is possible that the vGRF taken on may be the defining factor in injury risk as a result the ability of lean mass to dampen ground reaction forces. Further research may need to be done in order to determine whether asymmetry in lean mass is a contributing factor to overall performance and force absorption.
Conclusions
REFERENCES
1. Ali, N., Robertson, D. G. E., & Rouhi, G. (2014). Sagittal plane body kinematics and kinetics during single-leg landing from increasing vertical heights and horizontal distances: Implications for risk of non-contact ACL injury. Knee, 21(1), 38–46.
http://doi.org/10.1016/j.knee.2012.12.003
2. Anderson, S. J. (2005). Sports injuries. Current Problems in Pediatric and Adolescent
Health Care. http://doi.org/10.1016/j.cppeds.2004.12.009
3. Barbieri, F. A., dos Santos, P. C. R., Vitório, R., van Dieën, J. H., & Gobbi, L. T. B. (2013). Effect of muscle fatigue and physical activity level in motor control of the gait of young adults. Gait & Posture, 38(4), 702–707.
http://doi.org/10.1016/j.gaitpost.2013.03.006
4. Bartlett, R. (1997). Introduction to sports biomechanics (2nd ed., pp. 1-276). London: E & FN Spon.
5. Bates, N. a., Ford, K. R., Myer, G. D., & Hewett, T. E. (2013). Impact differences in ground reaction force and center of mass between the first and second landing phases of a drop vertical jump and their implications for injury risk assessment.
Journal of Biomechanics, 46(7), 1237–1241.
http://doi.org/10.1016/j.jbiomech.2013.02.024
6. Bell, D., Sanfilippo, J., Binkley, N., & Heiderscheit, B. (2014). Lean Mass Asymmetry Influences Force and Power Asymmetry During Jumping in Collegiate Athletes.
Journal of Strength and Conditioning Research,28(4), 884-891.
7. Buehring, B., Krueger, D., Fidler, E., Gangnon, R., Heiderscheit, B., & Binkley, N. (2015). Reproducibility of jumping mechanography and traditional measures of physical and muscle function in older adults. Osteoporosis International, 26(2), 819–825. http://doi.org/10.1007/s00198-014-2983-z
8. Buford, T. W., Lott, D. J., Marzetti, E., Wohlgemuth, S. E., Vandenborne, K., Pahor, M., … Manini, T. M. (2012). Age-related differences in lower extremity tissue compartments and associations with physical function in older adults. Experimental
Gerontology, 47(1), 38–44. http://doi.org/10.1016/j.exger.2011.10.001
9. Cameron, K., Peck, K. (2014). Landing Error Scoring System (LESS) Items are Associated with the Incidence Rate of Lower Extremity Stress Fracture.
Orthopaedic Journal of Sports Medicine,2(2). doi:10.1177/2325967114S00080 10. Chavet, P., Lafortune, M. a., & Gray, J. R. (1997). Asymmetry of lower extremity
responses to external impact loading. Human Movement Science, 16(4), 391–406.
http://doi.org/10.1016/S0167-9457(96)00046-2
11. Conn, J. M., Annest, J. L., & Gilchrist, J. (2003). Sports and recreation related injury episodes in the US population, 1997-99. Inj Prev, 9(2), 117.
http://doi.org/10.1136/ip.9.2.117
12. Cortes, N., Greska, E., Kollock, R., Ambegaonkar, J., & Onate, J. a. (2013). Changes in lower extremity biomechanics due to a short-term fatigue protocol. Journal of
Athletic Training, 48(3), 306–313. http://doi.org/10.4085/1062-6050-48.2.03
13. Decker, M. J., Torry, M. R., Wyland, D. J., Sterett, W. I., & Steadman, J. R. (2003). Gender differences in lower extremity kinematics, kinetics and energy absorption during landing. Clinical Biomechanics, 18(7), 662–669.
14. During, S., Pivot, S., & Arbor, A. (2012). Greensboro , NC, 47(5), 1–12.
http://doi.org/10.4085/1062-6050-47.5.07
15. Fukunaga, T., Miyatani, M., Tachi, M., Kouzaki, M., Kawakami, Y., & Kanehisa, H. (2001). Muscle volume is a major determinant of joint torque in humans. Acta
Physiologica Scandinavica, 172(4), 249–255.
http://doi.org/10.1046/j.1365-201X.2001.00867.x
16. Giugliano, D. N., & Solomon, J. L. (2007). ACL Tears in Female Athletes. Physical
Medicine and Rehabilitation Clinics of North America.
http://doi.org/10.1016/j.pmr.2007.05.002
17. Jespersen, E., Verhagen, E., Holst, R., Klakk, H., Heidemann, M., Rexen, C. T., … Wedderkopp, N. (2013). Total body fat percentage and body mass index and the association with lower extremity injuries in children: a 2.5-year longitudinal study.
British Journal of Sports Medicine, 1497–1502.
http://doi.org/10.1136/bjsports-2013-092790
18. LaRoche, D. P., Kralian, R. J., & Millett, E. D. (2011). Fat mass limits lower-extremity relative strength and maximal walking performance in older women.
Journal of Electromyography and Kinesiology, 21(5), 754–761.
http://doi.org/10.1016/j.jelekin.2011.07.006
19. LaRoche, D. P., Millett, E. D., & Kralian, R. J. (2011). Low strength is related to diminished ground reaction forces and walking performance in older women. Gait
and Posture, 33(4), 668–672. http://doi.org/10.1016/j.gaitpost.2011.02.022
20. Legaz, A., & Eston, R. (2005). Changes in performance, skinfold thicknesses, and fat patterning after three years of intense athletic conditioning in high level runners.
British Journal of Sports Medicine, 39(11), 851–856.
http://doi.org/10.1136/bjsm.2005.018960
21. Lerner, Z. F., Board, W. J., & Browning, R. C. (2014). Effects of obesity on lower extremity muscle function during walking at two speeds. Gait & Posture, 39(3), 978–84. http://doi.org/10.1016/j.gaitpost.2013.12.020
22. Longpré, H. S., Potvin, J. R., & Maly, M. R. (2013). Biomechanical changes at the knee after lower limb fatigue in healthy young women. Clinical Biomechanics,
28(4), 441–447. http://doi.org/10.1016/j.clinbiomech.2013.02.010
23. Madigan, M. L., & Pidcoe, P. E. (2003). Changes in landing biomechanics during a fatiguing landing activity. Journal of Electromyography and Kinesiology, 13(5), 491–498. http://doi.org/10.1016/S1050-6411(03)00037-3
24. Malina, R. M. (2007). Body Composition in Athletes: Assessment and Estimated Fatness. Clinics in Sports Medicine, 26(1), 37–68.
http://doi.org/10.1016/j.csm.2006.11.004
25. Mcnair, P. J., & Prapavessis, H. (1999). Normative Data of Vertical Ground Reaction Forces During Landing from a Jump, Journal of Science and Medicine in Sport,
2(1):86–88.
26. Misic, M. M., Rosengren, K. S., Woods, J. a., & Evans, E. M. (2007). Muscle quality, aerobic fitness and fat mass predict lower-extremity physical function in
community-dwelling older adults. Gerontology, 53(5), 260–266. http://doi.org/10.1159/000101826
and Science in Sports and Exercise, 44(12), 2376–2383.
http://doi.org/10.1249/MSS.0b013e318268fb2d
28. Montgomery, M. M. The Effect of Lean Body Mass and Strength on Lower Extremity Energy Absorption Strategies during Landing. (2011) Directed by Dr. Sandra J. Shultz. 189 pp. Lower amounts of lean body mass and strength in females compared . (2011).
29. Murphy, D. F., Connolly, D. a J., & Beynnon, B. D. (2003). Risk factors for lower extremity injury: a review of the literature. British Journal of Sports Medicine,
37(1), 13–29. http://doi.org/10.1136/bjsm.37.1.13
30. Myer, G. D., Ford, K. R., Palumbo, J. P., & Hewett, T. E. (2005). Neuromuscular training improves performance and lower-extremity biomechanics in female athletes. Journal of Strength and Conditioning Research / National Strength &
Conditioning Association, 19(1), 51–60. http://doi.org/10.1519/13643.1
31. Nikander, R., Sievänen, H., Uusi-Rasi, K., Heinonen, A., & Kannus, P. (2006). Loading modalities and bone structures at nonweight-bearing upper extremity and weight-bearing lower extremity: A pQCT study of adult female athletes. Bone,
39(4), 886–894. http://doi.org/10.1016/j.bone.2006.04.005
32. Nilstad, A., Andersen, T. E., Bahr, R., Holme, I., & Steffen, K. (2014). Risk factors for lower extremity injuries in elite female soccer players. The American Journal of
Sports Medicine, 42(4), 940–8. http://doi.org/10.1177/0363546513518741
33. Onate, J., Cortes, N., Welch, C., & Van Lunen, B. L. (2010). Expert versus novice interrater reliability and criterion validity of the landing error scoring system.
Journal of Sport Rehabilitation, 19(1), 41–56.
34. Orishimo, K. F., Kremenic, I. J., Pappas, E., Hagins, M., & Liederbach, M. (2009). Comparison of landing biomechanics between male and female professional dancers. The American Journal of Sports Medicine, 37(11), 2187–2193. http://doi.org/10.1177/0363546509339365
35. Padua, D. a, Boling, M. C., Distefano, L. J., Onate, J. a, Beutler, A. I., & Marshall, S. W. (2011). Reliability of the landing error scoring system-real time, a clinical assessment tool of jump-landing biomechanics. Journal of Sport Rehabilitation,
20(2), 145–156.
36. Padua, D. a., DiStefano, L. J., Beutler, A. I., de la Motte, S. J., DiStefano, M. J., & Marshall, S. W. (2015). The Landing Error Scoring System as a Screening Tool for an Anterior Cruciate Ligament Injury–Prevention Program in Elite-Youth Soccer Athletes. Journal of Athletic Training, 50(1), 150326115639000.
http://doi.org/10.4085/1062-6050-50.1.10
37. Palmieri-Smith, R. M., Thomas, A. C., & Wojtys, E. M. (2008). Maximizing
Quadriceps Strength After ACL Reconstruction. Clinics in Sports Medicine, 27(3), 405–424. http://doi.org/10.1016/j.csm.2008.02.001
38. Peng, H.-T. (2011). Changes in biomechanical properties during drop jumps of incremental height. Journal of Strength and Conditioning Research / National Strength & Conditioning Association, 25(9), 2510–8.
doi:10.1519/JSC.0b013e318201bcb3
International Journal of Obesity, 35(8), 1095–1103.
http://doi.org/10.1038/ijo.2010.257
40. Prior, B. M., Modlesky, C. M., Evans, E. M., Sloniger, M. a, Saunders, M. J., Lewis, R. D., & Cureton, K. J. (2001). Muscularity and the density of the fat-free mass in athletes. Journal of Applied Physiology (Bethesda, Md. : 1985), 90, 1523–1531.
http://doi.org/10.1111/j.1365-2796.2003.01229.x
41. Quatman, C. E., Ford, K. R., Myer, G. D., Paterno, M. V., & Hewett, T. E. (2008). The effects of gender and pubertal status on generalized joint laxity in young athletes. Journal of Science and Medicine in Sport, 11(3), 257–263.
http://doi.org/10.1016/j.jsams.2007.05.005
42. Richter, C., O’Connor, N. E., Marshall, B., & Moran, K. (2014). Clustering vertical ground reaction force curves produced during countermovement jumps. Journal of
Biomechanics, 47(10), 2385–2390. http://doi.org/10.1016/j.jbiomech.2014.04.032
43. Shultz, S. J., Pye, M. L., Montgomery, M. M., & Schmitz, R. J. (2012). Associations Between Lower Extremity Muscle Mass and Multiplanar Knee Laxity and Stiffness: A Potential Explanation for Sex Differences in Frontal and Transverse Plane Knee Laxity. The American Journal of Sports Medicine.
http://doi.org/10.1177/0363546512461744
44. Shultz, S. J., Carcia, C. R., & Perrin, D. H. (2004). Knee joint laxity affects muscle activation patterns in the healthy knee. Journal of Electromyography and
Kinesiology, 14(4), 475–483. http://doi.org/10.1016/j.jelekin.2003.11.001
45. Straight, C. R., Brady, A. O., & Evans, E. M. (2015). Muscle quality and relative adiposity are the strongest predictors of lower-extremity physical function in older women. Maturitas, 80(1), 95–99. http://doi.org/10.1016/j.maturitas.2014.10.006
46. Turner, A. P., Unholz, C., Potts, N., & Coleman, S. G. (2011). Peak power, force and velocity during jump squats in professional rugby players. Journal of Strength and
Conditioning Research, 1. doi:10.1519/JSC.0b013e318234ebe5
47. Van Mechelen, W., Hlobil, H., & Kemper, H. C. (1992). Incidence, severity, aetiology and prevention of sports injuries. A review of concepts. Sports Medicine
(Auckland, N.Z.), 14(2), 82–99. http://doi.org/10.2165/00007256-199214020-00002
48. Visser, M., Kritchevsky, S. B., Goodpaster, B. H., Newman, A. B., Nevitt, M., Stamm, E., & Harris, T. B. (2002). Leg Muscle Mass and Composition in Relation to Lower Extremity Performance in men and women aged 70 to 79: The Health ABC Study, 897–904.
49. Wu, X., Zhang, S., Liu, Y., Zhang, D., & Xie, B. (2013). Do knee concentric and eccentric strength and sagittal-plane knee joint biomechanics differ between jumpers and non-jumpers in landing? Human Movement Science, 32(6), 1299–1309.
http://doi.org/10.1016/j.humov.2013.03.008
50. Yu, B., Lin, C.-F., & Garrett, W. E. (2006). Lower extremity biomechanics during the landing of a stop-jump task. Clinical Biomechanics, 21(3), 297–305.

![Table 3. vGRF Biomechanics Excellent Poor P Cohen's d n Mean (SD) 95% CI n Mean (SD) 95% CI Total vGRF 21 3268.84 (823.01) [2916.8, 3620.9] 21 3443.87 (692.55) [3147.7, 3740.1] 0.460 0.23 Peak vGRF symmetry normalized to BW 21 0.43 (0.35) [0.3, 0.6] 21 0.](https://thumb-us.123doks.com/thumbv2/123dok_us/8334420.2211911/34.1188.110.1105.297.568/table-biomechanics-excellent-poor-cohen-total-symmetry-normalized.webp)
