Hungarian Association of Agricultural Informatics European Federation for Information Technology in Agriculture, Food and the Environment
Journal of Agricultural Informatics. Vol. 9, No. 3 journal.magisz.org
Overview of the decision support system and fruit growth stages to predict the
action threshold in order to control the apple scab in Kosovo
Edmond Rexhepi1, Harallamb Paçe2, Hekuran Vrapi3, Arbenita Hasani4
I N F O
Received 25 Mar 2018 Accepted 16 Oct 2018 Available on-line 30 Dec 2018 Responsible Editor: M. Herdon
Keywords: DSS, infection, index, scab, treatment.
A B S T R A C T
________________________________________________________________________ The apple scab caused by the fungal pathogen Venturia inaequalis (Cooke) G. Winter is a continuous problem for apple farmers in Kosovo. From this disease, the fruits become scabby brown or black spotty, losing their value. The fruit infection from A. scab requires immediate and multi time treatment. In the agricultural market, there are several plant protection products integrated in to various treatment variants provided by chemical manufacturers to control the apple scab infections. The purpose of this study was to identify the best action threshold based on the prediction of the infection risk provided by one decision support system (DSS RIMpro) and based on the empirical point of view by selecting few fruit growth stages from BBCH scale to control this disease in the research zone. Therefore, two different treatment intervals were used and eight treatment variants consisting of several fungicides were created. The research is carried out in one experimental orchard in cultivation with Starking apple cultivar. Based on analysed disease index on infected fruits, the treatment intervals were compared with each other to conclude the best action threshold for Kosovo conditions.
_______________________________________________________________________
1. Introduction
In the commercial orchards throughout country of Kosovo, one of the major cultivated fruit species is the apple (Malus domestica Borkh.). The structure of main cultivars is created from ‘Golden delicious’, ‘Starking’, ‘Gala’ and ‘Granny Smith’. Other cultivars such as ‘Fuji’, ‘Jonagold’ and ‘Braeburn’ continue to be planted. In terms of susceptibility to the diseases and pests, the apple ‘Starking’ cultivar is known as very sensitive among the other cultivars. Taking in to consideration that ‘Starking’ cultivar is being cultivated mostly in the country, the apple scab disease remains the challenge and threat for local growers, especially in wet seasons when the disease can develop faster. This problem causes the fruit cultivation reduction which directly affects the export of the fruit, increases the import to the country which then effects the local growers to remain in solid position in the market.
1Edmond Rexhepi
Agricultural University of Tirana, Department of Plant Protection, Faculty of Agriculture and Environment. Tirana, Albania
[email protected] 2Harallamb Paçe
Agricultural University of Tirana, Department of Plant Protection, Faculty of Agriculture and Environment. Tirana, Albania
[email protected] 3Hekuran Vrapi
Agricultural University of Tirana, Department of Plant Protection, Faculty of Agriculture and Environment. Tirana, Albania
[email protected] 4Arbenita Hasani
Therefore, the disease needs to be controlled with fungicides. Depending on the risk of disease, 10 to 15 or even more fungicidal applications are usually needed for efficient control (Meszka, 2015). The number of treatments depends on cultivar susceptibility, the amount of source infection and weather conditions, mainly air temperature, leaf wetness, relative humidity and rainfall (Mills, 1946; MacHardy and Gadoury, 1989; Stensvand et al., 1998). Important losses occur also due to the development of scab in storage (R. Tomerlin, 1983).
The overall goal of this study was to develop one action threshold with optimal time interval to realize the fungicide treatments to control the apple scab in Kosovo. If the primary infections are not managed successfully on adequate timeframe in the spring, then the secondary infections should remain in high level resulting in the fruit drop during the summer and overall fruit loss in the harvest time. In wet seasons and with temperature increment, the secondary scab infections from conidia will require few fungicidal applications. This study had three main objectives: a) the 1st objective was to
start utilizing the DSS in Kosovo plant protection sector; b) the 2nd objective was to analyse the
nowadays best decision support system in the market with some selected apple growth stages for predicting the best action threshold to start the treatments to prevent and control the scab disease; c) the 3rd objective was to compare a few treatment variants composed with different fungicides that
would perfectly fit in the best action threshold derived from analysis of the treatment intervals. Actual trends in disease management intent to skip the excessive high number of treatments, which involve risks to human health and the environment, and motivate the use of decision support systems (DSSs) (Rossi et al., 2012).
2. Materials and methods
2.1. Location and duration
This research was accomplished in region of Gjilan, country of Kosovo, during three years 2015-2017. The experimental orchard is in ‘Starking’ cultivation.
2.2. Experimental design
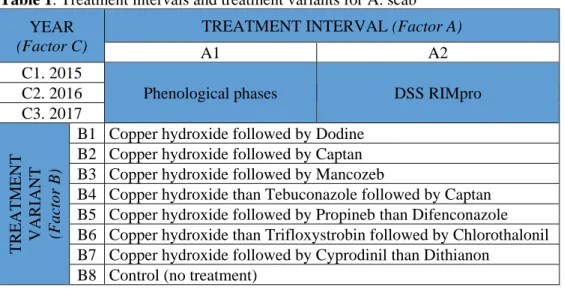
The experimental design is set up in two factorial randomized block with four replications and is formed, as shown in table 1; with Factor A for treatment time interval in two levels: A₁. Phenological phases’ threshold; and A₂. RIMpro threshold (relative infection measure program-RIMpro). A₁ - the phenological phases’ threshold, consists from apple growth stages from the BBCH Scale (Meier, 2001), as shown in table 2.
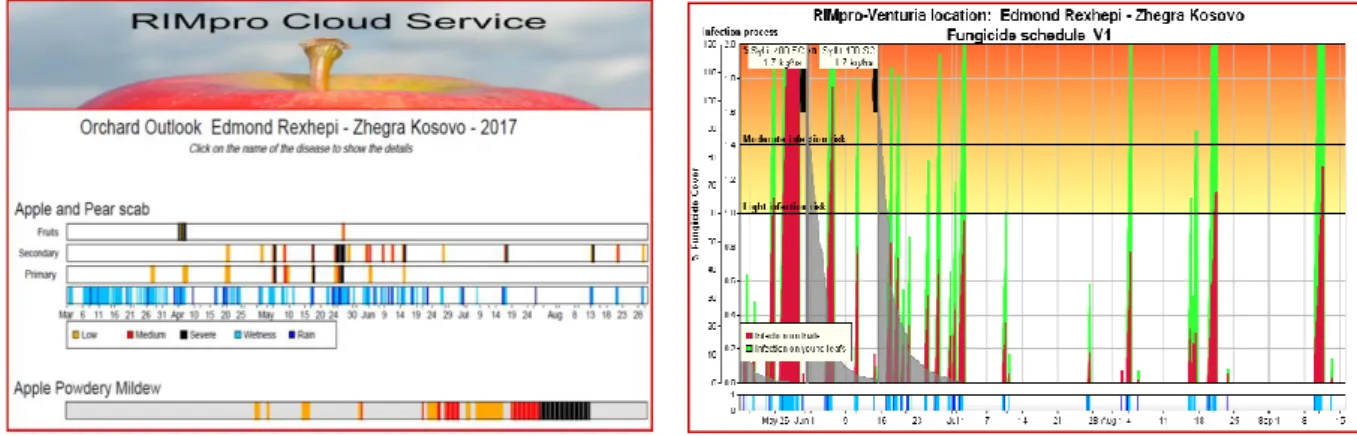
A₂ - the RIMpro cloud service is developed by Bio-Fruit-Advies in Netherlands as decision support system (DSS) that provides predictions in forms of warnings for infection periods to the subscribed farmers and researchers all over the Europe and Northern America that are connected and interact with this online platform (figure 1).
The second effect factor (B) is the treatment variant in eight levels (B₁ - B₈). The levels consist with different fungicides as shown in table 3.
The third effect factor (C) is the treatment year also in three levels: C₁: 2015, C₂: 2016 and C₃: 2017. In this factor the effects of weather conditions dominance were considered for each research year.
Table 1. Treatment intervals and treatment variants for A. scab
YEAR
(Factor C)
TREATMENT INTERVAL (Factor A)
A1 A2
C1. 2015
Phenological phases DSS RIMpro
C2. 2016 C3. 2017
TREAT
MEN
T
VARI
ANT
(Fa
ctor B
)
B1 Copper hydroxide followed by Dodine B2 Copper hydroxide followed by Captan B3 Copper hydroxide followed by Mancozeb
B4 Copper hydroxide than Tebuconazole followed by Captan B5 Copper hydroxide followed by Propineb than Difenconazole B6 Copper hydroxide than Trifloxystrobin followed by Chlorothalonil B7 Copper hydroxide followed by Cyprodinil than Dithianon
B8 Control (no treatment)
Table 2. Phenological growth stages and identification keys of pome fruit. Malus domestica Borkh
(Meier, 2001)
Code Description
10 Mouse-ear stage: Green leaf tips 10 mm above the bud scales. First leaves separating. 67-69 Flowers fading: majority of petals fallen. End of flowering: all petals fallen.
71 Fruit diameter size up to 10mm; fruit fall after flowering. 72 Fruit diameter size up to 20mm.
74 Fruit diameter up to 40mm; fruit erect.
85-87 Advanced ripening: increase in intensity of cultivar-specific colour. Fruit ripe for picking.
2.3. Sampling
On the 23rd of September in each research year, 10 apple fruits from the randomized block trees
were randomly picked for assessment. In the laboratory, 960 fruits were analysed for the disease index which were taken from total of 98 apple trees. For every treatment program, the disease infection level was checked based on the fruit surface area infected by the fungal pathogen V. inaequalis.
2.4. Disease assessment
The disease severity was determined by rating the proportion of scabbed surface of the fruit. Disease severity is a measure of the amount of disease per sampling unit (Nutter et al., 2006). Croxall et al. (1952) reported a standard diagram method for rating the scab severity. Lateur and Blazek (2002) reported standard area diagram (SAD) from 1 to 9 scab intensity scale levels. This scale is modified from 9 to 6 SAD categories and is presented in percentage from 0% to 75% of the fruit surface infected area as shown in table 3 (Hasani, 2005).
I = disease index; ni = number of fruits in respective category; ki = number of each category; N = total number of fruits analysed; K = total number of categories.
Table 3. The Standard Area Diagram (SAD) field key for scab infection assessment on apple fruits
2.5. Plant Protection Products
The fungicides that were used are shown in table 4. The product volumes were prepared and mixed as per manufacturers’ recommendation on the product label. The trees in randomized block and other trees in the orchard were treated also with other plant protection products for preventive measures against other fungal diseases or pests besides the above fungicides which were used especially to control the Apple scab. Other regular agro technical actions were performed for orchard management as well.
2.6. Instruments and software
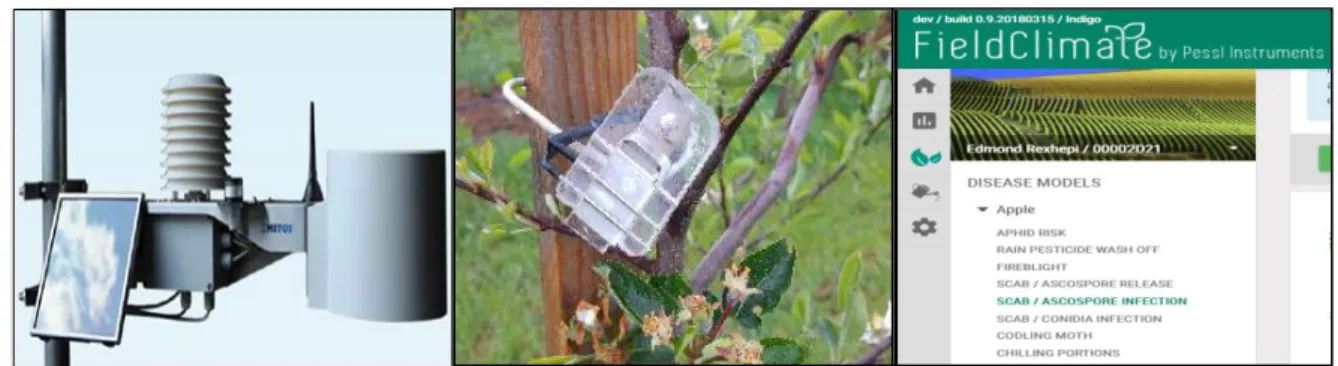
The weather conditions in the orchard and the leaf moisture were monitored and collected by weather station model i-Metos 2 (figure 2). This weather station was set up 2m above the ground in the orchard centre. The leaf moisture data’s are gathered by two specific sensors: one sensor was set up inside the apple tree wreath and other sensor was positioned outside the tree wreath. This station is produced and configured by Pessl Instruments GmbH from Austria. The collected data were sent out by the station every 15 minutes to the field-climate platform which is managed by the same inventor/company and after processing in the system, the information or warnings were provided in real time to the researcher/farmer through the same platform. The information was accessible with login in to the field-climate webpage through personal computer and smart phone application.
Figure 2. i-Metos 2, wetness sensor and FieldClimate platform view
The fungicide application was performed with Villager® spraying pump, model VBS with volume capacity of 16 litters and with spraying pressure: 2.6 - 4.0atm.
SAD Field Key for Venturia inaequalis
Fruit
Category 0 1 2 3 4 5
Intensity level
Nothing noticed
Light intensity
Medium intensity
Strong intensity
Very strong intensity
Destructive intensity
Infection level
0% fruit surface infected
0.1 - 10% fruit surface
infected
10.1 - 25% fruit surface
infected
25.1 - 50% fruit surface infected
50.1 - 75% fruit surface
infected
Table 4. Composition of treatment variants with fungicides
2.7. Statistical analysis
For statistical data analysis are used two applications: 1. Assistat® version 7.7 for mean values and standard deviation for treatment variants; 2. JMP® 14.0 is used for Dunnet’s and Tukey-Kramer HSD test for comparison of mean values for disease index and diamond/circles plots.
3. Results and Discussion
The assessment results for disease index on apple fruits of Starking cultivar, during three research years are presented on the table 5. The average disease index evaluated on phenological phases’ threshold begins with 9.3% in 1st treatment variant which is classified with letter C, then followed by
letters BC in 2nd treatment variant with disease index value of 13.0% and up to 21.4% in control
variant followed by letter A. The average disease index for DSS RIMpro threshold begins with 7.5% in 1st treatment variant followed by letter C than increases to 11.3% in 2nd variant followed by letter B
and slightly increases in other variants but without any significant difference since it is followed by same letter and ends up to 20.4% in control group classified by letter A, as per Tukey-Kramer HSD test. The comparison of three-annual disease index averages from two treatment intervals, shows that RIMpro threshold has average disease index of 12.67% which is lower than phenological phases’ threshold with disease index 14.33%.
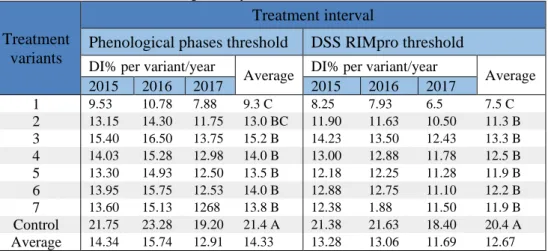
Table 5. Disease Index (I %) data analysed on ‘Starking’ fruits for eight treatment variants realized in
two treatment intervals during three years.
Treatment variants
Treatment interval
Phenological phases threshold DSS RIMpro threshold
DI% per variant/year
Average DI% per variant/year Average
2015 2016 2017 2015 2016 2017
1 9.53 10.78 7.88 9.3 C 8.25 7.93 6.5 7.5 C
2 13.15 14.30 11.75 13.0 BC 11.90 11.63 10.50 11.3 B
3 15.40 16.50 13.75 15.2 B 14.23 13.50 12.43 13.3 B
4 14.03 15.28 12.98 14.0 B 13.00 12.88 11.78 12.5 B
5 13.30 14.93 12.50 13.5 B 12.18 12.25 11.28 11.9 B
6 13.95 15.75 12.53 14.0 B 12.88 12.75 11.10 12.2 B
7 13.60 15.13 1268 13.8 B 12.38 1.88 11.50 11.9 B
Control 21.75 23.28 19.20 21.4 A 21.38 21.63 18.40 20.4 A
Average 14.34 15.74 12.91 14.33 13.28 13.06 11.69 12.67
Tukey-Kramer HSD test at a level of 5% of probability was applied. The averages not connected by the same letter are significantly different.
The One-Way Analysis of Variance (ANOVA) for assessment of the scab disease index (I %) on fruits for three years that is presented in table 6, shows statistically proven differences between the fungicide treatment variants in both treatment intervals. The fungicide treatment variants performed in
Treatment variant
Activity Producer Treatment variant Activity Producer
Nr. Fungicide Nr. Fungicide
1 Champion 50WG Contact Nufarm
5
Champion 50WG Contact Nufarm
Syllit 400SC Contact Agriphar Antracol 70WP Contact Bayer
2 Champion 50WG Contact Nufarm Score 250EC Systemic Syngenta
Captan 80WG Contact Arysta
6
Champion 50WG Contact Nufarm
3 Champion 50WG Contact Nufarm Zato 50WG Systemic Bayer
Mancosav 80WP Contact Agrosava Daconil 720SC Contact Syngenta
4
Champion 50WG Contact Nufarm
7
Champion 50WG Contact Nufarm
Folicur 250EW Systemic Bayer Chorus 50WG Systemic Syngenta
Captan 80WG Contact Arysta Daneel 700WG Systemic BASF
statistically proves the significance comparing to theoretical values from Fisher’s table for both levels of probability, for P=0.05 is 2.76 and for P=0.01 is 4.27. The statistical significance is also verified for repetitions factual value with theoretical values for both levels of probability.
The fungicide treatment variants conducted as per DSS RIMpro action threshold resulted with factual F value of 185.94** which is again greater than theoretical values as per Fisher’s table for two levels of authenticity, respectively for P=0.05 is 2.76 and for P=0.01 is 4.27. By comparing the repetitions value of this treatment interval with those from Fisher’s table, it results with significant difference for both levels of probability.
Table 6. One-Way Analysis of Variance (ANOVA) of disease index (DI %) evaluated on fruits for
eight treatment variants performed in two treatment intervals during three years.
Interval Sources of
variation D.F S.S M.S
F Values
Factual Theoretical
95% 99%
Phenological phases threshold
Treatments 7 233.5346 33.36208 281.782** 2.76 4.27
Repetitions 2 32.13578 16.06789 135.712** 3.73 6.51
Error 14 1.65752 0.118397 - - -
Variation total 23 267.3279 - - - -
RIMpro threshold
Treatments 7 271.714 38.81642 185.94** 2.76 4.27
Repetitions 2 11.86 5.931838 28.416** 3.73 6.51
Error 14 2.9224 0.208747 - - -
Variation total 23 286.501 - - -
**Significant at a level of 1% of probability (P < 0.01); *Significant at a level of 5% of probability (0.01 = < P < 0.05); ns: Non-significant (P > = 0.05).
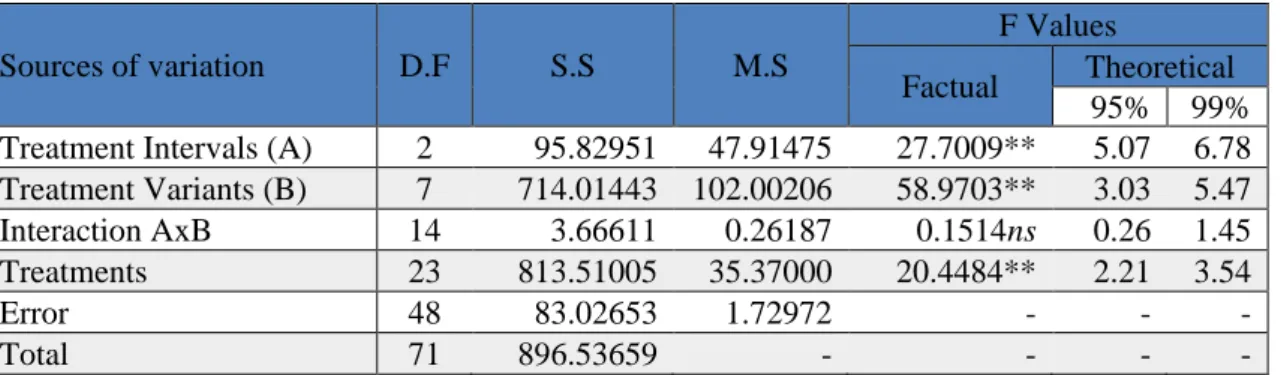
The Two-Way Analysis of Variance (ANOVA) of the apple scab disease index (I %) evaluation on scabby fruits for three years, presented on table 7, shows the statistical significance for treatment intervals and treatment variants. The effects of factor A (treatment interval) and factor B (treatment variant) are significantly different, based on factual F value of 27.7009** for factor A which is greater than both theoretical Fisher’s table values 5.07 for level of 1% of probability and 6.78 for level of 5% of probability. The factual F value for factor B is 58.9703** results to be greater than theoretical Fisher’s table values, for P=0.05 is 3.03 and for P=0.01 is 5.47. The effects of the interaction between both factors AxB, the factual F value is 0.1514ns and resulted to be lower than theoretical values as per Fisher’s table for both levels of authenticity. Therefore, the interaction of these two factors practically had no effect on apple fruits protection.
Table 7. Two-Way Analysis of Variance (ANOVA) of disease index (DI %) evaluated on fruits, for
eight treatment variants performed in two treatment intervals during three years.
**Significant at a level of 1% of probability (P < 0.01); *Significant at a level of 5% of probability (0.01 = < P < 0.05); ns: Non-significant (P > = 0.05).
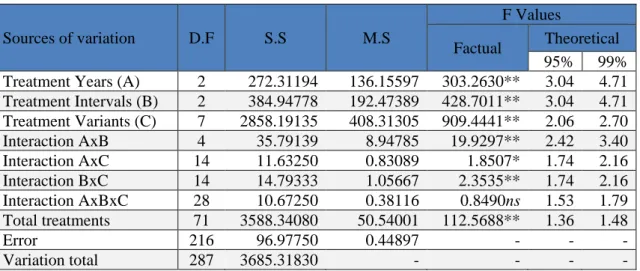
The Multi-factorial Analysis of Variance (M-ANOVA) for A. scab disease index (I %), assessment on ‘Starking’ fruits for three years, that is presented on table 8, proved that this disease is influenced by a few factors. This analysis proves that all treatment factors are statistically different. The effects of
Sources of variation D.F S.S M.S
F Values
Factual Theoretical
95% 99%
Treatment Intervals (A) 2 95.82951 47.91475 27.7009** 5.07 6.78
Treatment Variants (B) 7 714.01443 102.00206 58.9703** 3.03 5.47
Interaction AxB 14 3.66611 0.26187 0.1514ns 0.26 1.45
Treatments 23 813.51005 35.37000 20.4484** 2.21 3.54
Error 48 83.02653 1.72972 - - -
factor A, the treatment years (different weather conditions), resulted with empirical F value of 303.2630** which is greater than both theoretical values from Fisher’s table, such values as 3.04 for the level of 1% probability and 4.71 for the level of 5% probability. The effects of factor B, the treatment intervals (two different action thresholds), resulted with empirical value of 428.7011** which is also greater than both theoretical values from Fisher’s table.
The effects of factor C, the fungicide treatment variants (eight variants with different combination of plant protection products), resulted with empirical value that is greater than both theoretical F values for both levels of probability. The effects of interaction between two factors AxB = 19.9297** resulted to be greater than theoretical F values. The effects of interaction between the factors AxC = 1.8507* resulted to be greater than theoretical F value for only one level of probability. The effects of interaction between other two factors BxC = 2.3535** resulted to be higher than theoretical values from Fisher’s table for both levels of probability as well.
Lastly, the interaction between all treatment factors AxBxC resulted with empirical value of 0.8490ns which is lower than both theoretical Fisher’s table values.
Table 8. Multi-factorial Analysis of Variance (MANOVA) for disease index (DI%) evaluated on
fruits, for eight treatment variants performed in two treatment intervals during three years.
**Significant at a level of 1% of probability (P < 0.01); *Significant at a level of 5% of probability (0.01 = < P < 0.05); ns: Non-significant (P > = 0.05).
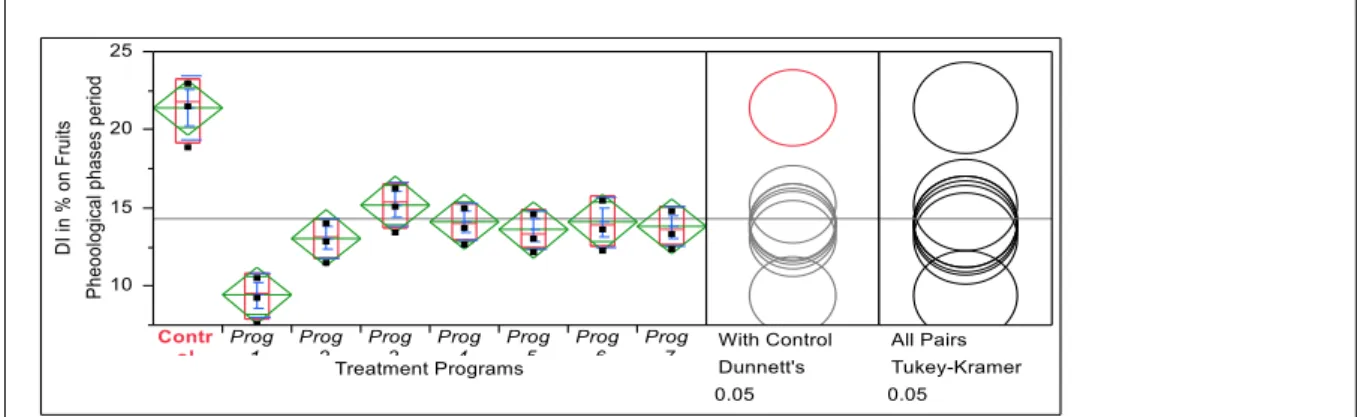
The pairwise comparison between the fungicide treatment variants (programs of treatment) with the control group as per phenological phases’ action threshold, are presented by the diagram of diamonds plot in figure 3. The fungicide treatment variants with grey circles and italicized variable labels, respectively the programs from 1 to 7 are significantly different from the control group, for the level of probability P = 0.05, as per Dunnett’s test. The means of these treatment variants/programs, except the 3rd program, are below the overall average which in this treatment period is 14.33%. The
Tukey-Kramer HSD test pairwise comparison between the treatment variants, shows the significant differences in phenological phases’ action threshold.
The diagram of means diamonds in figure 4, provides the pairwise comparison between the fungicide treatment variants/programs with the control group, for scab disease control on infected fruits, as per DSS RIMpro action threshold. The treatment variants with fungicides marked with grey circles and italicized variable labels, as from 1 to 7, are significantly different from the control program, P = 0.05, as per Dunnett’s test. The treatment variants from 1st to 7th, except the 3rd program,
are below the overall disease index average which in this case for DSS RIMpro action threshold is 12.6%. The 1st fungicide treatment variant has the lowest disease index followed by 2nd and 5th. The
pairwise comparisons performed with Tukey-Kramer HSD test shows that there is a significant difference between the treatment variants (programs of treatment).
Sources of variation D.F S.S M.S
F Values
Factual Theoretical
95% 99%
Treatment Years (A) 2 272.31194 136.15597 303.2630** 3.04 4.71
Treatment Intervals (B) 2 384.94778 192.47389 428.7011** 3.04 4.71
Treatment Variants (C) 7 2858.19135 408.31305 909.4441** 2.06 2.70
Interaction AxB 4 35.79139 8.94785 19.9297** 2.42 3.40
Interaction AxC 14 11.63250 0.83089 1.8507* 1.74 2.16
Interaction BxC 14 14.79333 1.05667 2.3535** 1.74 2.16
Interaction AxBxC 28 10.67250 0.38116 0.8490ns 1.53 1.79
Total treatments 71 3588.34080 50.54001 112.5688** 1.36 1.48
Error 216 96.97750 0.44897 - - -
Figure 3. Diagram of means diamonds (diamond plot) and comparison circles plot for Phenological phase’s action threshold.
Figure 4. Diagram of means diamonds (diamond plot) and comparison circles plot for DSS
RIMpro action threshold.
The top and the bottom points of green diamonds are the confidence intervals (CI), as a supplement to the p value with 95% confidence interval for each mean. The green centre line presents the mean. The width of the diamond is proportional to the size of the sample group. The red boxes represent the distribution and the three blue dots per diamond represent the disease index values for three treatment years. The lower/upper horizontal blue lines are for the standard deviation. The grey and red circles represent the means comparison between the treatment variants/programs. The grey circles with italicized variable labels are for the variants/programs that are significantly different from the control group. The black horizontal centre line of the diamond and circles plot, is the overall average of the disease index per treatment interval.
Depending on the weather conditions, the apple scab infections happens every season in Kosovo and other countries in region but with different severity level. The issues of A. scab disease are checked from the specialists in the region. The latest studies from the regional countries confirm the scab infections every year. In Serbia, Djordevic et al (2013) tested the tolerance and resistance in few apple cultivars to the scab disease. In Albania, the Skenderasi et al (2013) checked in a couple of times the viability of some fungicides to manage the apple scab based on the infection level. Marku et al (2014) in Albania has evaluated the effectiveness of bicarbonates used alone or combined with horticultural oils to fight the apple scab. The primary cultivar used was ‘Starking’ and ‘Golden delicious’ and the scab severity index resulted with close values with this research. Balaz et al., (2017) surveyed the responses of few apple cultivars to apple scab and other diseases under natural infection in Serbia. Rexhepi et al. (2018) in Kosovo has assessed the scab infection level only on apple leaves. No other similar researches of the apple scab control could be found lately for Macedonia and Montenegro. The comparison of findings from similar studies for A. scab severity from other west, central or northern European countries with this research were not performed, since the weather conditions in those sub-climatic zones are slightly different with the research zone in the south-east Europe.
could be due to the strict regime of fungicide treatment that was performed on trial apple trees and overall in the orchard, continuously for three years. Based on the comparison of disease index averages, from all fungicide treatment variants, realized in both action thresholds and in three treatment years, as presented on table 5, it resulted that: 1st treatment program had the lowest disease
index average than any other treatment variant. It seems that this outcome is due to the effects from the fungicide combination of Champion 50WG and Syllit 400SC, which has provided the best fruit protection from the scab infections. The One-Way Analysis of Variance (ANOVA) shows that RIMpro action threshold has the greatest statistical difference comparing to other action threshold. Based on mean comparison in both diamond plots, presented in Figures 3 and 4, it is evidently seen that the first treatment variant which is realized based on the predictions that were provided by DSS RIMpro, had the lowest mean in both treatment intervals.
Based on MANOVA analysis presented on table 8, the effect of interactions between all treatment factors is statistically non-significant. Practically, the small difference of climatic conditions in three treatment years, has not affected the other effects that were derived from treatment variants realized in two action thresholds, and therefore did not change anything significantly regarding the protection of apple fruits from scab infections.
4. Conclusion
Based on the disease index assessed on apple fruits for three years, the second action threshold, a treatment interval predicted by DSS RIMpro and realized through all treatment variants, proved to be the best action threshold. This protection became possible because of the predictions that were received from DSS RIMpro based on weather data collected and provided by weather station from orchard, processed by FieldClimate® platform and sent to RIMpro cloud service for further processing. These predictions from DSS RIMpro were impacted by the information that were provided by the researchers (e.g. green tip date, volumes of used fungicides, etc.). The realization of fungicide spraying on exact time made it possible to create optimal and accurate treatment threshold. Therefore, the DSS RIMpro provided the best treatment interval for all treatment variants execution.
The first treatment interval consisted by six phenological phases of the apple cultivar provided very good action threshold which must be seriously considered to be used by the apple growers in this area. Especially those that do not have the possibility to be connected and to interact with DSS RIMpro or any other decision support system to control the apple scab.
Among the treatment variants, from all treatment intervals, in all three years, it appeared that the first treatment variant, which was composed with fungicides, such as Champion 50WG and Syllit 400SC, had the lowest disease index and provided the best fruit protection from scab infection.
References
Balaz, J., Ognjanov, V., Keserovic, Z., Sucur, A., Janse, J., Popovic, T., (2017). Evaluation of reactions of commercial and autochthonous apple cultivars to common diseases in Serbia under natural infection. Pestic. Phytomed. (Belgrade), 32(3-4), 2017, 157–172. https://doi.org/10.2298/PIF1704157B
Carisse, O., Meloche, C., Boivin, G., Jobin, T., (2009). Action Thresholds for Summer Fungicide Sprays and Sequential Classification of Apple Scab Incidence. Plant Dis. 93, 490–498. https://doi.org/10.1094/PDIS-93-5-0490
Cooke B.M., Jones, D.G., Kaye, B. (2006). The Epidemiology of Plant Diseases. 2nd edition. ISBN-10 1-4020-4580-8(PB). ISBN-ISBN-10 1-4020-4581-6 (e-books). Springer, P.O. Box 17, 3300 AA Dordrecht, Netherlands. https://doi.org/10.1094/PDIS-93-5-0490
Croxall, H.E., Gwynne, D.C. & Jenkins, J.E.E., (1952). The rapid assessment of apple scab on fruit. Plant Pathology, 2, 89-92. https://doi.org/10.1111/j.1365-3059.1952.tb00038.x
Djordjevic B., Vulic T., Djurovic D., Milatovic D., Zec G., Radovic A. (2013). Biological and productive characteristics of apple cultivars resistant or tolerant to scab [Venturia inaequalis (Cooke) Wint.]. Journal of Agricultural Sciences, Belgrade, Serbia. Vol. 58, Nr.2, Pg 95-103.
https://doi.org/10.2298/JAS1302095D
Gadoury, D.M., Stensvand, A., Seem, R.C., (1998). Influence of light, relative humidity, and maturity
of populations on discharge of ascospores of Venturia inaequalis. Phytopathol. 88(09): 902-909.
https://doi.org/10.1094/PHYTO.1998.88.9.902
Hasani, M., (2005). Sëmundjet e pemëve frutore. Publikuar në Universiteti Bujqësor i Tiranës. Tirana: Albania, fq. 88-98.
Lateur, M. and Blazek, J., (2004). Evaluation descriptors for Malus. Report of a Working Group on Malus/Pyrus. Second Meeting 2–4 May 2002, Dresden-Pillnitz, Germany. L. Maggioni, M. Fischer, M. Lateur, E.-J. Lamont, E. Lipman (Compilers). – International Plant Genetic Resources Institute, Rome, Italy, pp. 76–82.
MacHardy, W.E., Gadoury, D.M., (1989). A revision of Mill’s criteria for predicting apple scab infection periods. Phytopathology 79, 304–310. https://doi.org/10.1094/Phyto-79-304
Marku, L., Vrapi, H., Varaku, K., Hasani, M. (2014). Integrated management for Apple scab Venturia inaequalis (Cooke) Wint. in the region of Puka in Albania. – IJGHC, March 2014–May 2014, 3(2):524–531, E-ISSN: 2278-3229.
McKinney, H.H., Davis, R.J., (1925). Influence of soil temperature and moisture on infection of young wheat plants by Ophiobolus graminis. J. Agric. Res. 31.
Meier, U., (2001). Growth stages of mono and dicotyledonous plants. BBCH Monograph. 2nd ed. German Federal Biological Research Centre for Agriculture and Forestry. Braunschweig, Germany, pp. 158.
Meszka B (2015). Study of Venturia inaequalis pseudothecia development and apple scab severity under Polish conditions. Research Institute of Horticulture Pomologiczna 18, 96-100 Skierniewice, Poland. Folia Hort. 27/2: 107-114. https://doi.org/10.1515/fhort-2015-0020
Mills,W. (1946). Effect of temperature on the incubation period of apple scab. N.Y. State Coll. Agric.Weekly News Lett. Insect Pests Plant Dis. 24–25.
Nutter, F.W., Esker, P.D., Coelho Netto, R.A., (2006). Disease assessment concepts and the advancements made in improving the accuracy and precision of plant disease data, in: Plant Disease Epidemiology: Facing
Challenges of the 21st Century. Springer Netherlands, Dordrecht, pp. 95–103. https://doi.org/10.1007/1-4020-5020-8_7
Pethybridge, S. J., and Nelson, S. C., (2015). Leaf Doctor: A new portable application for quantifying plant disease severity. Plant Dis. 99:1310-1316. https://doi.org/10.1094/PDIS-03-15-0319-RE
Rexhepi, E., Paçe, H., Vrapi, H., Hasani, A., 2018. Scab infection management on apple leaves in western Balkans. Journal of Agricultural Science. 1(29):41–49.
Rossi, V., Caffi, T., and Salinari, F. (2012). Helping farmers face the increasing complexity of decision-making for crop protection. Phytopathol. Mediterr. 51, 457–479. doi:
10.14601/Phytopathol_Mediterr-11038
Skenderasi B., Mero G.J., Zeka N., Hasani M., Cara M. 2014. Determination of terms and effectiveness of fungicides more convenient in apple scab control in Korça region in Albania. – J. Int. Acad. Res. for Multidiscip., 1(12):333–346.
Stensvand, A., Amundsen, T., Semb, L., Gadoury, D.M., Seem, R.C. (1998). Discharge and dissemination of ascospores by Venturia inaequalis during dew. – Plant Dis., 82(7):761–764, doi: 10.1094/PDIS.1998.82.7.761.
https://doi.org/10.1094/PDIS.1998.82.7.761
Tomerlin, J.R., Jones, A.L., (1983). Development of apple scab on fruit in the orchard and during cold storage. Plant Dis. 67: 147-150. https://doi.org/10.1094/PD-67-147
Vaillancourt, L., R. Hartman, J., (2000). Apple scab. The Plant Health Instructor. Updated, 2005. APS Press.