Effect of fertilizer with different fish stocking on the yield of
an integrated rice-fish polyculture farming system
Md. Shamim Parvez
1*, Ashim Gosh
2, Md. Jahidul Hasan
3, Farhana Ahmed
2, Md. Forhadur Reza
2,
Lipton Sardar
3, M. Aminur Rahman
4, Md. Masum Billah
51Laboratory of Marine Biotechnology, Institute of Bioscience, Universiti Putra Malaysia, 43400 UPM Serdang, Selangor, Malaysia, 2Department of Fisheries, Matshya Bhaban, Ramna, Dhaka, Bangladesh, 3Department of Fisheries, Fish Inspection and Quality Control laboratory, Khulna, Ministry of Fisheries and Livestock, Bangladesh, 4Fisheries and Marine Bioscience, Jashore University of Science and Technology, Bangladesh, 5Department of Land Management, Faculty of Agriculture, Universiti Putra Malaysia, 43400 UPM, Serdang, Selangor Darul Ehsan, Malaysia
ABSTRACT
An experiment was conducted in the rice field plots with developing the infrastructure 30 m2 to determine the appropriate fertilization effects
for the freshwater fish Tilapia and Carp Fish species cultured along with the rice-fish farming system in the plots. There were setting up three systems to assess the effect of fish species on tiller yield, regarding for fish species, i.e., no fish stocking with rice (C), tilapia with rice (FT), and carp fish with rice (FC). Each treatment of fish species cultured with different doses of fertilizer such as (T0) control: Without any fertilization; (T1) with 100% recommended fertilizer (RF); (T2) with 75% RF; (T3) with 10t compost fertilizer; (T4) with 5t compost fertilizer + 75% RF, and rice culture with 5t compost fertilizer + 50% RF. The maximum number of the plant in the tiller was found in carpio fish (FC) species (7.02 no/tiller and 82.95 cm/tiller) whereas lowest in FT (6.40 no/tiller and 81.65 cm/tiller) during 75 day after transplantation. In regard of fertilizer application,
the highest height was observed in FC on an average 31.71, 53.28, and 73.06 cm/tiller during 30, 40, and 60 DAT, respectively, whereas followed
by F0 (31.92, 52.43, and 72.31 cm/tiller at 30, 45, and 60 DAT) and FT (30.28, 49.76, and 67.25 cm/tiller at 30, 45, and 60 DAT), respectively, in which there was found no significant differences (P > 0.05) among different treatments. The rice yield in carpio fish, the fertilizer treatment
T4 (7.30 ± 1.86 kg/m2) was significantly higher than those of other treatments (7.16 ± 2.78, 6.83 ± 2.88, 6.67 ± 1.44, 6.17 ± 1.84, and 4.06 ±
1.76 kg/m2 in treatments T
5, T3, T2, T1, and T0, respectively). The yields of fish were significantly faster (P < 0.05) in treatments T4, (11.70 ±
3.86 kg/m2) than other fertilizer treatments T
5 (11.25 ± 3.56 kg/m2), T3 (10.85 ± 5.76 kg/m2), T2 (10.80 ± 5.55 kg/m2), T1 (9.90 ± 4.66 kg/m2),
T0 (4.78 ± 3.48 kg/m2) and in F
C and also compared to all other fertilizer treatments in FT. In regard of straw, the yields were significantly faster
(P < 0.05) in treatments T4, (13.76 ± 6.24 kg/m2) and followed by T
5 (13.55 ± 4.42 kg/m2), T3 (12.88 ± 6.24 kg/m2), T2 (10.75 ± 4.65 kg/m2),
T1 (10.65 ± 3.36 kg/m2), T
0 (4.28 ± 3.86 kg/m2) and in FC and also compared to all other fertilizer treatments in FT. The outcome in T4 gave
the highest returns among all treatments, followed by treatments T5, T3, T2, T1, and T0 indicating that the combination of basal fertilization and
compost fertilizer is the most appropriate nutrients input regime for the rice-carp fish integrated culture system.
Keywords: Effect, fertilization, integrated polyculture, rice-fish farming, yields
Submitted: 21-11-2019, Accepted: 28-11-2019, Published: 29-12-2019
INTRODUCTION
Rice is an essential food crop in all around the world, with
differentiated varieties full-grown on 157 million ha worldwide
in an extensive variety of natural conditions and water management. It is the main food for over 50% population
of the world with yearly yields of 652 million in 2007. The
concurrent of rice-fish farming, rice-fish culture is one of the
best opportunities to increase food production from restricted ecological agricultural land.[1,2] It is experienced in various countries of the world, mainly in Asia.[3] There has been
practiced rice-fish culture for at least 1700 years in China.[4,5] According to Lu and Li,[6] it is recorded by Food and Agriculture
Organization of the United Nations and the United Nations
Address for correspondence: Md. Shamim Parvez, Laboratory of Marine Biotechnology, Institute of Bioscience, Universiti Putra
Malaysia, 43400 UPM Serdang, Selangor, Malaysia. E-mail: [email protected]
Original Article
Educational, Scientific and Cultural Organization as one of the
Globally Important Ingenious Agricultural Heritage Systems in 2005, attributable to its long history and expanded examples and strategies.[6]
Fish farming in rice fields improves the utilization of land and water and yielding more fish and rice, combined with
more economic yields than the monoculture of rice.
Within the rice-fish ecosystem, plants and fish complement
and interact with each other.[7,8] Rice fields are exceptionally
profitable as far as both quantity and natural variety of food
organisms for fish. Most of the Asian countries additionally endorse fish farming in the rice fields through integrated pest management (IPM) and it is the real method to increase the yields in the rice fields by harvesting both of rice and fish.[5,9]
The acceptance of rice-fish farming decreased due to the
use of chemicals and pesticides in rice yields. Now, it is increasing due to reduce the utilization of levels of pesticide
and the higher economic returns had received from fish and improved rice yield. In traditional rice-fish farming, there are stocked mainly herbivorous fish species such as grass
carp Ctenopharyngodon idella (Valenciennes, 1844), silver
barb Barbodes gonionotus (Bleeker, 1850), and tilapia (Oreochromis spp). The profits of rice-fish farming go beyond yielding extra fish in the rice field. In the rice fields, the fish can control the pests and weeds, acknowledging IPM. Regarding the fish manure like as a fertilizer, which increases
the availability of nutrient to the rice crop.[2,10-12] Rice-fish
farming conserves the ecological-stability in rice field that
may not only be a higher yielding but also a more sustainable farming system.[13,14] In China and Indonesia, the rice-fish farming system is known to increase yields of rice from 5%
to 35% and yield about 150 kg/ha/crop of fish in extensive systems, and up to 800 kg/ha/crop afterward agricultural by-products are given as fish feed and fertilizer.[5,9]
Fertilization in the rice-fish farming is a crucial management exercise for enhancing rice and fish production; the
farmers are utilizing fertilizer in a variety of doses which may sometimes be 3 or 4 times higher than that of the
standard dose, hopeful more benefit. However, presently
crisis of the inorganic fertilizer in the country is an acute
problem. As well, the agriculturalists are facing financial
loss to buy excess fertilizer. However, there is done a little work to determine the standard dose of fertilizer need for
the maximum yields from rice-fish farming. Therefore, it is important to undertake investigations to find out the standard dose of fertilizer for higher fish and rice production.
Considering the above scenario, the present study was carried out to determine the optimal dose of fertilizer used
in rice-fish farming.
MATERIALS AND METHODS
The experiment was conducted using a completely randomized
block design in 54 (3 × 6 × 3) plots of 15 (5 × 3) m2 rice
fields, each with a transversal trench of 1.2 × 5 × 0.7 m (width × length × depth), at the Bangladesh Agricultural University (BAU), Mymensingh, Bangladesh, during Boro
season, i.e., 2nd August 2017 to 2nd December 2017, a period for 112 days. The experiment was set with the variety of BRRI
Dhan -29 with two factors, i.e., fish species and fertilizer rate.
The experimental design is shown in Table 1. To assess the
effect of fish species on tiller yield, no fish stocking with rice considered as the control (C), the treatment was rice + Tilapia fish (FT) and rice + Carpio fish (FC).
To assess the effect of fertilizer on tiller yield in the rice field,
six treatments were designed, as shown in Table 2.
There were six treatments in triplicate: (T0) Control: Rice culture without any fertilization; (T1) rice culture with 100% recommended fertilizer (RF); (T2) rice culture with 75% RF; (T3) rice culture with 10t compost fertilizer; and (T4) rice culture with 5t compost fertilizer + 75% RF, and rice culture with 5t compost fertilizer + 50% RF. The fertilization rate was
calculated based on the rice platform area. The application of RF is given by the following Table 3.
Table 1: Trials using different fish species
Treatment Stocking fish species
C No fish stocking
FT Stocking tilapia fish
FC Stocking carpio fish
Table 2: Trials using different fertilizer as a nutrient
Treatment Fertilizer dosages
T0 No fertilizer
T1 100% recommended fertilizer T2 75% recommended fertilizer
T3 10 t compost fertilizer
T4 5 t compost fertilizer+75% recommended fertilizer
Table 3: Recommended fertilizer dose (g/plot)
Name of fertilizer Fertilizer dose (g/plot)
100% 75% 50%
Urea 375 281.25 187.50
TSP 180 135.00 90
MOP 150 112.50 75
Gypsum 90 67.50 45
ZnSo4 15 11.25 7.50
The rice fields were flooded with canal water to soak the soil
for a week and then tilled repeatedly until the soil became
puddled. L-shaped canal was constructed at the periphery of chatal (field) of each plot with the same area. Before 2 days transplanting, liming was applied at a rate of 6 kg CaCO3 per
plot. Plastic sheets were set up around every plot (50 cm above and 30 cm below the platform level) to prevent seepage and predator invasion. The mesh size (2 m × 1 m) nets were fencing surrounding the fields from escaping and also protecting the fish from the predators.
Rice seedlings (BRRI dhan – 29) were transplanted at 25 cm × 25 cm spacing at a rate of four seedlings per hill (a
small bunch of rice seedling thrust into the mud is called a
“hill”). Water depth in rice fields and trenches was maintained at 5–10 cm and 75–80 cm during the 1st month, and 10–15 cm
and 80–85 cm during the rest of the culture period, respectively.
Manual weeding was carried out at the 20th and 40th DAT.
Fingerling of fish on a normal size 1.5 g was stocked in the rice fields with a density of 6 fingerlings/m2 of an aggregate
zone (10 prawns/m2 of trench region) on the third DAT. Rice development execution was controlled by checking the number and stature of tillers per slope in arbitrarily chose ten slopes for
every plot at 30, 45, 60, and 75 DAT. Rice collected from each
plot was cleaned, dried, and weighed after drying. The grain weight was balanced to 14% dampness content.[15]
Water quality in ditches was resolved for DO and temperature at 06:00–07:00 h, at 10 cm beneath the water surface with a YSI oxygen meter (show 58 Yellow Springs Instruments, Yellow Springs, OH, USA). Coordinated water tests of the whole
water segment were taken fortnightly close to the focal point
of each trench at 08:00 h for examinations of pH, add up to
solids, add up to unpredictable solids total volatile solids, add up to alkalinity, add up to hardness, add up to smelling salts
nitrogen total ammonia nitrogen nitrite-N (NO2-N), nitrate-N (NO3-N), add up to phosphorus total phosphorus, disintegrated orthophosphate (PO4-P), and chlorophyll–a.[16]
Unionized smelling salts nitrogen was figured utilizing a transformation table for separate pH and temperature.[17] Secchi
circle perceivability was estimated utilizing a Secchi plate at the season of water inspecting.
Water was provided to the rice-fish plots by shallow pump
when the water level was dropped and constantly kept up
at 40 cm–50 cm of the chatal’s (field) tallness amid the
exploratory period. DO was estimated each fortnight at
7 am and again at 4 pm. pH esteem was likewise recorded at
similar occasions individually. Temperatures were additionally recorded fortnightly with a thermometer in the meantime. Alkali was recorded at 8 am fortnightly. All parameters for observing the water quality were estimated utilizing the
HACH test Kit (show FF1A). The information was computing
and investigating.
The growth performance of fish and rice and water quality parameter was analyzed for significant differences among treatments using ANOVA.[18] Differences were considered to
be significant at the level of 0.05. All means were given with
standard error.
RESULTS
In regard of fish species, the effects of fish species on tillers
number of rice in each hill increased quickly in the vegetative phase and attained in maximum number during the reproductive phase and then reduced in the ripening phase. In regard of tiller
number in each hill, no significant differences (P > 0.05) were
found among different treatments. The maximum number
of plants in the tiller was found in (FC) carpio fish species (7.02 no/tiller) whereas followed by F0 (6.07 no/tiller) and FT (6.40 no/tiller) during 75 DAT [Figure 1].
The highest number was observed in FC on an average 4.05,
5.86, and 6.61 no/tiller during 30, 40, and 60 DAT, respectively,
whereas followed by F0 (4.05, 5.85, 6.34, and 6.76 no/tiller at 30, 45, 60, and 75 DAT) and FT (3.84, 5.62, 6.01, and 6.4 no/tiller at 30, 45, 60, and 75 DAT), respectively.
On the other hand, the effects of fish species on tillers height
of rice in each hill were also rapidly increased in the vegetative phase and attained in maximum height during the reproductive phase and then also reduced in the ripening phase. In regard to
tiller height in each hill, no significant differences (P > 0.05)
were found among different treatments. The maximum height
of the plants in the tiller was found in (FC) carpio fish species (82.95 cm/tiller) whereas followed by F0 (81.65 cm/tiller) and
FT (78.04 cm/tiller) during 75 DAT [Figure 2].
The highest height was observed in FC on an average 31.71, 53.28, and 73.06 cm/tiller during 30, 40, and 60 DAT,
respectively, whereas followed by F0 (31.92, 52.43, and 72.31 cm/tiller at 30, 45, and 60 DAT) and FT (30.28, 49.76, and 67.25 cm/tiller at 30, 45, and 60 DAT), respectively
[Figure 2]. In regard to fertilizer application, the effects of fertilizer on the tillers number of rice plants in each hill were found the same growth condition in the vegetative phase and reached in maximum number during the reproductive phase while gradually reduced in ripening phase. In regard to tiller
number per hill, no significant differences (P > 0.05) were
found among different treatments. The maximum number of plants in the tiller was found in T4 (6.06, 7.06, 7.86, and 9.53 no/tiller in different 30, 45, 60, and 75 DAT, respectively)
whereas lowest values were found in T0 (4.46, 5.26, 6.66, and 7.53 no/tiller in different 30, 45, 60, and 75 DAT, respectively)
[Figure 3]. According the highest number was found in T5
(5.20, 6.80, 7.13, and 8.06 cm/tiller), T3 (4.80, 6.20, 6.86, and 7.86 cm/tiller), T2 (4.73, 5.86, 6.73, and 7.73 DAT), and
T1 (4.6, 5.46, 6.80, and 7.66 DAT) during 30, 40, 60, and 75
DAT, respectively [Figure 3]. On the other hand, the effects of fertilizer on tillers height of rice per hill were also growing fast and the maximum was found in the vegetative and reproductive phase and then also reduced in the ripening phase. In regard to
tiller height in each hill, no significant differences (P > 0.05)
were found among different treatments.
According the highest height was found in T4 (33.06, 54.93, 74.26, and 85.46 cm/tiller) whereas, followed by T5 (32.33, 51.33, 70.60, and 80.86 cm/tiller), T3 (32.00, 50.93, 68.93, and 78.40 cm/tiller), T2 (31.06, 49.66, 67.26, and 75.66 cm/tiller),
T1 (30.73, 47.33, 65.86, and 74.33 cm/tiller), and T0 (30.53, 46.46, 56.33, and 72.53 cm/tiller) during 30, 40, 60, and 75
DAT, respectively [Figure 4]. The highest growth plant in height was observed in T1 than the other treatments but there
was no significant difference (P > 0.05) [Figure 4].
Table 4 shows that the mean higher yield of fish was obtained from fertilizer treatment (T4) in stocking carp fish species (FC) 7.30 ± 1.86 kg/m2 compared to all other fertilizer treatments in
stocking carp and tilapia fish species. The yield of fish in FC with T4 was significantly differed (P < 0.05) among all other fertilizer
treatments in FC and FT fish species. The mean gross yield of rice was recorded significantly higher (P < 0.05) in treatment T4,
(11.70 ± 3.86 kg/m2) than other fertilizer treatments T
5 (11.25 ±
3.56 kg/m2), T
3 (10.85 ± 5.76 kg/m2), T2 (10.80 ± 5.55 kg/m2), T1 (9.90 ± 4.66 kg/m2), T
0 (4.78 ± 3.48 kg/m2) and in FC and also compared to all other fertilizer treatments in FT.
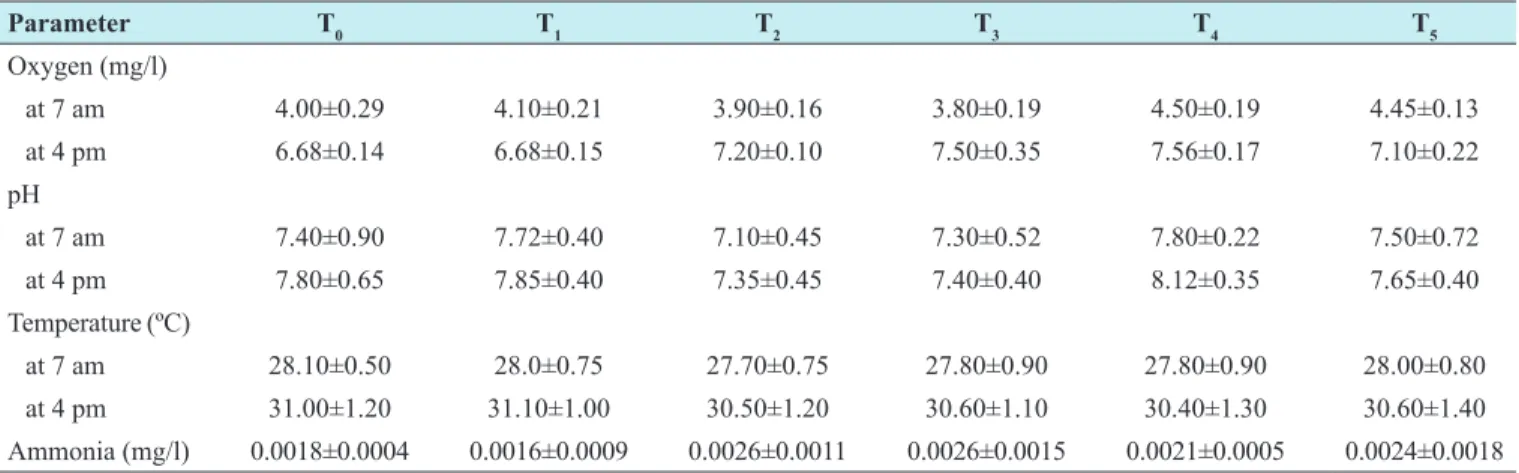
Tables 5 and 6 show that the mean DO was recorded a little
higher in T4 followed by T5, T3, T2, T1, and T0, both in morning and afternoon. On the other hand, the pH value of the treatments was also found to be a little higher in T4, followed by T5, T3, T2, T1, and T0 (both in morning and afternoon). Temperature
was recorded at about 28°C in the morning and about 30.5°C in the afternoon [Tables 5 and 6].
The mean ammonia content was found to range between
0.0016 mg/l and 0.0026 mg/l during the course of the
experiment [Tables 4 and 5].
DISCUSSION
Fish yield can be expanded with exact utilization of composts and supplementary feeds in carp polyculture approaches. The principle motivation behind lake preparation is to enlarge
the yields of tiny fish which fills in as normal nourishment of the fishes; since treatment empowers both the autotrophic and
heterotrophic levels which increment angle creation.[19] Fish
Figure 2: Effects of fish on plant number in each tiller of the rice-fish field
Figure 3: Effects of fertilizer on plant height in each tiller of the
rice-fish field
Figure 4: Effects of fertilizer on plant number in each tiller of the
Table 5: The water quality parameter (mean±standard error) of rice-fish field during the culture period
Parameter T0 T1 T2 T3 T4 T5
Oxygen (mg/l)
at 7 am 4.00±0.29 4.10±0.21 3.90±0.16 3.80±0.19 4.50±0.19 4.45±0.13
at 4 pm 6.68±0.14 6.68±0.15 7.20±0.10 7.50±0.35 7.56±0.17 7.10±0.22
pH
at 7 am 7.40±0.90 7.72±0.40 7.10±0.45 7.30±0.52 7.80±0.22 7.50±0.72
at 4 pm 7.80±0.65 7.85±0.40 7.35±0.45 7.40±0.40 8.12±0.35 7.65±0.40
Temperature (ºC)
at 7 am 28.10±0.50 28.0±0.75 27.70±0.75 27.80±0.90 27.80±0.90 28.00±0.80
at 4 pm 31.00±1.20 31.10±1.00 30.50±1.20 30.60±1.10 30.40±1.30 30.60±1.40
Ammonia (mg/l) 0.0018±0.0004 0.0016±0.0009 0.0026±0.0011 0.0026±0.0015 0.0021±0.0005 0.0024±0.0018
Table 6: The water quality parameter (mean±standard error) of rice-field after application of fertilizer
Parameter T0 T1 T2 T3 T4 T5
Oxygen (mg/l)
at 7 am 4.42±0.15 4.55±0.20 3.95±0.20 3.85±0.20 4.15±0.25 4.05±0.30
at 4 pm 7.55±0.40 7.60±0.20 6.70±0.20 6.70±0.15 7.15±0.25 7.25±0.15
pH
at 7am 7.85±0.25 7.75±0.45 7.15±0.50 7.35±0.60 7.55±0.75 7.45±0.95
at 4 pm 8.15±0.40 7.90±0.45 7.40±0.50 7.45±0.45 7.85±0.70 7.70±0.45
Temperature (ºC)
at 7am 28.15±0.55 28.05±0.80 27.75±0.80 27.85±0.95 27.85±0.95 28.05±0.85
at 4pm 31.15±1.25 31.15±1.15 30.55±1.25 30.68±1.18 30.45±1.35 30.65±1.45
Ammonia (mg/l) 0.0018±0.0004 0.0016±0.0009 0.0026±0.0011 0.0026±0.0015 0.0021±0.0005 0.0024±0.0018
Table 4: Details productivity of rice-fish farming with different fish species
Details productivity of rice-fish farming (no fish stocking) in F0
Parameter T0 T1 T2 T3 T4 T5
Average weight of fish (g/fish) - - -
-Gross production (Kg/m2) - - - - -
-Rice (kg/m2) 4.00±4.56 8.08±3.86 9.45±6.32 9.63±6.66 9.72±4.86 9.72±5.35
Straw (kg/m2) 4.60±3.24 8.70±1.45 13.50±2.85 12.60±3.54 14.40±4.68 13.50±4.32
Details productivity of rice-fish farming (tilapia fish stocking) in FT
Average initial weight of fish (g/fish) 12.48±1.32 12.40±1.52 12.24±0.97 12.57±1.22 12.24±1.07 12.35±1.13 Average final weight of fish (g/fish) 52.07±6.74 56.46±13.88 51.53±7.50 52.61±7.26 66.94±11.69 51.64±4.56 Gross fish production (Kg/m2) 4.64±2.64 4.65±2.22 4.68±2.25 4.73±1.88 6.02±1.45 5.08±2.28
Gross production of rice (kg/m2) 4.82±5.54 8.55±3.48 9.00±3.65 9.18±3.38 9.90±4.45 9.18±4.48
Gross production of straw (kg/m2) 4.70±5.32 8.6±5.86 10.5±4.55 13.5±2.66 14.4±3.86 14.4±5.65
Details productivity of rice-fish farming (carp fish stocking) in FC
Average initial weight of fish (g/fish) 25.15±1.54 25.37±1.76 25.33±1.81 25.19±1.35 24.87±1.78 25.45±1.74 Average final weight of fish (g/fish) 67.36±10.32 68.56±6.65 74.12±3.81 75.92±7.59 81.17±12.39 80.68±5.86 Gross fish production (Kg/m2) 4.06±1.76 6.17±1.84 6.67±1.44 6.83±2.88 7.30±1.86 7.16±2.78
Gross production of rice (kg/m2) 4.78±3.48 9.90±4.66 10.80±5.55 10.85±5.76 11.70±3.86 11.25±3.56
yield can be expanded up to 5000 kg/ha by nourishing and
preparation.[20] In addition, prawn culture to rice cultivating has been observed to be environmentally stable and is a decent technique for expansion. Prawns originate before on creepy
crawlies, enhance soil fertility and constitute a high-valued
money trim.[21] That regularly enhances the rice yield. In the present investigation, a relatively comparative rice yield was
acquired from the rice-fish incorporated culture with consistent
treatment contrasted and rice monoculture, notwithstanding
the way that the planted zone in rice-angle culture was less
by 20% in view of the region used for trenches. Comparative
outcomes in rice-fish culture were accounted for by
Costa-Pierce[9] and Cai et al.[5] As to rice culture lonely is taken into
thought, the rice production from rice-fish culture with the
usual application of fertilizer was altogether higher than those of rice monoculture. The wellsprings of supplements going
into the rice-fish fields were from fertilizers and feed,[22,23] yet these supplements were gathered into the water segment of the ditch. From the present investigation, the result displayed that an immediate connection between supplement supply
and yielding of rice could be found; expanding supplement supply featuring an expansion of yielding rice and fish. This is shown by the altogether higher fish yield in treatment T4
taken after by treatment T5, T3, T2, T1, and T0 in carp angle
with rice culture. As to tilapia fish with rice culture, a similar event was watched. The rice yields in rice monoculture (9.72 ± 5.35, 9.72 ± 5.35, 9.63 ± 6.66, 9.45 ± 6.32, 8.08 ± 3.86, and 4.00 ± 4.56 kg/m2) and rice-fish culture with standard treatment
and sustaining acquired in the present investigation (11.70 ± 3.86, 11.25 ± 3.56, 10.85 ± 5.76, 10.80 ± 5.55, 9.90 ± 4.66, and 4.78 ± 3.48 kg/m2) are like the yield from the rice-prawn
framework (around 4.3 ton/ha/trim) gotten by Nguyen et al.[24]
With respect to the preparation impacts, in the inorganic and
natural compost fertilizer dosage was higher in net gross yield than those of other manure trials. Thus, inorganic and natural
compost dosage 100 kg/ha/month is superior to those of
others and can be prescribed in carp polyculture. Shang[25] got
3,434.07 kg/ha angle in 10 months by applying cow compost, supplementary feed and 50 kg/ha inorganic manure in carp
polyculture framework. Dissolved oxygen focuses in all trials were lower than the ideal level of 4 ppm for carp growth after the 5th week.
This result of this study is overall similar to rice-prawn culture
with general preparation just and that with both consistent treatment and sustaining, dissolved oxygen fixation was regularly beneath the basic level of 2 ppm[26] after the 7th week.
Low dissolved oxygen fixations in those trials may be a direct
result of the blossoming of duckweed and green growth that
shaded the trench and water surface of the rice field, bringing
about the lessening of phytoplankton in the water segment, and keeping oxygen dissemination from the environment. In spite of the fact that rice generation was most reduced in the
rice-prawn culture with basal treatment and nourishing, prawn
yield was most elevated in this framework. These outcomes demonstrate that the prawn effectively expended the feed, yet
the supplements accessible for rice plants were not sufficient for ideal rice yield. Lee and Wickins[27] revealed that the net
yield in broad prawn culture was around 200–300 kg/ha/year, which is impressively not as much as the present yield of 816– 1268 kg/ha/year. This shows prawn culture in rice fields is more profitable and is a superior approach than the monoculture. In spite of the fact that the day by day weight pick up of prawns
in this rice-prawn culture is low contrasted and the information from lake culture, which is around 0.4 g/prawn/day, survival
rates are pretty much like that in escalated prawn culture in
lakes, which is 60%.[28] The size circulation of the freshwater prawns was observed to be skewed, and guys became speedier than females. Comparative outcomes were seen by Sampaio
and Valenti.[29]
CONCLUSION
We can conclude from the study that the effects of fertilization with different treatments (dosages) on the productivity of rice-fish farming in regards of Tilapia rice-fish stocking were best than those of carp fish stocking and even only in rice culture. We can consider for the application of fertilizer (5 t compost fertilizer + 75% RF, i.e., urea 281.25 g/15 m2, triple superphosphate
135.00 g/15 m2, Muriate of Potash 112.50 g/15 m2 gypsum
67.50 g/15 m2 and ZnSo
4 11.25 g/15 m2) in tilapia fish culture as the standard dosage for more production that will more
effective in rice-fish farming aquaculture in our country.
ACKNOWLEDGMENTS
The authors wish to thank Md. Parvez Anwar of the BAU, for
their field and laboratory assistance and KASS trade, Dhaka for providing financial supports for this research’ will be
changed as “The authors wish to thank Md. Parvez Anwar from
Bangladesh Agricultural University (BAU), Mymenshing, Bangladesh for using their field and laboratory assistance and
also KASS trade, Banglamotor, Dhaka for providing us the
financial supports to do this research work”.
REFERENCES
1. Jintong Y. Rice-fish culture and its macro-development in ecological agriculture. In: MacKay KT, editor. Rice-fish Culture in China. Ottawa: International Development Research Centre;
1995.
2. Shugen P, Zhechun H, Jicheng Z. Ecological mechanisms for
increasing rice and fish production. In: MacKay KT, editor. Rice-fish Culture in China. Ottawa: International Development Research Centre; 1995. p. 195-200.
3. Halwart M, Gupta MV. Culture of Fish in Rice Fields. Rome: FAO; 2004.
In: Crus CR, Lightfoot C, editors. Proceedings of ICLARM Conference on Rice-fish Research and Development in Asia. Vol. 24. Manila: International Center for Living Aquatic Resources Management; 1992. p. 17-26.
5. Cai R, Ni D, Wang J. Rice-fish culture in China: The past, present, and future. In: MacKay KT, editor. Rice-fish Culture in China. Ottawa: International Development Research Centre; 1995. p. 3-14.
6. Lu J, Li X. Review of rice-fish-farming systems in China-one of
the globally important ingenious agricultural heritage systems.
Aquaculture 2006;260:106-13.
7. Rothuis AJ, Nhan DK, Richter CJ, Ollevier F. Rice with fish culture in the semi-deep waters of the Mekong Delta, Vietnam: INTERACTION of rice culture and fish husbandry management on fish production. Aquac Res 1998;29:59-66.
8. Rothuis AJ, Vromant N, Xuan VT, Richter CJ, Ollevier F. The effect of rice seeding rate on rice and fish production and weed abundance in direct-seeded rice-fish culture. Aquaculture 1999;172:255-74.
9. Costa-Pierce BA. Rice-fish systems as intensive nurseries. In: de la Cruz CR, Lightfoot C, Costa-Pierce BA, Carangall VR, Bimbao MP, editors. Rice-Fish Research and Development in Asia. Manila, Philippines: WorldFish Center-ICLARM; 1992. p. 117-30.
10. Lightfoot C, van Dam A, Costa-Pierce BA. What’s happening to the rice yields in rice-fish systems? In: dela Crus CR, Lightfoot C, editors. Proceedings of ICLARM Conference on Rice-fish Research and Development in Asia. Vol. 24. Manila: International Center for Living Aquatic Resources Management; 1992. p. 177–183.
11. Yinhe P. Ecological effects of rice-fish culture. In: Mac-Kay KT, editor. Rice-fish Culture in. China: International Development;
1995.
12. Frei M, Becker K. Integrated rice-fish culture: coupled production saves resources. Nat Resour Forum 2005;29:135-43.
13. Berg H. Pesticide use in rice and rice-fish farms in the Mekong Delta, Vietnam. Crop Prot 2001;20:897-905.
14. Berg H. Rice monoculture and integrated rice-fish farming in the Mekong Delta, Vietnam-economic and ecological considerations. Ecol Econ 2002;41:95-107.
15. Gomez KA. Techniques for Field Experiments with Rice. Los Banos,
Philippines: International Rice Research Institute; 1972. p. 49.
16. Apha AW. Standar Method for the Examination of Water and Wastewater. 16th ed. American Public Health Association,
American Water Works Association. Washington, DC, USA: Water Pollution Control Federation; 1985. p. 1268.
17. Stanley RW, Moore LB. The growth of Macrobrachium rosenbergii fed commercial feeds in pond cages. J World Mariculture Soc 1983;14:174-84.
18. Steele RG, Torrie JH. Principles and Procedures of Statistics: A
Biometrical Approach, 2nd ed. New York, USA: McGraw-Hill;
1980. p. 633.
19. Boyd CE. Water Quality in Ponds for Aquaculture. Alabama Agriculture Experiment Station. Auburn, AL, USA: Auburn University; 1990. p. 428.
20. Roy B, Das DN, Mukhopadhyay PK. Rice-fish/prawn vegetable
integrated farming viable proposition in deep-water rice ecosystem. In: Proceedings of National Symposium on New
Horizons in Freshwater Aquaculture, Bhubaneswar, Orissa, India,
23-25 January, 1991. Kausalyagang, Bhubaneswar, Orissa, India: Central Institute of Freshwater Aquaculture; 1991. p. 24-5. 21. New MB. Status of freshwater prawn farming: A review. Aquac
Res 1995;26:1-54.
22. Grist DH. Rice. 6th ed., London, UK: Longman; 1986. p. 559.
23. Boyd CE. Bottom Soils, Sediment, and Pond Aquaculture.
New York, USA: Chapman and Hall; 1995. p. 348.
24. Nguyen VS, Truong QP, Villaneuva F, Dalsgaard JP. Integrated rice-prawn farming in the Mekong Delta: A route towards sustainable and profitable farming systems. NAGA ICLARM
Q 1993;16:18-20.
25. Shang YC. Aquaculture Economic Analysis: An Introduction. Baton Rouge, LA, USA: World Aquaculture Society; 1990.
p. 211.
26. Thang NV. A Manual for Culture of Giant Freshwater Prawn. Ho Chi Minh, Vietnam: Agriculture Publisher; 1996. p. 120. 27. Lee DO, Wickins JF. Crustacean Farming. Oxford, UK:
Blackwell; 1992. p. 392.
28. Lin CK, Boonyaratpalin M. An analysis of biological characteristics of Macrobrachium rosenbergii (de Man)
in relation to pond production and marketing in Thailand.
Aquaculture 1988;74:205-15.
29. Sampaio CM, Valenti WC. Growth curves for Macrobrachium rosenbergii in semi-intensive culture in Brazil. J World Aquac Soc 1996;27:353-8.