Complex Systems Informatics and Modeling Quarterly (CSIMQ) eISSN: 2255-9922
Published online by RTU Press, https://csimq-journals.rtu.lv Article 93, Issue 16, September/October 2018, Pages 17–35 https://doi.org/10.7250/csimq.2018-16.02
Modeling Interactive Enterprise Architecture Visualizations:
An Extended Architecture Description
Dierk Jugel1,2*
1 Herman Hollerith Zentrum, Reutlingen University, Danziger Str. 6, Böblingen, 71034, Germany 2
Chair of Business Information Systems, University of Rostock, Rostock, 18059, Germany
Abstract. Enterprise Architectures consist of a multitude of architecture elements, which relate in manifold ways to each other. Due to the high number of relationships between these elements, architectural analysis mechanisms are essential for all stakeholders to keep track and to work out relevant model characteristics. In practice EAs are often analyzed using visualizations by hand. However, the visualizations are often static and there are only few interaction possibilities. As a result, new visualizations have to be created or configured by experts if information demands change. In addition, hardly any tools are used for analysis of complex model characteristics. In this article we introduce an extended conceptualization of the architecture description that defines the structure of interactive visualizations and the integration of further tools to flexibly respond to the information demands of stakeholders. In addition, we develop a so-called Architecture Cockpit that realizes the extended conceptualization in a prototype. At the end we demonstrate and evaluate our approach through a practical test in a company in the finance and insurance industry.
Keywords: ISO Standard 42010, Visual EAM Analytics, Enterprise Architecture Management, EA Analysis.
1
Introduction
Enterprises are complex and integrated systems of processes, organizational units, resources and technologies with a multitude of relations and interdependencies. Enterprise Architecture Management (EAM) aims at providing an integrated view on all these aspects of the organization to support business & IT-alignment, optimization scenarios, quick adaption to environmental changes and other purposes. Since Enterprise Architectures (EAs) are complex structures, it is difficult to keep track and to work out relevant characteristics. In practice,
*
Corresponding author
© 2018 Dierk Jugel. This is an open access article licensed under the Creative Commons Attribution License (http://creativecommons.org/licenses/by/4.0).
Reference: D. Jugel, “Modeling Interactive Enterprise Architecture Visualizations: An Extended Architecture Description,” Complex Systems Informatics and Modeling Quarterly, CSIMQ, no. 16, pp. 17–35, 2018. Available: https://doi.org/10.7250/csimq.2018-16.02
18 visualizations are often used by stakeholders to get information that is of interest. Typical visualizations in EAM are landscape or cluster diagrams. Matthes et al. [1] outline the basic functionality of visualization techniques in an EAM tool survey. Since stakeholders have different interests, it is important to align visualizations (viewpoints) to their information demands. ISO Std. 42010 [2] is a systematic approach to align viewpoints with concerns of
stakeholders. The resulting visualizations based on the definition of viewpoints are called views.
Viewpoints describe how the different views relate and which stakeholders’ concerns are addressed thereby. Viewpoints further define how views are constructed, interpreted and used.
Concerns reflect the information needs of stakeholders.
A useful visualization combines a suitable way of representing information with a careful selection of the relevant information. The elicitation of what information is relevant to address the stakeholders’ concerns is crucial therefore. Work in the area of information logistics showed that information demands depend on the tasks and responsibilities (concerns) of an organizational role [3]. Thus, the key precondition for achieving demand-oriented information supply is to understand the roles’ and stakeholders’ concerns and information demands. In [2]
Stakeholders are defined as “individual, team, organization, or classes thereof, having an interest in a system”. In contrast of stakeholders, roles are logical functions within an organization. Stakeholders fill one or more roles.
Although visualizations are often used in practice for decision-making in enterprise architecture management, their capabilities often leave much to be desired [4]. Visualizations are often static and therefore cannot be changed interactively with changed information demands. The configuration is also often very complex and requires expert knowledge.
In addition, research has no adequate solution to this problem. For example, the ISO Std. 42010 [2] provides a modeling approach to systematically align visualizations with stakeholder interests. However, the standard does not provide answers regarding interactions. It describes so-called Analysis and Design / Implementation Methods as part of a viewpoint. The standard also clarifies the technical requirements of such functionality. However, there are no mechanisms for enabling interactive views.
In this article, we describe an approach to support stakeholders in EA decision-making based on interactive visualizations combined with so-called techniques. Interactive visualizations make it possible to react to dynamic information demands. This is realized by the application of techniques to visualizations. Depending on the degree of formalization, techniques consist of an algorithm or an instruction for action and then present the result in the interactive visualizations. In this way, for instance, a KPI for elements of the EA can be calculated and the result can be represented by coloring the elements. By applying techniques to visualizations, changed information demands can be represented without a conventional configuration of a new visualization. Instead, selecting a technique to be executed by using an interaction in the visualization is sufficient. To do this, we introduce an extended conceptualization of architecture description based on ISO Std. 42010 [2], which defines the structure of interactive visualizations and the interaction with techniques.
The remainder of this article is structured as follows: In Section 2, we revisit the state-of-the-art in modeling architecture visualizations and techniques in the context of EA. In Section 3, we introduce the extended architecture description. In Section 4, we demonstrate the approach by a practical test and evaluate it in Section 5. For this test, we implement the so-called Architecture Cockpit. In Section 6 we conclude the article with a summary.
2
State-of-the-Art
19 supports stakeholders in carrying out activities by e.g. providing automated algorithms for analysis of enterprise architectures. A more detailed description of techniques follows later in Section 3.2.
2.1 Modeling Architecture Visualizations
The ISO Std. 42010 [2] describes a systematic approach for creating architectural descriptions of systems. A system is an entity whose architecture is of interest. Due to the very generic definition of a system and the fact that different systems are used in different application domains, this approach can be transferred to other domains in addition to software engineering. For instance, a system can be understood as a software and an enterprise whose enterprise architecture corresponds to an expression of the concept of an architecture named in the standard. For this reason, the standard is increasingly being used and adapted in enterprise architecture management [5], [6]. A weakness of the standard is the very abstract description of the individual concepts, which opens up a wide range of interpretation and leaves some questions unanswered. Furthermore, there are no answers regarding the modeling and implementation of interactive views.
In addition to the ISO Std. 42010, the approach of software cartography [7] describes a systematic visualization of application landscapes. The basic idea of the approach is the adaptation of the principles of classical cartography to the domain of application landscape management. The core of the work is the conception of so-called software maps, under which “a graphical representation of an application landscape or parts of it” is understood [7]. Since the concept of the architecture model, which represents a visual model as part of a view of an architecture, is very generic in the standard, the authors extend this concept and introduce a layer concept [8]. A view consists of several levels according to this approach. The so-called base map represents the bottom of the map and is a special layer that is the basis for all other layers. This makes it possible to overlay visual presets. For instance, it is possible to specify, at a layer, which symbol is used to represent a specific element of the architecture at which position and size. Another layer can refer to it and extend the symbol with an additional visual property in the form of a background color. Although the extension of the ISO Std. 42010 details the very abstract structure of a view, it does not provide an answer as to what adjustments are required on the part of its construction (viewpoint). Furthermore, interactions are not part of that work [7].
Another approach to describe architectures is pursued by Schweda [9] in the form of a building block-based description language. Schweda identifies three basic building block types: Information Model Building Blocks (IBB), Glossary Building Blocks (GBB) and Viewpoint Building Blocks (VBB). By defining these species, Schweda takes into account the fundamental characteristics of a modeling language. According to Harel and Rumpe [10] and Kühn [11], this consists of syntax, semantics and notation. The description of the syntax is the task of the IBB. With this, parts of the architecture can be defined in the form of concepts, attributes and relations. The definition of the meaning of these elements (semantics) in textual form is taken over by the GBB. The graphical representation is finally done with the help of the VBB. To ensure the reusability of the blocks, they can be configured by variables. If we compare the building blocks with the concepts of the ISO Std. 42010, then these are to be located at the level of the viewpoint, more precisely, the model kind.
20 2.2 Techniques in EAM
With the aim of analyzing enterprise models, Ramos et al. [13] describe automated analysis functions as part of the PRIMROSe approach. The authors use the definition of Benavides et al. [14], which defines an analysis function as a function “for the extraction, manipulation and inference of data in models based on automated mechanisms”. In addition to a catalog of analysis functions identified by literature reviews [15], the authors define requirements to describe and concatenate individual functions [13]. The description of an analysis function includes, in addition to an algorithm to calculate something automatically, an input and an output metamodel. The metamodels are essential for the concatenation of functions. A concatenation of the functions A and B in the form of a sequence A, B is only possible if the output metamodel of function A is a superset of the input metamodel of function B. The difference between the input and output metamodel of a given function describes the result of a model enrichment made by the execution of the algorithm.
Hanschke [16] describes analysis and design patterns as part of the best-practice EAM approach. The author understands an analysis or design pattern as a “proven and generalized template” for the analysis or design of an enterprise architecture [17], [18]. In addition to a described procedure for the identification of optimization requirements (analysis pattern) or the targeted further development of an enterprise architecture (design pattern), the visualization of the respective facts for Hanschke also belongs to the description of a pattern. The patterns are described by a description language similar to the considerations of Ramos et al. [13]. They contain concepts, properties and relations that are necessary to perform the pattern. In contrast to the automated analysis functions, the procedure defined in the patterns is described in textual form, so that an automated implementation is initially not possible. The procedure uses visualizations to show how optimization potential can be identified in the case of an analysis pattern. Due to the textual descriptions, the degree of formalization is lower. However, since the procedure is described very precisely by individual steps that resemble rules, it can be formalized on the basis of the above concepts and relationships. In [19] we performed such a formalization as an example and demonstrated how the analysis patterns can be automated.
In addition to the work described, there are numerous other forms of techniques in the literature. As an example, metrics for the quantitative analysis of an enterprise architecture are described by Matthes et al. [20]. The goal of this approach is to summarize data by calculating metrics based on a model-based formalization.
The ISO Std. 42010 [2] also describes so-called analysis and design methods for handling a view. These methods should show how an architecture can be analyzed or further developed with the help of the Architecture View. However, the standard does not go into detail, regarding the methods.
3
A Conceptualization for Modeling Architecture Visualizations
21 3.1 A Conceptualization for Architecture Visualizations
The ISO Standard 42010 [2] is, despite its abstractness, the most advanced approach to describe visualizations. The other approaches presented provide potential extensions and inspirations. For this reason, and because the standard is recognized both in research and in practice, it serves as the basis for further action.
The standard describes the two core concepts Architecture Viewpoint and Architecture View in order to align the architecture description to the stakeholder’s concerns in a system. These concepts represent the visualizations and are a main part of the architectural description. The relationship between Architecture Viewpoint and Architecture View is illustrated by the analogy of the software engineering of a class (Viewpoint) and an instance (View). As the Architecture Viewpoint forms the basis of the Architecture View, attention is first focused on it. Afterwards, the concept of the Architecture View is considered in more detail.
The Architecture Viewpoint is defined in the standard as “work product establishing the conventions for the construction, interpretation and use of architecture views to frame specific system concerns” [2]. The construction and interpretation of an Architecture View can be understood as a modeling language composed of syntax, semantics and notation [10]. Based on this, an Architecture Viewpoint is defined in this work as follows:
Architecture Viewpoint: An Architecture Viewpoint is a configuration of an Architecture View, based on Stakeholder’s Concerns in a System. The configuration defines the modeling language of the Architecture View and describes specifications for its handling.
To define the modeling language, one or more so-called Model Kinds are assigned to an
Architecture Viewpoint. This concept is very abstractly described as “conventions for a kind of modeling” [2]. Multiple Model Kinds can be assigned to an Architecture Viewpoint to allow modeling language compositions. In addition, the Model Kind makes specifications regarding the handling of the associated Architecture View.
Model Kind: A Model Kind describes a modeling language for constructing part of an Architecture View. In addition, specifications for handling the part are defined.
A syntax defines elements of reality to be described by the modeling language [10]. In the specific case of the ISO Std. 42010 [2], a metamodel contained in the Model Kind determines the part of the architecture that is to be displayed. This metamodel can be understood as a metamodel-based description of a syntax according to Kühn [11]. This description is characterized by the description of the syntax elements as instances of concepts of a metalanguage. The corresponding metalanguage must therefore contain the syntax elements (concept, attribute and relation) as well as their meaning by semantics.
A common understanding of the elements of the syntax is provided by the semantics [10]. For this purpose, so-called interpretation methods are assigned to the Model Kind. The graphical representation of the syntax is done by the notation, which is defined by construction methods analogous to the interpretation methods. For the creation of an Architecture View based on the modeling languages contained in the Model Kinds, the model transformation described in the software cartography approach [7] can be used.
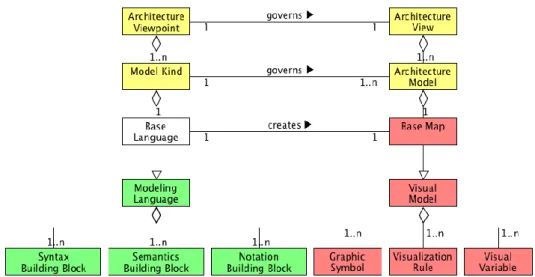
22 The result of the integration is illustrated in Figure 1. The coloring of the concepts signals their origin. White concepts are based on our own considerations. Yellow concepts come from the ISO Std. 42010 [2]. Green concepts have their origin in [9] and are adapted from there. A detailed description of the concepts and their origin is explained below:
Figure 1. Detailing the Architecture Viewpoint [2] by integrating building blocks [9]
A Modeling Language consists of the building blocks of Schweda [9]. Schweda does not foresee this elementary concept, even though the basic idea originates from there. The Modeling Language can be assigned several building blocks of each building block type. The merging of all similar building blocks thus defines the respective part of the Modeling Language. In order to maintain consistency, Schweda [9] addresses the necessary consistency treatment. Based on [10] and [11], a Modeling Language is defined as follows:
Modeling Language: A Modeling Language is an artificial language and consists of syntax, semantics, and notation.
The concept of the Modeling Language is specified by the Base Language. A Base Language
defines the basic structure of a visualization by specifying the part of the EA to be represented and how it is to be represented, e.g. by a cluster diagram. The background to this concept is the detailing of the Architecture View contained in the software cartography approach through the introduction of the Software Map and a layer concept [8]. The initial language defined by the
Model Kind thus corresponds to the description of the base layer (Base Map) of a view. This aspect of the description of the Architecture Views will be discussed later on. A Base Language
is defined based on the description of a Base Map from [8] as follows:
Base Language:The Base Language is a Modeling Language and defines the basic structure of an Architecture View that is part of the lowest layer (Base Map) of them.
For better understanding, the building block types that make up a Modeling Language are renamed according to their intended use. Thus, the Information Model Building Block described by Schweda [9] corresponds to the Syntax Building Block and serves to clarify the metamodel mentioned in the ISO Std. 42010. Based on Schweda [9], the Syntax Building Block is defined as follows:
Syntax Building Block: The Syntax Building Block describes a metamodel as part of the syntax of a Modeling Language. The syntax of a Modeling Language can consist of several building blocks.
23 into the Notation Building Block, which stands for a specification of the Construction Methods. Following Schweda [9], these building blocks are defined as follows:
Semantics Building Block: The Semantics Building Block describes the semantics of the individual elements of a syntax that are part of a Modeling Language.
Notation Building Block: The Notation Building Block defines an assignment of Architectural Model elements to visual elements in the form of a notation. These building blocks are the basis of the model transformation for creating an Architecture View.
The two operations for handling an Architecture View have been taken over for completeness from the standard. A corresponding clarification is given in Section 3.2.
All concepts described so far in connection with an Architecture Viewpoint are used to configure an Architecture View. This configuration forms the basis of the model transformation towards a visualization in the sense of the approach of software cartography. In the following, the concept of the Architecture View, which represents the product of the model transformation, is considered in more detail.
The Architecture View is described in the standard as “work product expressing the architecture of a system from the perspective of specific system concerns” [2]. In the context of this article the Architecture View is defined according to the ISO Std. 42010 as follows:
Architecture View:An Architecture View focuses on specific concerns of stakeholders and is built according to the viewpoint's specifications. Architecture Views are composed of one or more visual models that describe symbols and their properties contained in the view.
The conceptualization of the Architecture View that has been extended in the context of this work is shown by Figure 2. The individual concepts are considered and defined in more detail below. Yellow-colored concepts have their origins in the ISO standard 42010 [2], while red-colored concepts are used in the approach of software cartography in [7], [8].
Figure 2. Clarification of the Architecture View [2] through software cartography concepts [7], [8]
The Visual Model contained in the definition of an Architecture View is represented in the ISO Std. 42010 by the concept of the Architecture Model. It is defined as a work product created in the construction of an Architecture View based on a Model Kind's specifications [2]. Compared with the models described in software cartography, the Architecture Model corresponds to the
Symbolic Model described there, which is defined as a model for describing the “symbolism of a visualization” [7]. The Architecture Model is specified in the software cartography by the concept of the Software Map [8], which implements a layer concept.
24 Architecture Model:The Architecture Model is a layered visual model used to describe parts of an Architecture View.
The layers originally included in the concept of the Software Map become a direct part of the
Architecture Model in this work. The Software Map is not used in return. The layer concept from [8] provides the distinction between Base Map and Layer. Both concepts are specializations of the Abstract Layer in the original work. The individual layers are visual models that make up the Architecture Model. For this reason, the concept of the Abstract Layer is renamed in the context of this work in Visual Model and defined according to [7] as follows:
Visual Model: The Visual Model consists of symbols and their properties as well as visualization rules to relate the symbols to each other.
The symbols, their properties, and the visualization rules contained in the Visual Model are conceptualized by the corresponding concepts Graphic Symbol, Visual Variable, and
Visualization Rule. These concepts are defined by the definition of the Visual Model based on [7] as follows:
Graphic Symbol:A Graphic Symbol is part of a visualization and represents a model element of the Architecture in the form of a symbol.
Visual Variable:The Visual Variable defines a property of a graphic symbol. In this way, a symbol can, e.g., be assigned a background color or a position within a visualization.
Visualization Rule: The Visualization Rule describes a relationship between two symbols, allowing nesting of these symbols. In this way, e.g., it can be specified that symbol A should be drawn on symbol B.
To create the Architecture View, the concept of the Base Map is of fundamental importance, since this concept represents the lowest layer of the Architecture View. This layer is the basis for all other layers that refer to it. The Base Map is created according to the specifications of the
Base Language described in the Architecture Viewpoint. The further layers are described in more detail in the description of a Technique in Section 3.2. Based on the comments in [8], the concepts of Base Map and Layer are defined as follows:
Base Map: The Base Map is a specialized Visual Model describing the lowest layer of an Architecture View. This layer is the product of a model transformation performed according to the specifications of the corresponding Base Language to create an Architecture View.
Layer:The Layer is a Visual Model and represents a layer within an Architecture View except the lowest layer. It is the product of a model transformation to create an Architecture View.
Finally, after the concepts of the Architecture Viewpoint and the Architecture View have been detailed, Figure 3 shows their integration. The coloring indicates the origin of the concepts. White concepts are based on own considerations, while green and red concepts have their origin in [9] or in the approach of software cartography in [7], [8]. Yellow concepts come from the ISO Std. 42010 [2].
The integration introduces the relationship between the concepts of the Base Language and the
25
Figure 3. Integration of the extensions of Architecture Viewpoint and Architecture View
3.2A Conceptualization for Techniques
The work presented in Section 2.2 presents a broad spectrum of techniques. However, there are some similarities. All techniques include a procedure whose degree of formalization varies. The procedure is model-based and the result of its execution is an enrichment of the input model. The basis of this enrichment is an extended metamodel, through which the new findings in the form of, for instance, newly introduced properties are mapped to already existing concepts. Furthermore, all techniques described are strongly related to visualizations that are the result of the technique. The goal of a technique is to support stakeholders in performing activities [13]. For this reason, it is important to align the techniques to the concerns of the stakeholders.
On the basis of these identified similarities, a Technique is defined as follows:
Technique:A Technique describes a model-based approach to support stakeholders in doing a particular task. It is initiated or performed through interactions in visualizations. During execution, an input model is extended depending on the degree of formalization based on either an algorithm or a description of action. At the end, the result is projected into the original visualization and optional others. Depending on the degree of formalization, techniques are executed manually or automatically.
Looking at the properties of a Technique that have just been identified, one finds all the components of a Modeling Language. The requirements for the initial model for performing
Technique in the form of a metamodel as well as its extension representing the model enrichment correspond to the syntax of the Modeling Language. The procedure described by a Technique
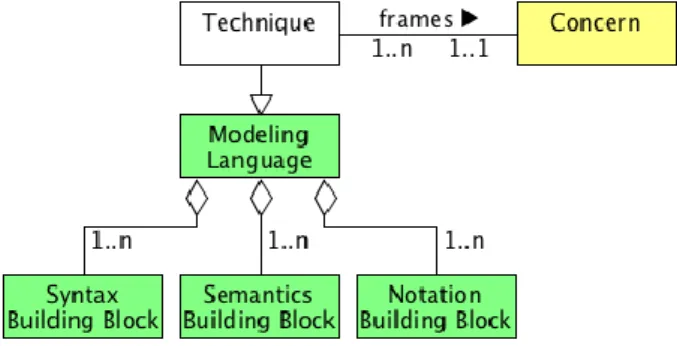
provides the semantics of the concepts and properties that are added as part of model enrichment. This argumentation is supported by Karagiannis and Kühn [21] who show different ways of describing semantics. The textual description is suitable for describing the procedure for techniques with a low degree of formalization, while in the case of a higher degree of formalization the operational description can be used to describe the execution logic or a metric. The graphic representation of the results of a Technique corresponds to the definition of a notation. Based on these considerations, Figure 4 illustrates the conceptualization of the
26
Figure 4. Conceptualization of the Technique
Accordingly to the recently conducted discussion, a Technique in the context of the work is a
Modeling Language that is introduced in Section 3.1 and consists of the building blocks from Schweda [9]. The components of the Modeling Language concept are sufficient to fully describe a technique.
In order to be able to distinguish elements of the metamodel that represent the requirements for execution and elements that represent model enrichment, the Syntax Building Block is further specified. Elements describing model enrichment are identified by the stereotype «edited». In order to recognize which concept is essentially considered by a Technique, it receives the stereotype «considered». This stereotype is important in Techniques that enrich multiple concepts with additional attributes and relationships. A typical example of this is dependency analysis [17]. It identifies enterprise architecture objects that are directly or indirectly related to a particular object.
It is also necessary to clarify the Semantics Building Block, since Schweda only provides the textual description of semantics. Textual descriptions are suitable to define the semantics of metamodel concepts that already exist before executing a Technique in the sense of an input metamodel described by Ramos et al. [13]. Depending on the degree of formalization, higher description forms, such as the operational form, may be used to describe the semantics of meta-model elements provided with the «edited» stereotype. For this reason, the module is specialized as follows:
Operational Semantics Building Block: In this building block, the description of the semantics is done in an operational way in the form of an algorithm or a metric. This type of description can be found, e.g., in the metrics of Matthes et al. [20] or the analysis functions of Ramos et al. [13].
Rule-based Semantics Building Block: This building block describes the semantics in the form of textual rules. In contrast to the operational description, the degree of formalization is lower. Examples include the analysis [17] and design patterns [18] by Hanschke.
Textual Semantics Building Block: This building block describes the semantics textually and without any rules. This type requires no formalization and is, for instance, used in addition to operational or rule-based forms for describing the semantics of elements of the initial metamodel.
A detailing of the Notation Building Block is not required. Schweda [9] introduces different types of these. To visualize the results of a Technique the so-called Decorating Notation Building Block can be used to enrich existing symbols that represent EA elements by additional visual variables; for instance, EA elements can be colored on the basis of previously calculated model characteristics.
27
frames relation is used, which is already used in the ISO Std. 42010 for aligning the Architecture Viewpoint to Concerns.
3.3 Integration of Both Conceptualizations
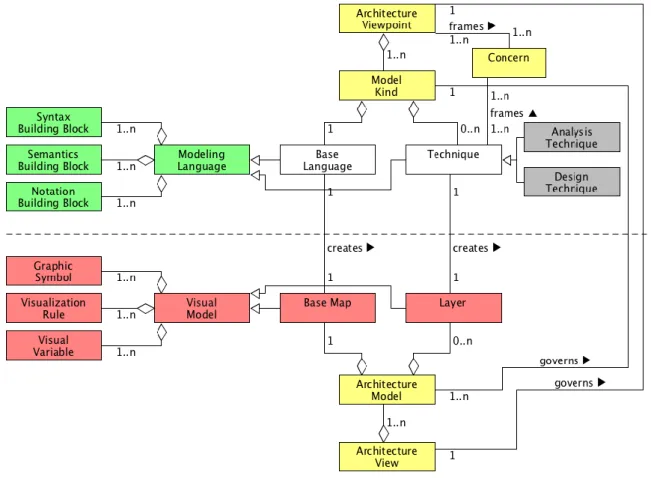
There is a close relationship between visualizations and techniques. This is shown by the analysis and design methods mentioned in the ISO Std. 42010 [2] as part of the Model Kind. The analysis [17] and design patterns [18] by Hanschke, as well as the PRIMROS approach [13] also support this thesis. For the realization of interactive visualizations the integration of visualizations and techniques is essential to be able to react to dynamic information demands. One form of interaction can be the execution of a Technique and the visualization of its results. For this reason, this section integrates the conceptualizations of visualizations and techniques described in the previous sections, which is illustrated by Figure 5. The coloring of the concepts signals their origin. White concepts are based on own considerations, while red and green concepts have their origin in the approaches of software cartography [7], [8] and in Schweda [9] correspondingly. Yellow concepts come from the ISO Std. 42010 [2]. Finally, gray concepts are based on considerations by Hanschke in Best Practice EAM [16], [17], [18].
Figure 5. Integration of Architecture Viewpoint and Technique
The figure shows the basic interaction between Architecture Viewpoint and Architecture View. The concepts above the dashed line belong to the Architecture Viewpoint, while the concepts below the line belong to the Architecture View. The interaction of these two concepts and their extended conceptualization can be found in Section 3.1.
28 clarification of these methods is done in this work through the integration of the Technique. To ensure alignment of Architecture Viewpoints and Techniques with Stakeholder Concerns, they are assigned to these Concerns. In order to clarify the respective intended use of the Techniques, a specialization in Analysis Technique and Design Technique takes place. Based on the abstract descriptions of an analysis and design method from [2] and the definitions of analysis [17] and design patterns [18], analysis and design techniques are defined as follows:
Analysis Technique: An Analysis Technique describes a stakeholder-aligned, model-based approach to support the analysis of architectures.
Design Technique: A Design Technique describes a stakeholder-aligned, model-based approach to support the design of architectures.
The Modeling Language defined by a Model Kind is thus composed of the initial language (Base Language) and optional Techniques that can be applied to Architecture Viewpoints. While the Base Language provides the basic structure of the visualization, it can be extended by performing Techniques to provide more information to help stakeholders make their decisions.
As explained in Section 3.1, the Base Language constraints in a model transformation result in a Base Map, which is the lowest layer of an Architecture Model. In order to be able to graphically display the results created during the execution of a Technique, an additional layer is created, which refers to the Base Map and extends the symbols contained there by further properties in the form of Visual Variables.
After the integration of the two conceptualizations has taken place, the question arises, under which circumstances an assignment of a Technique can be made to a Model Kind. An alignment makes sense only if the Modeling Languages described by the Base Language and the Technique
overlap to some extent. If the two modeling languages are completely disjunctive, a combination of the two languages does not make sense. In this case, the Technique describes a procedure that does not fit the illustrated part of the Architecture.
In the course of the development of the Syntax Building Blocks Schweda [9] made similar thoughts. The building block-based approach leads to a high integration effort, because the syntax of a modeling language consists of a large number of Syntax Building Blocks, each of which defines a small part of it. An integration of two Syntax Building Blocks is possible for Schweda if their metamodels contain at least one common concept. However, the characteristics of this concept need not be identical. Thus, the integration can extend the common concept by adding additional properties that do not exist in both Syntax Building Blocks. This condition is referred to below as structural overlap, since the syntax defines the structure of a part of the architecture. If you translate this rule into the context of the assignment of a Technique to a
Model Kind, then this is only possible if the Syntax Building Blocks of the Base Language and the Technique have at least one common concept.
The structural overlap condition is important for mapping Techniques to a Model Kind, but it does not address all parts of a Modeling Language. In addition to the structural overlap, overlaps in terms of semantics and notation are also important. Thus, although there may be a structural overlap, this is of no use if the concept has different semantics in the two contexts. Similarly, when there is structural overlap, the concepts visualized by a Technique are not graphically represented by the Base Language. In this case, the results of the Technique cannot be added in the visualization. For this reason, the following three conditions are defined for the assignment of techniques to Model Kinds:
Structural Overlap: The Syntax Building Blocks of the Base Language and the Technique
must overlap in terms of the concepts characterized in the Technique by the stereotypes «considered» and «edited». At least one common concept is needed. At first it does not matter with which of the two stereotypes this is marked on the side of the Technique. A corresponding explanation will be given later in this section.
Semantic Overlap: The Semantics Building Blocks of the Base Language and Technique
29 understanding in both contexts. Only if a concept is understood in the same way in both contexts is the concept really the same.
Representative Overlap: The concept to which new attributes or relationships are added by a Technique must be objectively represented by the Base Language. A concept is objectively represented if it is assigned a symbol by a Symbol Notation Building Block [9]. If this is not the case, the Decorating Notation Building Block contained in a Technique can not refer to any symbol and thus cannot be used to extend visual properties. If the representation of the results of a Technique contains several concepts for which a notation is defined, then at least one of these concepts must be represented objectively by the Base Language. Thus, at least a partial result can be visualized.
Techniques can potentially be assigned to multiple Model Kinds of different Architecture Viewpoints, if the conditions of the assignment are met. This capability enables coherent
Architecture Viewpoints that can be used to identify and depict relationships and dependencies between them. The primary goal of assigning a Technique to a Model Kind is the execution of the Technique and the graphical representation of the results. Since a Technique can extend the notation for different concepts, it can only be assigned to display partial results. These two possibilities of assignment require a differentiated consideration of the structural overlap. The execution of a Technique requires a structural overlap with regard to the concept characterized by the stereotype «considered». Thus, a Technique can only be performed on Architecture Views
in which the concept to be considered is visually represented. The background of this limitation is a possible need to parametrize a Technique before it can be executed. An example of this is a dependency analysis [17], to which the element must first be passed for which the dependent elements are to be identified. This selection is made through interactions on the Architecture View. If, on the other hand, the focus is solely on the presentation of partial results, a structural overlap is necessary with regard to the concepts marked with «edited». The presentation of partial results is important in that dependencies and relationships between different Architecture Viewpoints and thus between the Concerns of the Stakeholders become apparent.
4
Applying the Approach
In this section we applicate the extended conceptualization described in Section 3. For this purpose we implemented a prototype – the so-called Architecture Cockpit. The Architecture Cockpit is a web application and realizes the extended conceptualization of the architectural description from Section 3. It enables the configuration of interactive visualizations and their interaction with techniques. Therefore the prototype includes visualizations and techniques that can be applied to visualizations.
The practical test takes place in a global company in the financial and insurance industry. The focus here is on cybersecurity, as this topic is being worked on by the company. To gain an insight into the corporate context, this will be explained in the following.
The company is structured as a holding organization. The holding is responsible for the worldwide activities of the company. The business in the individual countries and regions is structured in separate organizational entities (OEs). In addition, there are OEs that offer specialized products across countries and regions. Each OE has its own enterprise architecture that is managed by local enterprise architecture management.
30 Therefore, the company wants to use the Architecture Cockpit to automate visual processing of the KPIs and to provide further functionality for planning target value ranges in the future. The changed value ranges are intended to create incentives for the OEs to continuously improve. Therefore it should be more difficult to achieve a good category for a KPI over time. To plan future value ranges for a KPI, the holding wants to know the impacts, i.e. which OE would currently be in which category. In this way, the effort for each OE can be estimated to meet the new guidelines.
To meet the technical requirements of the company, the company wants three visualizations and one Analysis Technique which we describe in the following:
Figure 6illustrates a world map as an instance of an Architecture View. The view consists of several Graphic Symbols that represents existing OEs in a geographical context. OEs that cannot be assigned directly to a country because they operate in several countries or regions are located at the edges. This basic structure of the world map including symbols, but without OE’s background color, is defined by the Base Language of the corresponding Architecture Viewpoint. The Base Language’sSyntax Building Block describes the metamodel that defines the part of the architecture which is required to visualize the information. In the present case, only the concept “OE” with the properties “name” and “countryid” is required. The property “countryid” is required to assign an OE to countries in the world.
Figure 6. World map to visualize OEs
To define the meaning of the concept “OE”, a Textual Semantics Building Block is used. A
Notation Building Block defines the Base Map’s structure including the mapping of OEs to countries or to the edges of the visualization.
The OE’s background color, technically realized by Visual Variables, is part of a Layer that is the result of an Analysis Technique. This technique has the task to calculate a selected KPI by translating measured values into the categories “very good” (dark green) to “very bad” (red) and highlighting the OEs according to their category. In addition, the category “not available” (dark gray) represents missing values.
31
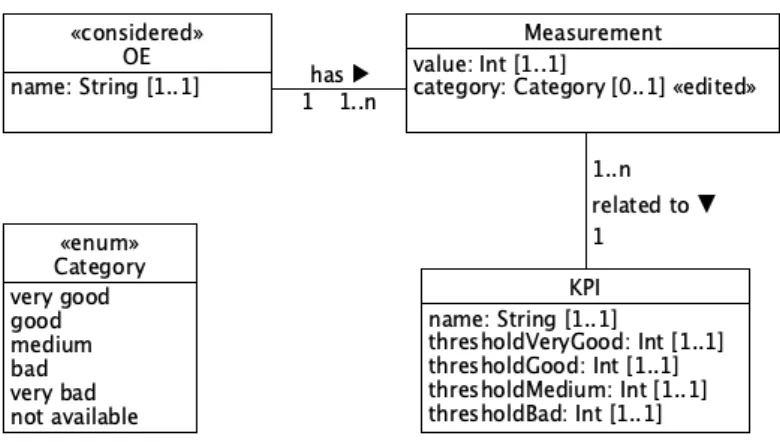
Figure 7. Metamodel described by the Syntax Building Block as part of the Analysis Technique
The semantics of the syntax is described using a Rule-based Semantics Building Block that contains rules for translating measured values into categories of the category system. This is a special form of describing semantics (see [21]). An example of such a rule is “If the Measurement’s value is lower than thresholdBad, then set Measurement’s category to very bad”.
In this way, the semantics of the category very bad is defined.
Additional further Textual Semantics Building Blocks describe the meaning of the metamodel’s concepts. The semantics of the concepts “OE” is the same as in the world map.
Finally, a Notation Building Block sets the OE’s background color based on the categories. In addition, another Notation Building Block defines the creation of a legend at the bottom of the visualization.
Based on the definitions of the Notation Building Blocks, a Layer is created that refers to the symbols of the view’s Base Map and extends them by a Visual Variable that defines the background color. Furthermore additional Graphic Symbols and corresponding Visual Variables
are part of the Layer that represent the legend.
In order to be able to apply this Analysis Technique on the world map, the conditions defined in Section 3 have to be fulfilled. The Structural Overlap is fulfilled because the concept “OE” exists in both metamodels defined by Syntax Building Blocks. The Semantic Overlap is also fulfilled because the meaning of the concept “OE” is the same in both contexts. The Representative Overlap is finally fulfilled because OEs, for which the technique calculates a KPI, are represented by symbols in the world map. The stereotype <<considered>> in the technique’s metamodel signals that the technique’s focus lies on the OE. Therefore, the OE is the concept that has to be visualized.
The slider on the right side of the visualization is an interactive control enabling “what-if” scenarios and can be used to change the value ranges for calculation. In case of a change, the
Analysis Technique will be triggered in the background to recalculate the KPIs for all OEs and to update the background colors.
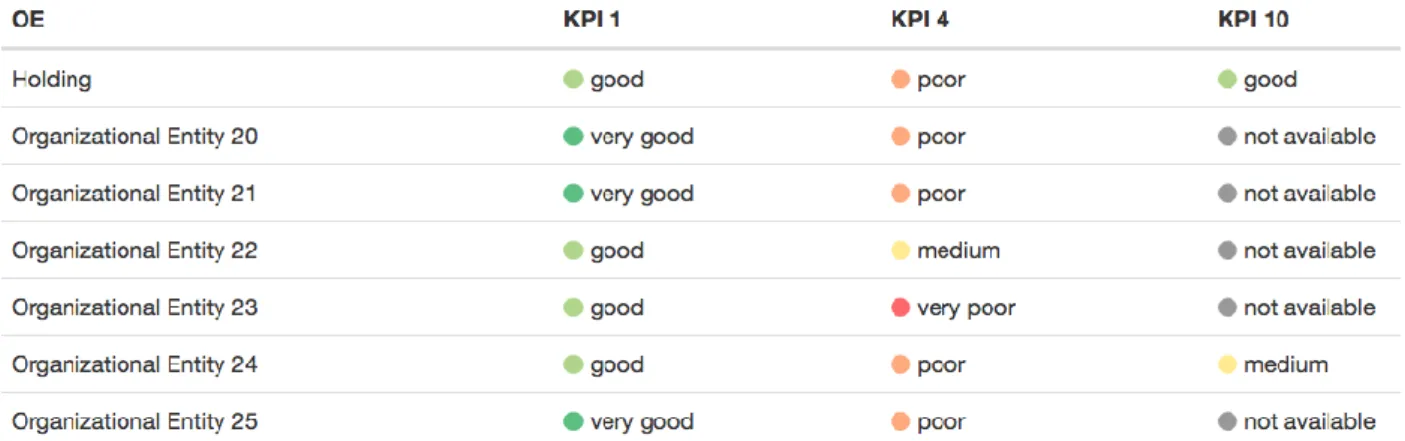
The Architecture View illustrated by Figure 8 is an interactive table that lists all OEs with the corresponding KPIs. In this view, the user has the option of dynamically changing the KPIs represented by the columns by means of a menu. Furthermore, this view supports the “what-if” scenarios. If the KPIs are changed, they are updated accordingly, because all conditions to display the technique’s result are fulfilled. In contrast to the world map, the syntax describing the
32
Figure 8. Tabular visualization of OEs
Finally, Figure 9shows the detailed view of a previously selected OE. The selection is made by an interaction in the two previously presented visualizations. By clicking on an OE, this visualization opens as a popup. The detail view provides an overview of all KPIs of the selected OE and shows the persons responsible. In contrast to the tabular view, the Base Language’s syntax also includes Measurement’s value and KPI’s thresholds, because thresholds and measured values are displayed. In addition, the KPIs contain a new relationship “parent” to optionally relat KPIs to parent one. This Architecture Viewpoint also fulfills all conditions for displaying the technique’s results.
Figure 9. Detail view for the representation of an OE
In order to assist users in planning value ranges for KPI’s categories, the exact location of each value within the determined category is displayed. Hereby the effort can be estimated to reach the next better category. For instance, the value measured for KPI 5 is 1. The threshold for the next better category is “very good.” This means that decreasing the reading by 1 results in the category “very good.”
5
Evaluation
33 The data collection is based on a qualitative expert survey. It aims to provide comprehensive information on the applicability of the extended conceptualization of the architectural description. For the survey, three strategic users were selected, whose roles are part of the global enterprise architecture management in the holding. Expert 1 is the CIO of the holding. He is responsible for the worldwide IT activities of the company. Since the focus of the practical test is on cybersecurity, Expert 2 is selected as the Information Security Officer (ISO). This expert is responsible for designing the company's information security management system. Expert 3 is responsible for the strategic planning of the IT architecture as well as for the specification of methods, standards and principles for the management of the IT architecture.
The interviews took place as a personal conversation. The statements of the experts were codified by written minutes and analyzed using the qualitative content analysis of Mayring [22] in the form of the summary. In this way, the key messages of the material to be analyzed can be worked out.
All experts see the usability of the Architecture Cockpit. As a result, according to the experts, the complexity of the presented facts can be reduced. The users also get a good overview of the current situation. One expert is particularly interested in the possibility of switching between the overview level (world map, table) and the detail view. This can be used to compare their status with the overall view of all OEs in dialogue with the persons responsible for the OEs and to discuss the respective deviation from the average.
Another expert sees in the use of the cockpit a very good identification of “outliers” and the quick way of recording the overall status. Overall, the experts see increased transparency about the facts. Consistent presentation, according to an expert, creates a frame of reference to quickly capture and recognize issues presented.
By using “what-if” scenarios, it is possible to control the OEs. The basis of these scenarios is the use of an Analysis Technique. In this way, effects on changed limit values can be played through to calculate the KPIs. One expert notes that the “what-if” scenarios for KPIs are a first step, but there is potential for more “what-if” scenarios, e.g. changed requirements of regulations.
In terms of efficiency, all experts see an increase in the preparation of tables and other graphical representations. So far this happened manually. This process was described by the experts as very time- and error-prone. By using the Architecture Cockpit, the processing is now automated and consistent. In addition, according to respondents, the information provided by the web application is easier and faster to access. In terms of control and monitoring of the OEs, the efficiency is increased so that the information can be made available at short notice. In addition, the Architecture Cockpit provides a social component of monitoring and control in an otherwise decentralized system by comparing across organizational units.
Through the target group-oriented preparation of the complex facts one expert sees an increased interest of the stakeholders and thus a more intensive occupation with the basic topic of cybersecurity. Another expert also sees the presentation of an overview of all OEs as an incentive for individual OEs to improve.
Furthermore, the use of “what-if” scenarios allows an analysis of the effects on changed limit values of a KPI in real time. Such scenarios for the future have not yet been played to this extent, since these calculations and their graphical preparation had to be done manually.
34 itself. The simple and rapid preparation of the complex facts also improves the collaboration between the stakeholders.
The ease of use of the Architecture Cockpit is considered by all experts to be good. Nonetheless, the experts expressed the suggestion for improvement of an export function. However, such a function should be well thought out. In data exports, it is very difficult to maintain data consistency, as they represent a state at a certain point in time and are therefore out of date over time. Much better would be to establish the Architecture Cockpit as a communication medium. Advantages of this are a very easy access via web browser and a constantly updated database.
6
Conclusion
The approach presented in this article addresses practical challenges in dealing with visualizations in the analysis and design of enterprise architectures [4]. The visualization capabilities of the tools used in practice are often poor. The visualizations are mostly static and provide only very initial interaction possibilities. This hinders the stakeholders in carrying out their duties. Stakeholders need flexible ways to meet their information demands.
To address these challenges, in this article we present an extended conceptualization of the architectural description. This allows for interactive visualizations and the execution of techniques. The basis of the conceptualization is the ISO Std. 42010 [2], which is extended and detailed by the integration of concepts of other work as well as own considerations.
For the evaluation of the conceptualization, a practical test was conducted in a global company in the financial and insurance industry. For this purpose, the conceptualization was implemented by a prototype, the so-called Architecture Cockpit. The focus of the practical test is the KPI-based monitoring and control of independent organizational entities with regard to cybersecurity. The prototype includes several interactive visualizations and an analysis technique to simulate changes in a KPI's underlying metrics in “what-if” scenarios.
The stakeholders interviewed after the practical test provided consistently positive feedback. They attested a good usability of the prototype for the fulfillment of their tasks. Furthermore, they are now able to create the visualizations automatically and consistently. Using “what-if” scenarios based on automated analysis techniques, stakeholders can now view and analyze real-time impact of changing a metric to calculate a KPI. Overall, the introduction of the Architecture Cockpit, according to the stakeholders, leads to an increase in efficiency in the performance of their tasks.
The developed conceptualization is a powerful basis for enabling interactive visualizations. Due to the generality it is possible to create any visualizations on this basis. The concrete visualization logic for the creation is based on the syntax, semantics and notation contained in the modeling language as well as on a model transformation, which transforms an EA into a visual model. Therefore, we want to further expand the prototype in future work in order to be able to use it flexibly for various purposes in EAM. In addition to the presentation of KPIs, in EAM, relationships within the EA are of special interest. Therefore, we want to extend the prototype to include visualizations, such as landscape diagrams or cluster diagrams. These visualizations can then be linked to other techniques from the literature. In order to realize this in a prototype, a catalog of available visualizations and techniques as well as the assignment of techniques to visualizations is required. If this catalog is part of the prototype, it becomes a flexible environment for analyzing and designing enterprise architectures.
References
[1] F. Matthes, S. Buckl, J. Leitel, and C. M. Schweda, Enterprise Architecture Management Tool Survey 2008. München, 2008.
35 engineering – Architecture description,” 2011.
[3] M. Lundqvist, “Information Demand and Use: Improving Information Flow within Small-scale Business Contexts,”Thesis No. 1323, Linköping niversity, 2007.
[4] D. Jugel, C. M. Schweda, A. Zimmermann, and S. Läufer, “Tool Capability in Visual EAM Analytics,” Complex Systems Informatics and Modeling Quarterly, CSIMQ, no. 2, pp. 46–55, 2015. Available: https://doi.org/10.7250/csimq.2015-2.04
[5] The Open Group, “TOGAF Version 9.1,” 2011. [6] The Open Group, “ArchiMate 3.0 Specification,” 2016.
[7] A. Wittenburg, “Softwarekartographie: Modelle und Methoden zur systematischen Visualisierung von Anwendungslandschaften,” Ph.D. dissertation, Technische niversität München, 2007. (In German)
[8] J. Lankes, F. Matthes, and A. Wittenburg, “Architekturbeschreibung von Anwendungslandschaften: Softwarekartographie und IEEE Std 1471–2000,” Softw. Eng. 2005, Fachtagung des GI-Fachbereichs Softwaretechnik, Lect. Notes Informatics, vol. 64, pp. 43–54, 2005. (In German)
[9] C. M. Schweda, “Development of Organization-Specific Enterprise Architecture Modeling Languages Using Building Blocks,” Ph.D. dissertation, Technische niversität München, 2011.
[10] D. Harel and B. Rumpe, “Modeling Languages: Syntax, Semantics and All That Stuff – Part I: The Basic Stuff,” Technical Report, Israel, 2000.
[11] H. Kühn, “Methodenintegration im Business Engineering,” Ph.D. dissertation, niversität Wien, 2004.
[12] D. Naranjo, M. Sánchez, and J. Villalobos, “PRIMROSe: A Graph-Based Approach for Enterprise Architecture Analysis,” in ICEIS (Selected Papers), Lecture Notes in Business Information Processing, Springer, vol. 227, pp. 434–452, 2015. Available: https://doi.org/10.1007/978-3-319-22348-3_24
[13] A. Ramos, J. P. Sáenz, S. Mario, and J. Villalobos, “On the Support of Automated Analysis Chains on Enterprise Models,” 16th International Conference, BPMDS 2015 20th International Conference, EMMSAD 2015 Proceedings, Business-Process and Information Systems Modeling, Lecture Notes in Business
Information Processing, Springer, vol. 214, pp. 345–359, 2015. Available:
https://doi.org/10.1007/978-3-319-19237-6_22
[14] D. Benavides, S. Segura, and A. Ruiz-Cortés, “Automated analysis of feature models 20 years later: A literature review,” Inf. Syst., vol. 35, no. 6, pp. 615–636, 2010. Available: https://doi.org/10.1016/j.is.2010.01.001
[15] A. Ramos, “EnAr-ArchiAnalysis,” Departamento de Ingeniería de sistemas y computación – Proyecto– Enar,” 2015. [Online]. Available:
http://backus1.uniandes.edu.co/~enar/dokuwiki/doku.php?id=archianalysis#analysis_function_catalog. [Accessed: 18-Mar-2016].
[16] I. Hanschke, Enterprise Architecture Management – einfach und effektiv (2. Auflage). München: Carl Hanser Verlag München, 2016. (In German)
[17] I. Hanschke, “Analyse-Muster – Download-Anhang A zum Buch EAM – einfach und effektiv,” München, 2016. (In German)
[18] I. Hanschke, “Download-Anhang B zum Buch EAM – einfach & effektiv,” München, 2016.
[19] D. Jugel, S. Kehrer, C. M. Schweda, and A. Zimmermann, “Providing EA decision support for stakeholders by automated analyses,” in Lecture Notes in Informatics (LNI), Proceedings – Series of the Gesellschaft fur Informatik (GI), 2015, vol. 244.
[20] F. Matthes, I. Monahov, A. Schneider, and C. Schulz, “EAM KPI Catalog,” 2011.
[21] D. Karagiannis and H. Kühn, “Metamodelling Platforms,” in E-Commerce and Web Technologies, Lecture Notes in Computer Science, Springer, vol. 2455, pp. 182–182, 2002. Available: https://doi.org/10.1007/3-540-45705-4_19
![Figure 1. Detailing the Architecture Viewpoint [2] by integrating building blocks [9]](https://thumb-us.123doks.com/thumbv2/123dok_us/7976033.2116843/6.892.249.670.188.439/figure-detailing-architecture-viewpoint-integrating-building-blocks.webp)
![Figure 2. Clarification of the Architecture View [2] through software cartography concepts [7], [8]](https://thumb-us.123doks.com/thumbv2/123dok_us/7976033.2116843/7.892.289.629.643.900/figure-clarification-architecture-view-software-cartography-concepts.webp)