Research Article
a
December
2018
Computer Science and Software Engineering
ISSN: 2277-128X (Volume-8, Issue-12)
Leveraging Computer-Based Forecasting Techniques for
Effective Geographic Information Management
ONU .F.U. (PHD)1, OHIRI Thaddeus2, MMEAH Shedrack3, BAAH Barida4 1, 2, 4
Department of Computer Science, Ebonyi State University, Abakaliki – Nigeria
3
Department of Computer Science, Ken Saro Wiwa Polytechnic, Bori, Rivers State - Nigeria
[email protected], [email protected], [email protected], [email protected]
Abstract: Research from developed and highly industrialized nations of the world have proved that lack of reliable and accurate data and information has been the bane of Africa’s, Nigeria in particular, socio-economic and political development. Ideally geographic data or information like population figures is usually a statistical index for wealth distribution, proper economic management and governance which translates into a holistic development. Nigeria in this vane or regard, from time immemorial have not presented any population figure that is not a product of a headcount process or census. The census process had been and is still dependent on, even in this digital age or economy, one hundred percent manual methods. Furthermore their methods of data collection during the census exercises is still based on observations, interviews, JAD Sessions, questionnaires and document analysis. These requirements (data) elicitation techniques have their little strengths and major weaknesses especially in a developing country like Nigeria. Hence total reliance on them is not advisable. Real-time population data will now be generated using Verhulst techniques in this process. Temperature which regulates weather conditions are also very important geographic components. Adequate and reliable weather statistics have to be generated through forecasts using wave models. The work aim is to provide a blueprint for the software development process, using some methods that are embedded in a typical system development life circle (SDLC)- The outcome is Management Information System (MIS) called NGIS (a type of Decision Support System). NGIS means Nigerian Geographic Information System. It will impact positively on Nigeria’s socio-political and economic developments.
Keywords: Events-driven programming, Verhulst techniques, Wave models, GIS. MIS.
I. INTRODUCTION 1.1 BACKGROUND OF STUDY
Evidence – proof surveys have shown that non of the software‟s used today in Nigeria, even notable or known GIS softwares, were developed in compliant with Nigeria‟s geographical database, nor were they developed by Nigerian scientists who understands the peculiarities and uniqueness of our ecosystem, neither were they developed by a Nigerian company. They are all off-the-shelf, exotic or foreign products. No wonder counsel or advice from their data have always failed us right from the pre-colonial times till date.
Secondly our decision-makers have not had access to a better information due to lack of effective management system. Hence the need for a functional process blue print of an effective indigenous software.
NGIS will be known for enhancing decision making. NGIS will have modelling capabilities, enabling managers to generate and change data and automatically revise business scenarios to find better solutions. NGIS will support decisions that require knowledge about the geographic distribution of Nigerian people and other resources in Nigeria. NGIS is going to be a special category of decision support system that will use data visualization technology to analyze and display data for planning and decision making in the form of digitized maps. The software generates, assembles, stores, manipulates and displays geographically referenced information, tying data/objects to points, lines and areas on a map.
Object – Oriented Programming (OOP) models the real world by computational analogies
When computational models are used to form programs, these programs are meant to contain classes, objects, methods, inheritance and polymorphism which translates into object-oriented programs [1].
ISSN(E): 2277-128X, ISSN(P): 2277-6451, pp. 26-37 1.2 MOTIVATION (IMPORTANCE)
The main importance of this paper to the field of geographic modelling, simulation and control are as follows: A model of adaptive automated predictive (forecasting) paper using Verhulst and wave techniques is a contribution to the remote sensing field; although existing at the moment only as a concept in Nigeria.
A prototype of an intelligent forecasting system (computer, now working as a satellite) is also an original contribution to the field of advanced geophysics; its concept developed in hope to significantly improve the simulation of remote sensing systems in Nigeria today and in future. According to information available to me, no similar system is being developed or in process of development in Nigeria.
These will benefit among other users in Nigeria:
• Industrialist and Entrepreneurs
• Farmers
• Meteorologists and the organized public sectors
1.3 AIM AND OBJECTIVE OF THE STUDY
The solution (Technical Blueprint) offered in this paper is the concept and working prototype of a satellite simulator system.
The specific objectives are as follows:
1. To Investigate and evaluate the high cost implications on Nigeria‟s socio-economic and political survival of depending or relying on the out-dated census method of gathering population information; analog/costly method of gathering climatic data; and dependence on Nigeria‟s highly politicized moribund satellite system called Nigercomsat1 and Nigercomsat2.
2. To investigate the role of a conventional Geographic Information System (GIS).
3. To investigate how best to model, simulate and prototype a geographic information system to function as software object classes that can mimic the real-world situation [1].
II. LITERATURE REVIEW 2.1 INTRODUCTION OF CONCEPTS
2.1.1 Research Design
Needless to say, not all mistakes are so huge, computer foul-ups can range from minor to catastrophic. But there are many scenarios or case studies that shows how important planning is, especially when an organsiation is trying to launch a new kind of system. Remember the saying “if you fail to plan, you plan to fail”. The best way to avoid such mistakes is to employ systems analysis and design. But, you may say, you are not going to have to wrestle with problems of mega or large scale. That‟s a job for computer professionals. You are mainly interested in using computers and communications to increase your own productivity. Why, then, do you need to know anything about systems analysis and design.
In many types of jobs, you may find that your department or your job is the focus of a study by a systems analyst. Knowing how the procedure works will help you better explain how your job works or what goals your department is supposed to achieve. In progressive companies, management is always interested in suggestions for improving productivity. Systems analysis provides a method for developing such ideas.
2.1.1.1 The Purpose of a System
A system is defined as a collection of related components that interact to perform a task in order to accomplish a goal. A system may not work very well, but it is nevertheless a system. The point of systems analysis and design is to ascertain how a system works and then take steps to make it better. An organization‟s computer-based information system consists of hard-ware, software, people, procedures, and data, as well as communication setups. These components work together to provide people with information for running the organization.
ISSN(E): 2277-128X, ISSN(P): 2277-6451, pp. 26-37
Fig. 2: Submenu of Software and Hardware and its menu Items[3]
2.1.1.2 Getting the Project Going: How it starts, who’s Involved
Who are the three kinds of users of a project? A single individual who believes that something badly needs changing is all it takes to get the project rolling. An employee may influence a supervisor. A customer or supplier may get the attention of someone in higher management. Top management may decide independently to take a look at a system that seems inefficient.
A steering committee may be formed to decide which of many possible projects should be worked on. Participants in the projects are of three types:
• Users: The system under discussion should always be developed in consultation with users, whether floor sweepers, research scientists, or customers. Indeed, if user involvement in analysis and design is inadequate, the system may fail for lack of acceptance.
• Management: Managers within the organization should also be consulted about the system.
• Technical staff: Members of the company‟s information systems (IS) department, consisting of systems analysis and programmers, need to be involved. For one thing, they may have to execute the project. Even if they don‟t, they will have to work with outside IS people contracted to do the job. Complex projects will require one or several systems analyst. A system analyst is an information specialist who performs systems analysis, designs, and implementation. The analysts job is to study the information and communication needs of an organization and determine what changes are required to deliver better information to the people who need it. “Better” information means information that is summarized in the acronym CART – complete, accurate, relevant, and timely. The systems analyst achieves this goal through the problem-solving method of systems analysis and design.
2.1.2 Manu Driven System Design
A menu consists of menu items that the user can select (or toggle on or off). Menus make selection easier and are widely used in window applications. Menus provides comprehensive solution for building graphical user interface. Hence window applications or softwares are examples of menu driven system. That is they are softwares that are controlled by menus. Every object-oriented and visual programming language has the necessary or needed codes to create menus and the system they drive.
Fig. 3: A dropdown Menu used to Select Option from a list[3]
2.1.2.1 Input and Output Interface Design
DESIGNING ON-SCREEN FORMS FOR DATA INPUT
• Much of the data that enters computer system needs to be typed in. A well-designed on-screen form can make this task easier and quicker. On-screen forms should:
ISSN(E): 2277-128X, ISSN(P): 2277-6451, pp. 26-37 • Have obvious places for user input (boxes, use of colour, etc).
• Use appropriate controls for each field.
• Have text box controls that are the right-size for the data.
• Have easy-to-understand instructions (if needed).
• Make good use of the screen area available.
Form Controls:
On-screen forms can have a variety of controls (the little buttons/boxes that you click or type in).
Fig. 4: A Text Input Box[3]
Fig. 5: Option/Ratio Button Used to Select an Option (only one can be selected) [3]
Fig. 6: Tick/Check Boxes Used to Select Option (More than one item can be ticked) [3]
Fig 7. : An Onscreen Form for Data Input[3]
Above is an example of a well-designed on-screen form for data input. Note the clear instruction labels and layout.
ISSN(E): 2277-128X, ISSN(P): 2277-6451, pp. 26-37 Data Validation Techniques
• When data is input to a computer, it is a good idea for the computer to check that the data is sensible (no dates of birth in the future, etc). Checks like this are called validation checks (is the data valid?)
• Different validation checks can be used on different fields, depending on the type of data being entered.
• Presence check: Is data actually present in a field, or has it been missed out?
• Range check: Is the data value within a set range? (Eg. An exam mark should be between 0% and 100%, a month should be between 1 and 12).
• Length check: Is an item of text too short or too long?
Fig. 8: An error message due to wrong input in phone number[3]
Data Verification Techniques
Data validation only checks whether the data entered is sensible – it does not mean that the data is the right data. For example, if you are entering a date of birth and you mis-type it…
• Correct data of birth: 12/11/1982
• Data of birth entered: 12/11/1928
…. You would not see an error, since 12/11/1928 is a valid date of birth. To check that data is the correct value, we use a system called data verification. There are two methods of data verification:
• Proof Reading: After the data has been entered a person compares the original data with the data in the computer (either on the screen or using a printout). If mistakes are spotted they can be corrected by the person. Proof-reading is quick and simple, but doesn‟t catch every mistakes.
• Double – Entry: The data is entered into the computer twice (preferably by two different people). The computer compares the two sets of data to see if they match. If not it generates an error and a person will need to correct the mistake. Double-entry takes more time and effort, but it catches almost every mistake.
2.1.2.1.2 Designing the System Outputs
There are usually two types of output from a system that need to be designed: On-screen reports (information displayed on the monitor).
Printed reports (hard copy to be mailed, filed, etc).
Designing On-screen Report
• Designing an on-screen report is similar to designing an on-screen form (see fig. 4). There are a number of things that the designer should consider. On-screen reports should…
• Show all of the necessary fields.
• Have fields that are the right-size for the data
• Have easy-to-understand instructions (if needed).
• Make good use of the screen area available.
• Make good use of colours and fonts to make the data clear.
• On-screen reports can include more than just text.
• Reports can include: text, images, bar charts, pie charts, Animations, video etc.
• This is an example of a well-designed on-screen report used to show details of an employee.
Designing Printed Report
ISSN(E): 2277-128X, ISSN(P): 2277-6451, pp. 26-37 Process Plan: Designing the system process
Any system has to process the data it is given. The system designer has a number of things to consider.
Designing Data and file Structures
• A data structure is an organized collection of data. Most commonly, this will be some sort of database in which data will be stored as it is being processed.
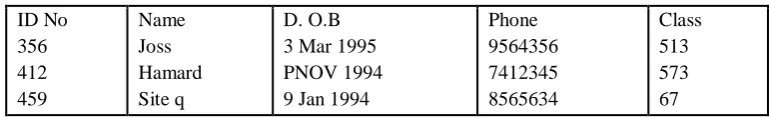
Table 1: A database showing ID-NO, Name, Date of birth(DOB), Phone and Class
When designing a database, the system designer needs to consider;
• The type of data being stored (numbers, text, Dates, etc)
• The size of the data (how long is a typical name etc)
• The field names to use
• How many records will need to be stored
• The designer also need to consider which backing storage device and media will be suitable to store the data.
• How often will the data need to be accessed
• How quickly the data needs to be accessed
• How large will the data files be.
• So, for example, if there is a large amount of data that needs to be accessed quickly and regularly, then a hard drive could be the best storage device to use.
2.1.2.2.2 Designing how the data will be processed
The system designer needs to design the actual steps to be followed to process the data (the algorithm). For example, let us consider a scenario for a given exponential moving average (EMA) algorithm for forecasting the attendance of students in a Professor‟s class, given five(5) actual attendance. EMA algorithm is taken as a software object class.
EMA program module is a follows[3]:
// Selecting S will compute simple moving average // Selecting E will compute exponential moving average // Selecting W will compute weighted moving average // Perform selected operation
Switch (MA) {
Case „S‟ : Computes simple moving average; Break;
Case „E‟: // create an array for actual attendance Object [ ] actualList = new Object [5]; // Data entry code for actual attendance Java. Util. scanner input =
New java. Util. scanner (system. in);
System. Out. Print ( “Enter” + actualList. Length+ “values :”); For ( int i = o ; i< actualList. Length; i+ + )
ActualList [i] = input Next Object ( ) ;
Object [ ] forecastList = new object [45] //Create an array to store original attendance and // Forecasts.
Object [ ] actualList = new object [45] Int c =5
While (c< 45) {
Forecast List [c] = actualList [c-2] + 2 c+2 (actualList [c-1]- actualList [c-2])
c++; ID No 356 412 459 Name Joss Hamard Site q D. O.B 3 Mar 1995 PNOV 1994 9 Jan 1994
ISSN(E): 2277-128X, ISSN(P): 2277-6451, pp. 26-37
}
//Display EMA result
For (int c = 5; c< forecast.Length; c++){
System . out. Print ( “EMA forecast Result” + forecast List [c] + “ “); }
Break;
Case „W‟ : Computes weighted moving average; Break;
Default: System. out. print. In (“Errors: invalid status”); System. exit (O);
}
2.2 EVENT DRIVEN PROGRAMMING
When you run a Java GUI (graphical user interface) program the program interacts with the user and the events drive its execution. An event can be defined as a signal to the program that something has happened. Events are triggered either by external user actions such as mouse movements, button clicks and keystrokes or by internal program activities, such as a timer. The program can choose to respond to or ignore an event[3].
The component that creates an event and fires it is called the source object or source component. For example, a button is the source object for a button – clicking event. An essential part of event-driven programming is writing code that responds to all the possible events that may occur in an application[3].
2.2.1 Menus, Toolbars and Dialogs
In user interfaces, a toolbar is often used to hold commands that also appear in the menus. Frequently used commands are placed in a toolbar for quick access. Clicking a command in the toolbar is faster than choosing it from the menu[3].
2.2.2 Graphical User Interface
A graphical user interface (G U I) makes system user friendly and easy to use. Creating a GUI requires creativity and knowledge of how GUI components work. Since the GUI components in Java are very flexible and versatile, you can create a wide assortment of useful user interfaces. Examples of GUI components are Buttons, Combobox, list, check box, Radio Button, labels, scroll Bars, Text fields etc[3].
2.2.3 Object oriented and visual programming
In OOP, data and the instructions for processing that data are combined into a self – sufficient “Object” that can be used in other programs[3].
An object is a self – contained module consisting of preassembled programming code. The module contains or encapsulates, both (1) a chunk of data and (2) the processing instructions that may be performed on that data[3].
2.2.4 The working principle of a satellite
There are the natural and artificial satellite. The natural are found among the earth‟s galaxy like moon, sun, and stars. The satellite is an object/device that is used to search for and collect information about the earth. A satellite network is a combination of nodes which are made up of sensors and repeaters for data collection and transmission respectively. Satellites can provide transmission capability to and from any location on Earth , no matter how remote(FOROUZAN, 2011).
This advantage makes high quality communication available to undeveloped parts of the world without requiring a huge investment in ground- based infrastructure (FOROUZAN, 2011)
2.2.5 Existence of predictive models 2.2.5.1Simple Regression Models
The simple linear (or straight line) regression model is: Y = Ny/x + € = Bo+ BX + € [7]
1. Ny/x = Bo + BX is the mean value of the dependent variable Y when the value of the independent variable is x.
2. Bo is the y- intercept Bo is the mean value or y when x equals zero. 3. B1 is negative, the mean value or y decreases as x increases.
4. ∑ is an error term that describes the effects on y of all factors other them the value of the independent variable x.
2.2.5.2 The Multiple Regression Model
ISSN(E): 2277-128X, ISSN(P): 2277-6451, pp. 26-37
Y = Uy/x11 x21 ……… Xk + € = Bo + B1 X1 + B2 X2 + …… + Bk Xk + € [7] Here (1) Uy/x11 x21 ……… Xk + € = Bo + B1 X1 + B2 X2 + …… + Bk Xk is
the mean value of the dependent variable y when the values of the independent variables are X1, X2 ……….. XK.
(2) Bo, B, B2 …….. Bk are (unknown) regression parameters relating the mean value of y to X1, X2 ……….. Xk.
(3) € = is an error term that describes the effects on y of all factors other than the values of the independent variables X1, X2, …….. XK.
2.2.5.3 Wave Model
𝝏𝒖 𝝏𝒕.
𝟏 𝒄𝟐=
𝝏𝟐𝒖 𝝏𝒙𝟐+
𝝏𝟐𝒖 𝝏𝒚𝟐+
𝝏𝟐𝒖 𝝏𝒛𝟐 [8]
𝑐2
= 𝐾 𝑃𝜎
This is the heat equation, the fundamental Partial Differential Equation (PDE) modelling heat flow. It gives the temperature U (x, y, z, t) in a body of homogeneous material in space. The constant c2 is the thermal diffusivity.
k is the thermal conductivity, 𝜎 the specific heat and P the density of the material of the body. ∇2u is the Laplacian of u with respect to the Cartesian coordinates x, y, z .
2.2.5.4 Verhulst Model The Verhulst Model is
𝑑𝑁
𝑑𝑡 = 𝜏𝑁 − 𝛾𝑁
2 [8]
𝑁 𝑡 = 𝐶𝑒−𝛾𝑡 + 𝜏 𝛾 [8]
𝜏 =Birth rate
𝛾 = 𝐷𝑎𝑡𝑒 𝑅𝑎𝑡𝑒
Population growth is represented more realistically in many cases by assuming that the number of individuals N in the population at time t is described by the Verhulst model N1 = 𝜏y – 𝛾N2, where 𝜏>O and 𝛾>O are constants. The additional term – 𝛾𝑁2 is the result of some cause that tends to limit the ultimate growth of the population [8]. For example, such a cause could be insufficient living space or food supply, when the population becomes sufficiently large. Concerning the choice of – 𝛾𝑁2 for the term representing the effect of the cause, one can argue as follows: Assuming the cause affects the entire population of N members then the effect on any one individual is proportional to N. Thus the effect on all N individuals in the population would be proportional to N. N = N2[8].
• We also assume an initial condition of the form N (t0) = N0. In most cases the constant 𝛾 is very small compared to the constant 𝜏. Thus for sufficiently small N, the term 𝜏𝑁 predominates and so the population grows very rapidly for a time.
• However, when N becomes sufficiently large, the term – 𝛾N2 is of comparatively greater influence, and the result of this is a decrease in the rapid growth rate[8].
• The verhulst equation plays an important role in population dynamics – a field that models the evolution of populations of plants, animals or humans over time t[8].
2.2.6 Existence of predictive software 2.2.6.1 Microsoft Excel
This is a spreadsheet application software that uses predictive models like regression etc to make forecasts given data warehouse (i.e data mining) [7]
2.2.6.2 Geographic information system (GIS)
Geographic information system (GIS) are a special category of DSS (decision support system) that use data visualization technology to analyze and display data for planning and decision making in the form of digitized maps[9]. The software assembles, stores, manipulates, and displays geographically referenced information, tying data to points, lines and areas on a map. GIS have modelling capabilities enabling managers to change data and automatically revise business scenarios to find better solutions[9].
ISSN(E): 2277-128X, ISSN(P): 2277-6451, pp. 26-37 III. METHODOLOGY
Introduction
We studied leveraging computer-based forecasting techniques for effective geographic information management.
• The emphasis was on Nigeria‟s geographic information system for effective management.
3.1 GEOGRAPHIC FEATURES AS OBJECT CLASSES
The geographic features considered are:
1 Temperatures and their forecasts at different position and times in Nigeria.
2. Population of individual states in Nigeria and predictions given death rates, birth rate, and availability of food supply.
3. Maps of individual states in Nigeria showcasing relief, drainage, vegetation transportation, port development, Hill/ Mountains, Rivers , agriculture, live being and fishing.
3.1.1 Object – Oriented Analysis of NGIS Software In the models:
The Wave Model is
𝝏𝒖 𝝏𝒕.
𝟏 𝒄𝟐=
𝝏𝟐𝒖 𝝏𝒙𝟐+
𝝏𝟐𝒖 𝝏𝒚𝟐+
𝝏𝟐𝒖 𝝏𝒛𝟐 [8]
𝑐2
= 𝐾 𝑃𝜎
This is the heat equation, the fundamental Partial Differential Equation (PDE) modelling heat flow. It gives the temperature U (x, y, z, t) in a body of homogeneous material in space. The constant c2 is the thermal diffusivity.
k is the thermal conductivity, 𝜎 the specific heat and P the density of the material of the body. ∇2u is the Laplacian of u with respect to the Cartesian coordinates x, y, z .
The Verhulst Model is
𝑑𝑁
𝑑𝑡 = 𝜏𝑁 − 𝛾𝑁2 [8] 𝑁 𝑡 = 𝐶𝑒−𝛾𝑡 + 𝜏 𝛾 [8]
𝜏 =Birth rate
𝛾 = 𝐷𝑎𝑡𝑒 𝑅𝑎𝑡𝑒
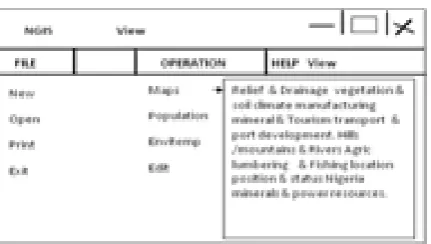
3.2 OBJECT ORIENTED DESIGN OF THIS SOFTWARE. NGIS
Fig. 9: A Main Menu Design of NGIS Software
ISSN(E): 2277-128X, ISSN(P): 2277-6451, pp. 26-37 3.2.4 Process Design of NGIS Software
Designing data and file structure. This is a database in which data will be stored as it is being processed. Remark: Note that the focus of my reporting is the process of the software development and not the statistics hence these figures are dummy.
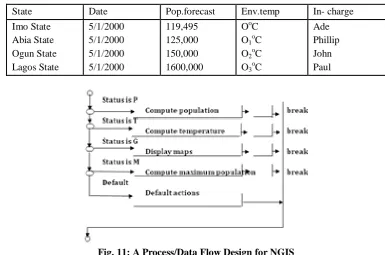
Table 2: A database for NGIS Software
State Date Pop.forecast Env.temp In- charge
Imo State Abia State Ogun State Lagos State
5/1/2000 5/1/2000 5/1/2000 5/1/2000
119,495 125,000 150,000 1600,000
OoC O1oC O2oC O3oC
Ade Phillip John Paul
Fig. 11: A Process/Data Flow Design for NGIS
3.2.3.1 Process Dynamics
The main program object class is the calling module; while the called object classes are population model module (simulation), Temperature model module, maximum population model module, Geographic maps module and the Text Editor module. This is realised by the use of the switch and break statements. The switch statement checks all cases and executes the statement in the matched case. If matched, the corresponding module is computed; if not matched, a message is displayed.
3.2.4 Main Program Design Segment.
// Coding with java programming language . // Main Program
... // user interface development ... ... // switch statement
Switch (op) {
Case „p‟: compute population;
Break;
Case „T‟: compute temperature; Break;
Case G‟: map display; Break;
Case „M‟: maximum population Break:
Default: }
}
ISSN(E): 2277-128X, ISSN(P): 2277-6451, pp. 26-37
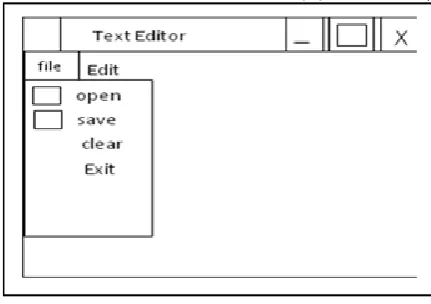
Fig. 12: A Text Editor Module Output for NGIS
3.2.5.1 Access to Internet
This program can be logged into the internet for universal accessibility through the INTERNET WIZARD command of the source code‟s Integrated Development Environment (IDE)of Java compiler/interpreter
3.2.5.2 Security of System
This system can be secured by using a password authentication object class. And also by the installation of a sensor firewall object class.
IV. DISCUSSION AND EVALUATION
We cannot go beyond our earlier –stated research scope – that is provision of a blueprint for the software development process. In view of the above, we affirm that this prototype ensures generation, security, accessibility, availability, retrievability, validation/updates, verification and modification of information in a typical geographic system, Nigeria in particular. Hence ensuring effectiveness in Nigerian geographic information management
Contribution to Knowledge
• NGIS might be used to help farmers identify fertile lands for grazing and crop production, help states to calculate their population densities and make daily weather forecasts; or to help industrialists/investors identify the best locations for citing their plants. As a matter of fact NGIS is all encompassing, showcasing maps, relief and drainage; location, position and size of Nigeria; climate, vegetation and soil; population; temperature distribution; mineral and power resources; agriculture, lumbering and fishing; manufacturing industries; commerce and tourism; transportation and port development; geographical regions of Nigeria in digitized maps and tables.
• Provision of a Decision support package for investors in Nigeria via this simulator. Provision of an event-driven or an object – oriented program that has the ability and capacity to reduce the work-load and improve the efficiency of geophysicist and meteorologist-hence an ergonomically biased package.
• With proper time availability, this software development process can be implemented and distributed at commercial quantity to scientist, engineers and researchers, hence being a source of income generation for the developer and any other person found in the software production value-chain.
• The cost of information procurement from other international satellite systems like Explorer 1, Arial 1 and Asterisks from USA, UK and France respectively for national development will now be reduced to the barest minimum in Nigeria.
V. CONCLUSION
In conclusion, this paper if not for any other thing, it has given an insight on the design methodology of forecasting software called Nigerian Geographic Information System (NGIS) which can be a resource material for Geoscientist, Environmentalist and researchers.
REFERENCES
[1] Onu Fergus Uchenna (Ph.D) and Ohiri, Thaddeus, (2016) “Enhancing cutting-age processing system using OOP, with emphasis on industrial simulators “http://ijrsp.org index.php/current issue. India
ISSN(E): 2277-128X, ISSN(P): 2277-6451, pp. 26-37
[3] Y. Daniel Liang (2006), Introduction to Java Programming, 8th Edition
[4] Coleman, D.Arnold P., Bodoff, S., Dollin C., Gilchrist H., Hayes, F. and Jeremae P., (1994) Object –Oriented Development: The Fusion Method, Prentice-Hell, Inc Englewood Cliffs NJ.
[5] Chellappa R., Philips P.J and Reynolds D., (EDs) (November 2006). Special issues on Biometrics: Algorithms and Application of Fingerprint, Iris, Face Gait and Multimodal Recognition. Proceedings of the IEEE Vol 94 No.11.
[6] Chen, G and Szymanski, B.K (December 2001). “object-oriented Paradigm: Component-oriented Simulation Architecture Toward Interoperability and Inter Changeability,” proceedings of the 2001 Winter Simulation Conference (WSC2001), pp, 49-501, Arlington VA.
[7] Bowerman.O. Cornel. Orris. Porter(2008), Essential of Bussines Statistics 2nd Edition [8] Erwin Kreyszig ,(2010), Advance engineering Mathematics . Tenth edition
![Fig. 1: A window from a menu driven System[3]](https://thumb-us.123doks.com/thumbv2/123dok_us/7803493.2084608/2.595.188.409.656.779/fig-window-menu-driven.webp)
![Fig. 2: Submenu of Software and Hardware and its menu Items[3]](https://thumb-us.123doks.com/thumbv2/123dok_us/7803493.2084608/3.595.192.406.567.690/fig-submenu-software-hardware-menu-items.webp)
![Fig 7. : An Onscreen Form for Data Input[3]](https://thumb-us.123doks.com/thumbv2/123dok_us/7803493.2084608/4.595.174.423.465.733/fig-an-onscreen-form-data-input.webp)