USING MICRO CT IMAGING TO UNDERSTAND K-FELDSPAR MEGACRYST ORIGIN, CRYSTALLIZATION, AND TEXTURAL COARSENING
Justine G. Grabiec
A thesis submitted to the faculty at the University of North Carolina at Chapel Hill in partial fulfillment of the requirements for the degree of Master of Science in the Department of
Geological Sciences.
Chapel Hill 2019
Approved by: Drew S. Coleman Ryan D. Mills
iii
ABSTRACT
Justine G. Grabiec: Using Micro CT Imaging to Understand K-Feldspar Megacryst Origin, Crystallization, and Textural Coarsening
(Under the direction of Drew S. Coleman)
iv
v
ACKNOWLEDGEMENTS
I would like to thank Drew Coleman for indispensable discussions and support while keeping me grounded during particularly stressful periods. Thank you to Ryan Mills for insightful input, valuable perspectives, and lighthearted jokes. I want to thank Sarah Penniston-Dorland for sparking my passion for petrological fieldwork and for offering invaluable advice. Thank you to Allen Glazner for initial project ideas and construction, and field assistance along with Bryan Law and the GEOL72H first-year seminar students from 2018 and 2019. Thank you to Sean Gaynor and Joshua Rosera for fresh pots of office coffee, Lauren Graniero and Madelyn Percy for welcoming me to Chapel Hill with open arms, and Adam Nicastro for midday laughs.
This study was funded by the Martin Trust, administered by the Department of
Geological Sciences at the University of North Carolina at Chapel Hill. Additional funding was provided by the Lipman Research Award (Geological Society of America Grant 12049-17). A portion of this research was conducted at the Duke University Shared Materials Instrumentation Facility (SMIF), a member of the North Carolina Research Triangle Nanotechnology Network, which is supported by the National Science Foundation (Grant ECCS-1542015) as part of the National Nanotechnology Coordinated Infrastructure. Special thanks to Justin Gladman at SMIF for assistance during data collection and reconstruction.
Continual thanks to Christina, Jeffrey, Jeremy, Mary Ann, and Josie Grabiec for
vi
vii
TABLE OF CONTENTS
LIST OF TABLES ... ix
LIST OF FIGURES ... x
LIST OF ABBREVIATIONS AND SYMBOLS………...xi
INTRODUCTION ... 1
Pluton Formation ... 2
K-Feldspar Megacrysts in Granitoids ... 4
End-Member Hypotheses ... 5
Phase Equilibria... 8
Dissolution-Reprecipitation ... 9
Testing the Hypotheses………..11
GEOLOGIC SETTING ... 12
Tuolumne Intrusive Suite ... 12
K-Feldspar Megacrysts in Tuolumne ... 15
METHODS ... 17
RESULTS………..22
viii
Skeleton Plot Correlations ... 25
Microstructures and Inclusions ... 27
DISCUSSION ... 29
Inter- and Intracrystalline Zone Patterns ... 29
Local Heterogeneities ... 32
Evidence for Dissolution-Reprecipitation ... 33
Mineral Inclusions ... 34
The Static Crystal Matrix ... 36
Model for Megacryst Formation ... 37
CONCLUSIONS... 39
ix
LIST OF TABLES
x
LIST OF FIGURES
Figure 1: Cut megacryst hand sample and megacryst mosaic in glacial slab ………..5
Figure 2: Schematic of two end-member hypotheses. ... 7
Figure 3: Dissolution-reprecipitation schematic. ... 10
Figure 4: Epidote-filled veins. ... 11
Figure 5: Map of Tuolumne Intrusive Suite ... 13
Figure 6: Modified version of Figure 5 from Johnson and Glazner (2010) ... 18
Figure 7: Micro CT slice and three-dimensional reconstructions ... 19
Figure 8: Mapping process... 20
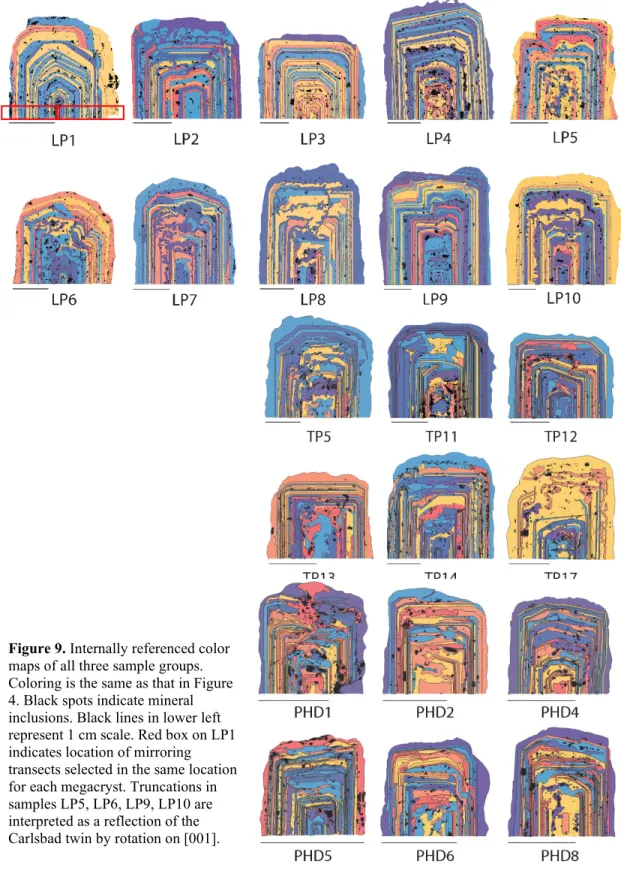
Figure 9: Megacryst maps. ... 21
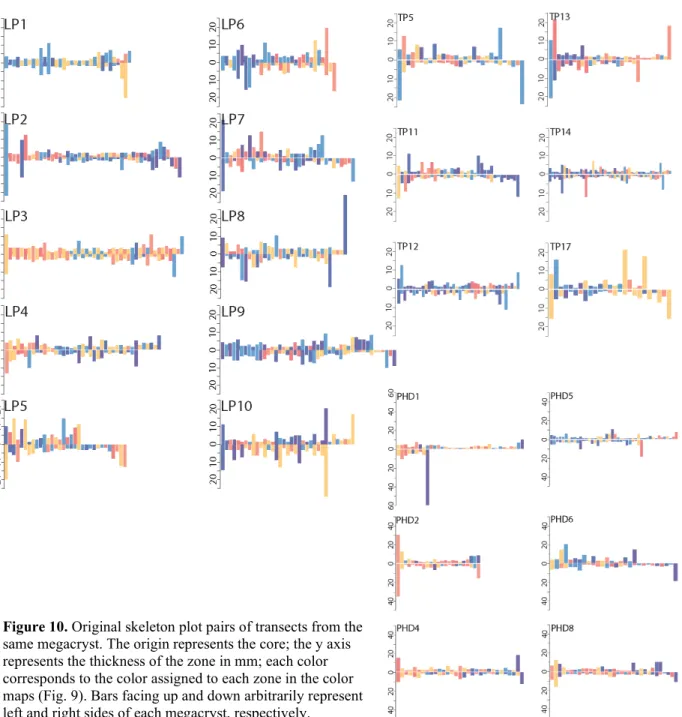
Figure 10: Original skeleton plots... 22
Figure 11: Length-normalized skeleton plots ... 23
Figure 12: Altered skeleton plots ... 24
Figure 13 Boxplots of R2 values from map transects ... 25
Figure 14: Boxplots of R2 values of skeleton plot transect pairs. ... 26
Figure 15: Plots of R2 versus percentage of core-to-rim transect ... 27
Figure 16: Grayscale variations within individual zones in a single megacryst ... 28
Figure 17: Microstructures in micro CT scans ... 29
xi
LIST OF ABBREVIATIONS AND SYMBOLS
(100) Miller index for crystallographic plane
[100] Miller index for crystallographic rotation axis
cm centimeter
CSD crystal size distribution
°C degrees Celsius
g gram
Ka thousands of years/thousands of years before present
LP sample prefix for megacryst population 1 from Cathedral Peak Granodiorite
m meter
Ma millions of years/millions of years before present Micro CT micro X-ray computed tomography
μm micrometer
mm millimeter
Orx orthoclase fraction
R2 measure of linear correlation
PHD sample prefix for megacryst population 3 from porphyritic Half Dome Granodiorite
TP sample prefix for megacryst population 2 from Cathedral Peak Granodiorite
1
INTRODUCTION
Granitic and granodioritic rocks provide the structural foundation of our continents, produce economically important ore deposits, and create majestic landscapes used by many for recreational purposes. Granitoid rocks are apparently unique to Earth among the planets in our solar system and provide petrographic, geochemical, and geochronological records of late-stage magma evolution and continent formation (Ackerson et al., 2018). However, many mechanisms of granitoid formation are poorly understood. Recent studies (Coleman et al., 2004; Glazner et al., 2004) frame granites as having accumulated via incremental assembly, integrating perhaps millions of years of growth and thermal history. Consequently, granitic textures, which have dominantly been interpreted to preserve a record of crystallization in magmas, are likely to be misinterpreted.
In this study, detailed analyses of zoning and intracrystalline microstructures in
2
pluton formation. Thus, by determining under what conditions megacrystic and granitic textures are formed, pluton formation via incremental assembly can be described more fully at the mineral scale.
Pluton Formation
The origin of granite has been discussed in depth over the past century. Original ideas hypothesized that granites were the result of the infiltration of fluids and ions that “granitized” sedimentary and metamorphic protoliths. Later studies suggested that granite origins are a dichotomy, either magmatic or metamorphic; even later studies confirmed that granites are indeed magmatic in origin (see Gilluly volume, 1948). Whereas these interpretations consider the origin of granitic material, it does not include the processes by which granites crystallize.
3
assumptions are widely accepted, incremental assembly of magma systems and the associated temperature oscillations likely have profound effects on igneous textures.
More recent advancements in experimental and field petrology challenge many of the assertions of earlier work, including the assumption that magmas crystallize from large masses of melt (Lundstrom, 2009). Textural experiments challenge early interpretations of igneous textures and indicate that euhedral crystals precipitating from a solution may not be the first to nucleate (Means and Park, 1994). A study by Ackerson et al. (2018) using Ti-in-quartz thermobarometry concludes that quartz, a late-stage mineral along with K-feldspar (Johnson and Glazner, 2010), crystallizes at much lower temperatures (474˚ to 561 °C) than previously estimated, at least 100 °C below the nominal solidus, consistent with the prediction made by Lundstrom (2016). Similarly, volcanic equivalents to granitic plutons show evidence for cold storage below 650˚ to 700 °C for a majority of the time before eruption (e.g., Cooper and Kent, 2014; Anderson et al., 2017; Rubin et al., 2017; Karakas et al., 2019). It has been shown that these magmas typically only have a short period during which it can erupt (Barboni and Schoene, 2014).
Heat from new intrusions during incremental assembly results in greenschist- to
amphibolite-facies conditions in the pluton persisting for millions of years (Coleman et al., 2004; 2017; Glazner et al., 2004). Challener and Glazner (2017) show that "igneous" amphiboles in the Half Dome Granodiorite of the Tuolumne Intrusive Suite preserve mineral assemblages and compositions consistent with growth under greenschist facies conditions. In some portions of granodiorite, up to 20% of biotite has been replaced by chlorite (Johnson and Glazner, 2010).
4
Ostwald ripening (e.g., Higgins, 1999; Gualda 2019), dissolution-reprecipitation requires the loss of material from smaller to larger crystals during thermal cycling. As a melt replenishment causes an increase in temperature, crystal rims and small crystals can be remelted; as the temperature decreases, the dissolved K-feldspar components recrystallize on crystals with the lowest surface energy per unit volume (i.e., the largest nearby crystal; Mills et al., 2011; Wickland, 2016), thereby increasing average crystal size and decreasing the overall number of nuclei. Despite evidence for K-feldspar megacrysts having grown in a relatively cool, crystalline system in part via dissolution-reprecipitation processes, some authors still favor the scenario in which K-feldspar nucleates early in a melt-dominated system and crystallizes with melt present (e.g., Vernon and Paterson, 2008; Gualda, 2019).
K-Feldspar Megacrysts in Granitoids
K-feldspar megacrysts are arbitrarily defined as alkali feldspar crystals >5 cm in the longest dimension (Johnson and Glazner, 2010; Glazner and Johnson, 2013). Common characteristics include Carlsbad twins and well-defined mineral inclusion and Ba zones (e.g., Vernon, 1986; Johnson and Glazner, 2010; Glazner and Johnson, 2013), as (BaAl)5+ substitutes for (KSi)5+ via coupled substitution in K-feldspar. Mineral inclusions typically include
plagioclase, quartz, biotite, titanite, hornblende, apatite, Fe-oxide, and zircon (Moore and Sisson, 2008; Vernon and Paterson, 2008; Glazner and Johnson, 2013). Some studies (i.e., Moore and Sisson, 2008) suggest that minerals inclusions are the results of melt replenishments churning melt and crystals, allowing smaller minerals to stick to the surface of the crystallizing
5 xenoliths, and irregular accumulations of
megacrysts (Paterson et al., 2005; Vernon and Paterson, 2008).
The large size of K-feldspar megacrysts in conjunction with their ability to record complex processes in igneous environments (Ginibre et al., 2004) and physicochemical changes in the magma (Müller et al., 2005) as features such as zoning and microstructures render them useful for understanding pluton formation during their prolonged period of growth (e.g., Cox et al., 1996, Gagnevin et al., 2005; Słaby et al., 2011; Munnikhuis, 2016). Thus, characterizing zoning
patterns and other microstructures within megacrysts will provide a more thorough
understanding of their formation history, in either a magma- or crystal-dominated system.
End-Member Hypotheses
Hypotheses for the origin of K-feldspar megacrysts can be summarized with two end-members, allowing that their true origin may lie somewhere between. One end-member follows the interpretation of igneous textures in which K-feldspar megacryst nucleation and
crystallization occurs at high temperatures when melt is plentiful. Successive melt
replenishments intrude a partially crystallized mush, loft crystals, and can produce magma
6
currents until the crystals settle, and the cycle repeats (Moore and Sisson, 2008). This hypothesis assumes the entirety of the K-feldspar megacryst growth to occur in a system where melt is present. One variation of this hypothesis owes the low number of K-feldspar crystals to low rates of nucleation and nucleation difficulties (Vernon, 1986). In this scenario, the new and old melts are homogenized while the injection of warm melt replenishments churn, mix, and heat the system (Fig. 2, Hypothesis 1).
In light of recent studies (Coleman et al., 2004; Mills et al., 2011; Mills and Glazner, 2013; Challener and Glazner, 2017), a second end-member hypothesis for megacryst formation has been proposed (Johnson and Glazner, 2010). Following the phase equilibria summarized in Johnson and Glazner (2010, references therein), the start of K-feldspar nucleation occurs near the rheological threshold at 50% crystallinity (Vigneresse and Tikoff, 1999). Consecutive melt replenishments are hypothesized to flow through a static crystal matrix formed by K-feldspar and earlier minerals, forming heterogeneous but interconnected zones of melt with varying
proportions of new and old melts that are unable to directly communicate with one another geochemically across large distances (Fig. 2, Hypothesis 2). Johnson and Glazner (2010, references therein) attribute the large size and the low number of K-feldspar megacrysts to textural coarsening (Higgins, 1999) via dissolution-reprecipitation processes induced by
7
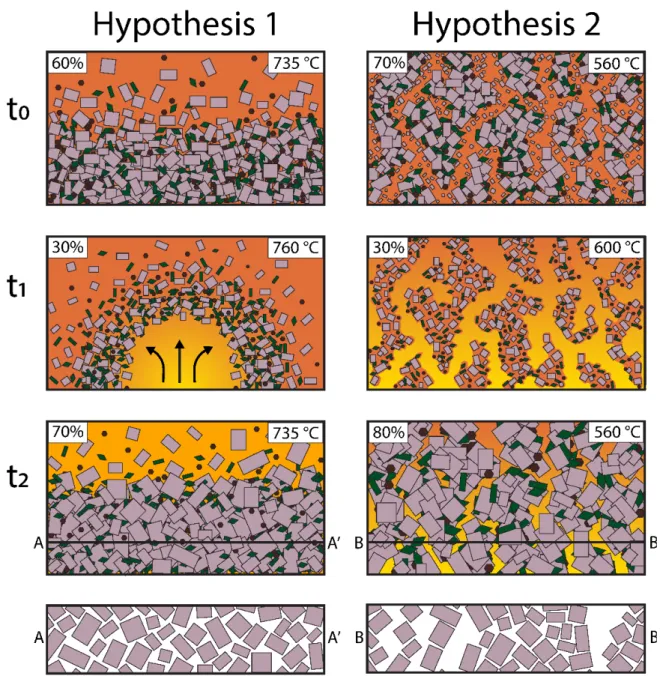
Figure 2. Schematic showing the magma chamber during both hypotheses. Percentages in top left indicate crystallinity; temperatures in top right indicate temperature of the system. t0) Hypothesis 1: Magma chamber
with cumulate texture due to prior crystal settling (Paterson et al. 2005); Hypothesis 2: Static crystal matrix with channelized magma flow (Higgins 1999). t1) A new melt is injected into the system, increasing the
temperature. In Hypothesis 1, the crystals are lofted into the chamber and partially dissolved, and the system churns and mixes, creating a new chemically homogeneous melt. In Hypothesis 2, the new melt flows through the channels surrounding the crystal matrix while simultaneously increasing porosity of the matrix and melting the rims of the previously crystallized minerals. t2) The system cools again, awaiting another
melt replenishment. In Hypothesis 1, the crystals settle to form another cumulate and have formed a rim of similar geochemistry as they interacted with the geochemically homogeneous melt. In Hypothesis 2, the crystals coarsen to maintain the static crystal matrix, each with a geochemically unique and likely asymmetric rim. Transects indicate the pattern we expect to see in a glacially eroded horizontal section of rock.
Temperatures for Hypothesis 1 from Zr-in-titanite temperatures determined by Moore and Sisson (2008). Temperatures for Hypothesis 2 at t0 and t2 taken from Ackerson et al. (2018) and at t1 taken from Carmichael
8
Phase Equilibria
In the end-member hypotheses for the origin of K-feldspar megacrysts, the crystallization sequence of the typical granite and granodiorite mineral assemblages has direct implications for the inferred origin of the megacrysts. Phase equilibria determined from experiments of natural granitic rocks indicate that K-feldspar nucleation in melt occurs relatively late in the
crystallization sequence (Piwinskii, 1968; Piwinskii and Wylie, 1968; Piwinskii, 1973; Whitney, 1988) when crystallinity is ~65 to 70 vol% (Johnson and Glazner, 2010; references therein). This is consistent with experiments conducted by Kaczor et al. (1988), who found that partial melting of a natural granite results in a glass produced dominantly by the melting of K-feldspar and quartz. K-feldspar nucleation occurs after the initial nucleation of plagioclase, followed by quartz, all three of which grow together to the solidus (Long and Luth, 1986). Both natural and experimental examples of dacitic lavas typically contain less than 50% phenocrysts (e.g., Smith and Leeman, 1987; Singer et al., 1995; Vigneresse and Tikoff, 1999; Bachmann et al., 2002; Costa and Singer, 2002; Costa et al., 2004; Crabtree and Lange, 2010), few of which are K-feldspar, and lavas with >55% phenocrysts are scarce (Marsh 1981). For example, the Fish Canyon Tuff, Colorado, contains a small volume of K-feldspar phenocrysts (Bachmann et al., 2002), but the normative mode predicts significantly more orthoclase, which was likely dissolved in the melt prior to eruption (Johnson and Glazner, 2010). Whereas naturally occurring
9
Dissolution-Reprecipitation
A variety of studies owe crystal coarsening to temperature oscillations caused by consecutive melt replenishments (e.g., Waight et al., 2000; Gagnevin et al., 2008; Simakin and Bindeman, 2008; Johnson and Glazner, 2010; Mills et al., 2011; Glazner and Johnson, 2013; Mills and Glazner, 2013; Munnikhuis, 2016). Phase equilibria of K-feldspar in conjunction with the rheological lock-up threshold (Vigneresse and Tikoff, 1999) and particle locking threshold (Vigneresse et al., 1996) imply that megacrysts coarsen in a system where crystals are relatively immobile in the melt. A variety of textural characteristics of K-feldspar megacrysts and local surrounding groundmass indicate that dissolution-reprecipitation (Fig. 3) contributed greatly to crystal coarsening:
1) The modal abundance of mafic minerals is higher near the megacrysts than in distal non-megacrystic granodiorite due to the lack of groundmass K-feldspar phenocrysts (Higgins, 1999), presumably a result of mass transfer from smaller, neighboring K-feldspar crystals to megacrysts.
2) A crystal size distribution (CSD) study by Higgins (1999) produced a hump-shaped CSD, which is indicative of crystal coarsening. Metamorphic rocks, as well as intrusive and extrusive rocks, can have such CSDs (Higgins, 1998). In a late-stage plutonic scenario, channelized flow through megacrystic matrices promotes crystal coarsening and results in the observed hump-shaped CSD (Higgins, 1999).
10
4) Higgins (1999) describes rough rims of the K-feldspar megacrysts and groundmass phenocrysts with “sinuous extensions” of K-feldspar extending out of the crystal into the granodiorite host rock. These features are also noted by Johnson and Glazner (2010). These are igneous textures but may be a result of metamorphic processes reflecting mass transfer during coarsening.
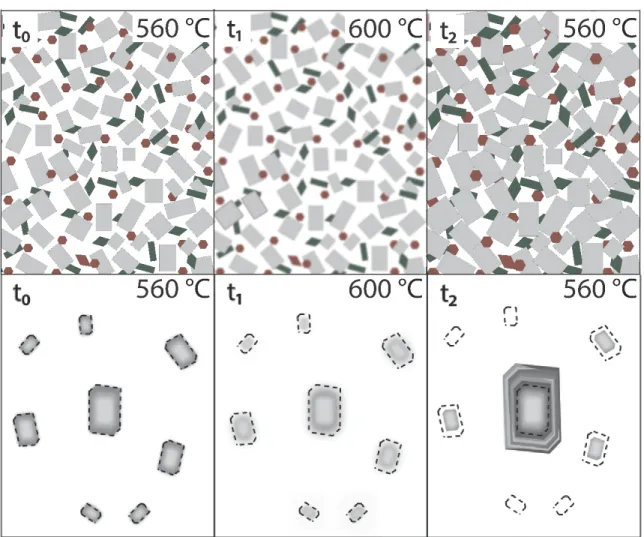
Figure 3. Dissolution-reprecipitation schematic during one temperature oscillation. Top represents the static crystal matrix; bottom represents K-feldspar coarsening. Dashed lines represent original rims of crystals at t0.
t0) Top: A static crystal matrix with ~50% crystallinity. Bottom: A zoned K-feldspar megacryst surrounded by
smaller crystals of variable Ba content. t1) The temperature increases due to a melt replenishment and dissolves
the rims of the megacryst, the larger surrounding crystals, and the static crystal matrix (crystallinity <50%) and entirely dissolves the smallest crystals. t2) Top: Coarsening of the static crystal matric with crystallinity >50%.
11
Testing the Hypotheses
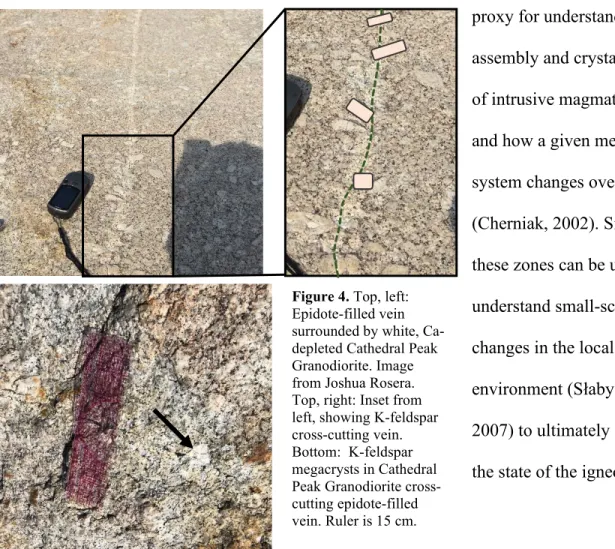
Concentric crystal zonation in igneous minerals reflects chemical changes in the melt from which the mineral is crystallizing, making zoned minerals useful for understanding larger-scale processes, such as melt evolution. Feldspars themselves are a reliable recorder of local thermodynamic (Müller et al., 2005) and geochemical (Bindeman and Bailey, 1999) changes in the melt. Barium is relatively compatible and diffuses slowly in the K-feldspar crystal lattice (Cherniak, 2002). As such, K-feldspar megacrysts commonly retain prominent primary Ba-rich zones. Thus, changes in the chemistry of the magma, such as the replenishment of melt, should be sensitively recorded by Ba zones and retained throughout the rest of the rock’s thermal history. Barium zoning in K-feldspar megacrysts can, therefore, serve as a useful and robust
proxy for understanding assembly and crystallization of intrusive magmatic rocks and how a given melt-crystal system changes over time (Cherniak, 2002). Similarly, these zones can be used to understand small-scale changes in the local melt environment (Słaby et al., 2007) to ultimately determine the state of the igneous system
12 throughout K-feldspar crystallization.
Zoning in K-feldspar brings to light an issue of scale; crystals record local stimuli, and thus can only reveal information about the local environment in which they formed. From the records of individual megacrysts, a better understanding of the history of the local magma chamber during crystallization can be established (Gagnevin et al., 2005). This provides a view of magmatic processes that large-scale geochemical and petrographic whole-rock studies cannot resolve (Słaby et al., 2011). To test the end-member hypotheses for the origin of K-feldspar megacrysts, Ba zones of megacrysts were analyzed for physical patterns in multiple individual crystals from three populations of megacrysts from the Cretaceous Tuolumne Intrusive Suite in California.
GEOLOGIC SETTING
Tuolumne Intrusive Suite
13
2019). Together, field, petrographic, isotopic, and geochronologic data suggest that the suite was assembled in an open system as individual and successive intrusions of melt (e.g., Coleman et al., 2004; 2012; Glazner et al., 2004; Gray et al., 2008; Johnson and Glazner, 2010; Glazner and Johnson, 2013; Munnikhuis, 2016).
Figure 5. Map of Tuolumne Intrusive Suite, Yosemite National Park, after Bateman (1992) and Coleman et al. (2004). Red, green, and blue stars indicate samples locations for sample groups LP, TP, and PHD,
14
The contact between the equigranular facies of the Half Dome Granodiorite and the Cathedral Peak Granodiorite is an excellent example of a gradational petrographic boundary between map units in the Tuolumne Intrusive Suite (Bateman, 1992; Johnson and Glazner, 2010). Large (up to 3 cm), euhedral hornblende phenocrysts are characteristic of equigranular Half Dome Granodiorite. In this map unit, K-feldspar occurs as equigranular crystals with the surrounding major minerals (plagioclase, quartz, biotite, and hornblende). K-feldspar in the Half Dome Granodiorite becomes porphyritic close to the Cathedral Peak Granodiorite unit boundary, and hornblende becomes less prominent. The mapped contact with the Cathedral Peak
Granodiorite is defined where K-feldspar becomes megacrystic (Bateman, 1992).
Recent studies (Bachmann and Bergantz, 2008; references therein) conclude that magma chambers fluctuate in temperature and crystallinity as a result of influxes of material (i.e., in an open system). There is abundant agreement that the Tuolumne Intrusive Suite was emplaced and crystallized as an open system (Kistler et al., 1986; Higgins, 1999; Gray et al., 2008; Moore and Sisson, 2008; Munnikhuis, 2016). At the pluton scale, Tuolumne Intrusive Suite units are approximately the same geochemically (Bateman, 1992). Isotopic data from Munnikhuis (2016) indicate that there was no magma mixing at the pluton scale, consistent with geochronology (Coleman et al., 2004) and volume considerations (Burgess and Miller, 2008). Very slight
15
K-Feldspar Megacrysts in Tuolumne
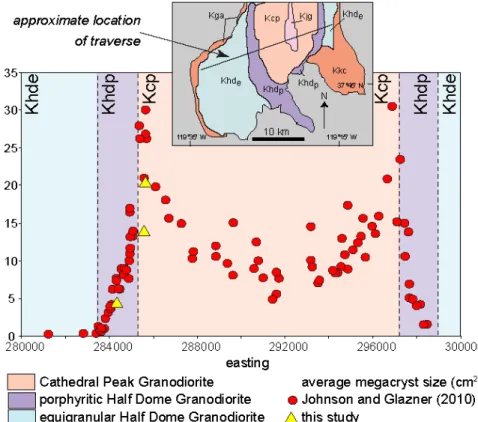
K-feldspar megacrysts and phenocrysts (hereafter referred to as megacrysts) are best viewed in glacially eroded slabs, where megacryst structures are most prominent. Such structures occur as mosaics varying in megacryst concentration, geometry, and CSDs. Johnson and Glazner (2010) found that across a transect intersecting the Cathedral Peak Granodiorite and Half Dome Granodiorite boundaries on either side of the zoned intrusive suite, whole-rock K2O (wt%) and K-feldspar mode show no spatial trend, whereas the average megacryst size (cm2) varies in a predictable pattern. The Half Dome Granodiorite K-feldspar occurs as small, anhedral crystals (~few cm2). A sharp increase in crystal size takes place at the boundary between the equigranular and porphyritic Half Dome Granodiorite, and the largest crystal size (~30 cm2) occurs just inside the mapped contact between the porphyritic Half Dome and Cathedral Peak granodiorites. The crystal size then slowly decreases to a minimum (~5 cm2) in approximately the center of the Cathedral Peak Granodiorite, and the pattern is mirrored on the opposite side of the suite (Johnson and Glazner 2010). Chambers et al. (2018) attribute the observed distribution of megacrysts to mixing of and communication between the Half Dome and Cathedral Peak melts, requiring a relatively mobile system. Many mosaics are locally concentrated as small clusters or linear features extending multiple meters. Whole, euhedral megacrysts can be found loose on the glacial slabs and are thought to occur due to biotite rinds facilitating weathering out of whole crystals from the granodiorite groundmass (Glazner and Johnson, 2013).
16
~50 to 500 μm in width (Johnson and Glazner, 2010). The concentration of BaO also tends to
decrease toward the rim of individual megacrysts (Glazner and Johnson, 2013). All K-feldspar crystals in the Tuolumne Intrusive Suite are quite potassic (Or85-95), more so than volcanic rocks of equivalent composition (Glazner and Johnson, 2013; Carmichael et al., 1974). The diffusion rate of Ca in K-feldspar is incredibly low (Cherniak, 2002), essentially rendering it immobile. This low Ca content, therefore, cannot be due to Ca diffusing out of the crystal lattice, but due to recrystallization in a solid system at ~400 °C where Ca is generally immobile (Glazner and Johnson, 2013).
An isotopic study conducted by Munnikhuis (2016) concluded that initial isotopic compositions (87Sr/86Sr and 207Pb/206Pb) remain relatively constant across a megacryst transect. Within a single megacryst, the range of initial 87Sr/86Sr is far more restricted than any of the Tuolumne map units and falls within the range of the Cathedral Peak and porphyritic Half Dome granodiorites and just higher than that the equigranular Half Dome Granodiorite (Munnikhuis, 2016). In both the equigranular and porphyritic portions of the Half Dome Granodiorite, K-feldspar increases in BaO (wt%) as the modal percentages of K-K-feldspar decreases. In the Cathedral Peak Granodiorite, groundmass feldspar is relatively Ba-depleted, whereas the K-feldspar megacryst population forms a normal distribution centered about 0.75 to 1.0 wt% BaO (Glazner and Johnson, 2013).
17
individual melt zones (Higgins, 1999). Thus, an unaltered mechanical pile-up of megacrysts in the melt would result in a porosity much higher than observed in the field and instead may be a result of channelized melt flow and coarsening. Furthermore, independent rotation of crystals and thus their ability to form fabrics becomes disabled once the crystal volume is greater than 20% (Vigneresse et al., 1996). Once the rigid percolation threshold (55% crystallinity,
Vigneresse et al., 1996) or rheological lock up threshold (50% crystallinity; Vigneresse and Tikoff, 1999) is reached, the system can no longer form crystal fabrics. K-feldspar crystallization corresponding with these thresholds implies that magma flow likely cannot form such structures (Glazner and Johnson, 2013).
Recent studies attempting to determine growth rates for K-feldspar megacrysts in the Tuolumne were conducted by Chambers et al. (2018) and Memeti et al. (2019). Whole-crystal geochronology via isotope dilution thermal ionization mass spectrometry on core and rim zircon inclusions indicate an age offset (and thus growth rate) from the core to the rim of about 0.5 Ma (Memeti et al., 2019) with ages younging toward the rim. These growth rates are slower than those suggested by Barboni and Schoene (24-26 Ka; 2014) for megacrysts in Elba, Italy.
METHODS
Three sets of whole, euhedral megacrysts that weathered out of the host granodiorite were collected from separate outcrops in the Tuolumne Intrusive Suite (Fig. 5, Table 1). To ensure that the sampling bias introduced by collecting loose megacrysts is limited, the area of the plane parallel to (100) for each megacryst was calculated and averaged for each megacryst population. These area averages were compared to the average maximum surface area of megacrysts
18
Samples were cut in half through the center, parallel to the orthoclase (100) plane, and scanned with a Nikon XTH 225 ST micro X-ray computed tomography scanner (micro CT; Ketcham and Carlson, 2001). One half of each crystal was scanned at slightly different angles during 2,068 small rotations on average. Each rotation produced four, two-dimensional images, which were averaged to
create a single slice (Fig. 7a). Slices were stacked in ImageJ and
reconstructed in Avizo to create three-dimensional models of the crystal halves (Fig. 7) for analysis of the internal anatomy. The effective pixel size of each scan and three-dimensional reconstruction is ~20 μm.
Table 1. Sample groups from Tuolumne Intrusive Suite.
Sample
Prefix TIS Geological Unit Number of Samples (Latitude, Longitude) Sample Location
Sample Size Range (Area,
cm2)
LP Cathedral Peak Granodiorite 10 37.860, -119.440 12.2-30.8
TP Cathedral Peak Granodiorite 6 37.855, -119.439 11.2-17.9
PHD Porphyritic Half Dome Granodiorite 6 37.839, -119.451 3.0-5.4
19
Due to the relatively low resolution of the scans and the amount of noise caused by mineral inclusions, direct image analysis was inconclusive and necessitated a different mode of analysis. To compare the interiors of megacrysts, centered planes parallel to (100) obtained from the micro CT (Fig. 8a) scans were mapped and internally referenced using the following method. Zone boundaries distinguishable by density differences (i.e., grayscale differences) were outlined using solid lines; zone boundaries obscured by noise and mineral inclusions were inferred and mapped using dashed lines (Fig. 8b). In some cases, obscured
chemical zones were differentiated using mineral inclusions occurring in the zone. Finally, the zones were colored according to their density; warmer colors indicate more dense zones (Ba-rich component), whereas cooler colors indicate less dense zones (Ba-poor component; Fig. 8c, Fig. 9). The maps were then compared using multiple modes of quantitative analysis.
Opposite (mirroring) core-to-rim transect pairs (Fig. 9) were used in both methods of analysis, yielding 44 transects for all 22 samples. The first method of analysis compared zoning patterns among megacrysts in the same population. The transects were length-normalized and
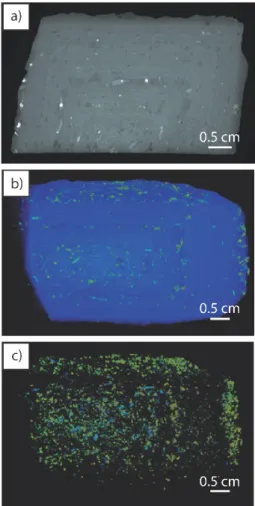
Figure 7. a) Micro CT slice of sample LP-4, looking down b-c orthoclase plane. b) Three-dimensional reconstruction of LP-4 scan. Cut face parallel to b-c orthoclase plane. Blue colors indicate K-feldspar groundmass and low-density minerals (i.e., plagioclase and quartz), warmers colors indicate higher density mineral inclusions (i.e., biotite, hornblende, titanite, and Ti-oxides). c) Reconstruction from (b) with blue groundmass removed.
20
divided into 100 equidistant points. The color of each point was recorded and translated into a numerical dataset for which purple (low density) equals 0 and red (high density) equals 5.
The second test utilized a modified skeleton plot method, similar to that used by dendrochronologists to date trees and understand local stimuli using tree rings (Phipps, 1985). For each transect, the thickness and color (i.e., density) of each zone were measured and plotted as a bar plot (Fig. 10, 11, 12), which are compared to one another to identify similar zone patterns. Skeleton plot pairs for each sample were also translated into numerical datasets where each zone was given a number based on color (blank = 0, purple = 1, red = 6).
Thin sections of oriented, centered, and quartered cut faces were produced from sample group LP. Mineralogy and inclusion modes were determined using an Olympus BH-2
petrographic microscope.
21
22
RESULTS
Micro CT can distinguish materials by density (Cnudde et al., 2006), represented by differences in grayscale value, making it a useful tool for petrologists and a non-destructive imaging method. Micro CT can resolve density differences between mineral inclusions as well as
23
Ba-poor K-feldspar (down to 2.56 g/cm3) and Ba-rich K-feldspar (up to 3.32 g/cm3), making grayscale value a reliable proxy for Ba content of K-feldspar. The three-dimensional megacryst reconstructions reveal concentric chemical zones interpreted to be variations in Ba
concentrations (Fig. 7, 8a).
Figure 11. Normalized skeleton plot pairs of transects from the same megacryst. The origin represents the core; the y axis represents the thickness of the zone in mm; each color
24
Map Correlations
R2 values for correlations between randomly paired transects from different megacrysts and transects from the same megacryst are presented in Figure 13 for each sample group. The median R2 values of randomly paired megacrysts from sample groups LP and TP are lower than those of pairs from the same megacryst. The median R2 value for randomly paired transects from sample group PHD is somewhat higher than that of pairs from the same megacryst, but the
25
overall range of the data is similar. Most R2 values for all groups, either randomly paired or from the same megacryst, are lower than 0.4, except for one random pair in the PHD group (0.47).
Skeleton Plot Correlations
The original (Fig. 10) and length-normalized (Fig. 11) skeleton plots do not account for periods of paused growth, regardless of the crystallization rate. They differ in that, assuming similar crystallization rates on either side of the megacryst, the original version assumes either side may cease crystallization at times independent from one another, whereas the length-normalized version assumes both crystal faces stop crystallizing at the same time. The original skeleton plots were altered such that portions of transects from the same megacryst with similar zone patterns were matched up while maintaining zone order (Fig. 12). This results in some unpaired zones. This last version of the skeleton plots considers that one side of a megacryst may crystallize at different rates than the other and accounts for pauses in crystallization. A pause in growth may represent either no net gain on the crystallizing interface or dissolution of the outermost zones.
Figure 13. Boxplots for R2 values for randomly paired transects (from difference megacrysts) and
26
Most skeleton plots, including transects from the same megacrysts, are unique (Fig. 14), with variable density patterns and zone counts. Opposite transects are also sometimes different widths, indicating zone offsets. Visually, the skeleton plots are most similar in the core. Portions of zones in the rim are more similar than others, but the highest correlation of zones occurs in the core. To quantify how the zone patterns vary from core to rim, R2 values for representative megacrysts from each sample group for varying fractions of the megacrysts were calculated, enabling a discernable transition from the core (similar zone patterns) to the rim (divergence in pattern similarity; Fig. 15). The R2 transect from the core to the rim starts at 1, and steeply dips to a minimum, after which multiple peaks occur throughout the overall decreasing trend indicating variable zone pattern correlations in the rim.
The differences in grayscale value (i.e., relative density) in individual zones in representative megacrysts from each sample group were analyzed. For each megacryst, three
Figure 14. Boxplots for R2 values for original, length-normalized, and
27
zones were sampled at the same proportional distance from the core. Around each zone, eight grayscale values were recorded and plotted versus spot number (Fig. 16).
Variations in density in an individual zone indicate asymmetric zones about a crystal’s center.
Microstructures and Inclusions
There are a variety of
microstructures within the K-feldspar internal anatomy (Fig. 17). Perhaps the most eye-catching are the mineral inclusions that tend to form roughly concentric zones around and are concentrated in the core of the megacrysts (Chambers et al., 2018). Thin sections of Cathedral Peak Granodiorite megacrysts (LP) were used to more closely examine mineral inclusions (Table 2). Quartz and plagioclase are expected to occur as inclusions if Long and Luth’s (1986) prediction regarding coeval crystallization of plagioclase, quartz, and K-feldspar is correct; indeed, quartz and plagioclase are by far the most abundant mineral inclusions. They occur as subhedral plagioclase and quartz grains along with
Figure 15. R2 values as a function of distance from the core for
28
interstitial quartz occurring in small fractures. Subhedral to euhedral titanite and oxides occur regularly throughout the samples, typically more so than hornblende and biotite, which tend to be subhedral. Allanite, apatite, and zircon are common accessory minerals, and in one case, K-feldspar inclusions occur within the K-K-feldspar megacryst.
The internal zoning of the megacrysts exhibits a variety of patterns and features. The K-feldspar contains both oscillatory and sawtooth Ba zones (Fig. 17). Dissolution features are common and typically occur as small, localized disruptions in chemical zones (Fig. 17). Carlsbad twins are common but not universal (Table 2), and many of the twin planes are curved, perhaps due to recrystallization processes. The Ba content is not consistent around a single concentric
29
zone measured proportionally from the center of the crystal (Fig. 16). This feature is termed “chemical interfingering.”
DISCUSSION
Inter- and Intracrystalline Zone Patterns
The altered skeleton plot format (Fig. 12, 14) is likely the best representation of
individual zone crystallization because the correlations between transects for two out of the three sample groups are higher, with the third relatively unchanged. This format also accounts for either side of the megacryst crystallizing both dependently and independently (i.e., only partial communication between melt on either side of the crystal). Despite this, the opposite faces crystallize very different zone patterns. Some portions of the zone transects contain patterns that are observable from the unmapped scans (Fig. 18). This asymmetry has two broad implications:
Figure 17. Microstructures observed in megacryst reconstructions. a) Sample LP9 with dissolution features (arrows) and oscillatory zoning (box). b) Sample TP14 with dissolution features (arrows) and sawtooth zoning. c) Sample LP6 with dissolution features (arrow) and interfingering zones (box). d) Sample TP13 with
dissolution features (arrows) and oscillatory zoning (boxes). e) Sample LP7 with sawtooth zoning (arrows). f) Sample LP8 with dissolution features (arrow) and interfingering zones (box). g) Sample LP10 with
30
1) communication between melt regions 10-100 m3 in volume is minimal, and 2) dissolution- reprecipitation contributes to the asymmetry of mirrored transects. In a system with ample room for consecutive melt replenishments to mix, mingle, and homogenize, megacrysts crystallizing from the same large magma chamber should have relatively similar zoning patterns across entire transects. Despite the highest correlations in the core (Fig. 15), the relatively low R2 values of all pairs of map transects and the altered skeleton plots indicate that crystallization in the static matrix prevents significant communication between the melts from which individual megacrysts form.
Table 2. Thin section analysis of mineral inclusions (sample group LP).
Sample
Number Inclusions Percent Relative Inclusion Mineral Proportions Notes
LP1 3% hornblende > apatite (accessories: allanite, zircon) quartz > plagioclase > titanite > oxides > biotite > Carlsbad twinning, perthitic
LP2 5% quartz > oxides > plagioclase > titanite > hornblende > biotite (accessories: apatite, zircon) Carlsbad twinning, perthitic
LP3 5% quartz > plagioclase > titanite > hornblende > biotite > oxides (accessory: apatite) Carlsbad twinning, perthitic
LP4 5% plagioclase > quartz > oxides > titanite > hornblende > K-feldspar > biotite > apatite (accessories:
allanite, zircon) Perthitic
LP5 1% quartz > plagioclase > oxides > titanite > hornblende > biotite (accessory: apatite) Perthitic, myrmekite texture
LP6 3% quartz = plagioclase > oxides > titanite > hornblende > biotite (accessory: zircon) Carlsbad twinning, perthitic
LP7 4% quartz = plagioclase > oxides = hornblende > titanite (accessory: apatite, biotite, zircon) Carlsbad twinning, perthitic
LP8 5% quartz > plagioclase > hornblende > titanite = oxide > biotite (accessories: allanite, apatite, zircon) Carlsbad twinning, perthitic
LP9 5% plagioclase > quartz > hornblende > oxides > titanite (accessories: allanite, apatite, zircon) Carlsbad twinning, perthitic
31 This transition from similar core
zones to dissimilar rims zones indicates that the static crystal matrix is continually growing in conjunction with the
megacrysts. Individual melt zones providing K-feldspar components to the crystallizing megacrysts may be blocked by portions of the matrix connecting to faces of the megacrysts (particle locking threshold; Vigneresse et al., 1996), forming multiple subzones that can no
longer communicate with one another while still contributing to the crystallization of the same megacryst. As these subzones develop, the skeleton plot patterns should stray further and further from one another as the system continues to crystallize. This period of transition from clear core zones to individual outer zones is somewhat coeval with the transition of the megacryst from igneous to metamorphic. One caveat is that a magma influx may melt part of the static crystal matrix, allowing for partial remixing and rehomogenization of the melt zones. This is observed in the small peaks in R2 values in the rim.
A geochemical study conducted by Long and Luth (1979) in northern New Mexico found correlations of Ba concentrations as a function of distance from the core between megacrysts from the same hand specimen (Long and Luth, 1986). Such samples likely experienced the same or similar melt, with relatively high melt connectivity in the matrix, which would result in very similar BaO concentration patterns in zoning. Long and Luth’s (1986) study differs from this
Figure 18. Transects from reconstruction of micro CT data of sample PHD4 showing similar but asymmetric zone patterns mirrored about the core. Arrow indicates a
32
study in that this study takes place on a scale one to two magnitudes larger, where local melt communication is much less likely. On the scale of the Long and Luth (1979) study (tens to hundreds of cm3), the interconnected melt may be able to communicate locally as later melt replenishments dissolve the static crystal matrix and allow better, but limited, melt connectivity.
There are multiple transects with either oscillatory or sawtooth zones (Fig. 17a,b,d,e). Glazner and Johnson (2013) note that oscillatory zoning of Ba in K-feldspar megacrysts
indicates that successive temperature changes, as well as influxes of water-rich fluids, may have affected the megacrysts. The presence of these fluids is likely a late-stage event in a mostly or entirely solid system. Anhedral interstitial quartz filling in fractures within the megacrysts provides additional evidence for the presence of such fluids. Additionally, the model produced by Munnikhuis (2016) suggests that sawtooth zoning is attainable via multiple melt recharges. Overall, these melt additions change the thermodynamic parameters of the system, which in turn changes the crystallization rate, availability of chemical components, and, therefore, zone details of the megacrysts (Long and Luth, 1986).
Local Heterogeneities
A significant contributor to the asymmetry of Ba zones of transects from the same megacrysts is a function of late-stage dissolution-reprecipitation, where the static crystal matrix prevents communication between divided melt zones contributing componentsto opposite sides of a crystallizing megacryst. Similarly, a new melt likely flows anisotropically through the static crystal matrix, creating geochemically heterogeneous melt zones.
33
one full half of a megacryst may result in an asymmetric, partially recrystallized, unidentifiable core. Alternatively, a large, symmetric core indicates that the crystal either experienced little coarsening, perhaps due to a lack of smaller surrounding crystals, crystallization in a relatively secluded melt zone, or enough dissolution to result in the loss of a significant portion of the rim without subsequent recrystallization.
A key requirement for the formation of uncorrelated Ba zones in K-feldspar megacrysts is melt heterogeneities at the meter scale and smaller. Local heterogeneities small enough to affect individual zones of K-feldspar megacrysts may be a result of local contaminants (e.g., wall rock assimilation), dissolution of other phases in the melt, local phase changes such as exsolution of gas (Bachmann and Bergantz, 2008), crystallization of plagioclase and quartz with K-feldspar (Long and Luth, 1986), and melt zone migration (Karakas et al., 2019). At such a small scale in the static crystal matrix, it is unlikely that multiple sources of chemical heterogeneity would result in a homogeneous magma, particularly given the high viscosity of silicic magmas (e.g., Clemens et al., 2009). There is additional field evidence supporting local melt heterogeneity, namely the presence of mafic enclaves in the granodiorite (Słaby et al., 2008). Słaby et al. (2008) also found evidence for geochemical variability on the order of 500 μm or less in a crystallizing magma, which is approximately the scale at which zone heterogeneities are expected in a single megacryst coarsening in a static system.
Evidence for Dissolution-Reprecipitation
Dissolution marks are interpreted to indicate a rise in temperature when the effected zone was the outermost zone (Cox et al., 1996), likely due to a nearby magma replenishment.
34
chemistry (Cox et al., 1996; Moore and Sisson, 2008). The R2 values comparing transects from the same megacryst are all low, indicating uncorrelated pairs of zone transects and dissimilar skeleton plots.The relatively low R2 values (Fig. 13) for randomly paired transects as well as transects from the same megacryst are low and consistent with K-feldspar megacrysts
crystallizing in chemically heterogeneous melt pockets with minimal melt mixing.
Chemical interfingering is interpreted as having formed during dissolution-reprecipitation processes in a static crystal matrix. Interfingering of variable zones of variable Ba concentration at the same proportional distance from the core (Fig. 3, 16, 17c,f,g, 18) indicates that smaller crystals, possibly in isolated melt zones surrounding the same megacryst, dissolved and contributed chemical constituents to the nearest larger megacryst.
Random transect pairs with higher R2 values indicate that such crystal faces may have crystallized relatively close to one another (Vernon and Paterson, 2008) as they experienced melts with more similar chemistry, whereas distal megacrysts would have experienced relatively different melts. Additionally, asymmetry of mirroring zones from the same megacryst (Fig. 18) implies that rims were dissolved and recrystallized from melts of different chemistry, partially due to the dissolution of smaller individual K-feldspar crystals (Munnikhuis, 2016) and partially due to the creation of melt subzones.
Mineral Inclusions
35
in interface energy between the mafic minerals and the crystallizing K-feldspar faces (Higgins, 1999). Similarly, the interface energy between quartz and plagioclase must be relatively low given their ubiquity as mineral inclusions in the megacrysts, perhaps due to their similar positions in the crystallization sequence. This rejection of biotite as mineral inclusions is consistent with observations of biotite crusts that form on the outside of the megacrysts and assist in the weathering out of whole megacrysts from granodiorite (Johnson and Glazner, 2010; Glazner and Johnson, 2013).
Relatively continuous zones of inclusions with few biotite and hornblende crystals tend to be concentrated in the core of the megacrysts, surrounded by inclusion-poor rims (Chambers et al., 2018). Mineral inclusions are likely incorporated during cooling and represent the given minerals present in the melt zone during any given time with multiple inclusion zones
representing the movement of melt in the matrix, introducing new minerals to be included in the megacrysts. A lack of mineral inclusions in the rim may represent melt subzones losing
connection to one another.
The few oriented mineral inclusions in the rims are not necessarily indicative of crystals having formed in a melt. There are numerous examples of garnet porphyroblasts in metamorphic rocks that contain oriented mineral inclusions, many of which are quartz (e.g., Powell and Vernon, 1979; Bell, 1985; Hayward, 1992; Visser and Mancktelow, 1992; Spiess et al., 2001).
36
2019), then, support neither end-member hypothesis and do not necessarily accurately represent the relative age of the K-feldspar zone in which they are included. Complications regarding temperature cycling and its effects on zircons may also result ages that are younger than the actual crystallization of the zircon age.
The Static Crystal Matrix
Melt replenishments intruding into the crystallizing pluton can form channels through which successive intrusions can travel, resulting in K-feldspar megacryst concentrations along channel boundaries (Fig. 2). Depending on channel geometry, megacryst concentrations may be three-dimensional sheets or two-dimensional cylinders, with linear and point intersections along the glacially eroded slab, respectively (Higgins, 1999). These two-dimensional projections of such three-dimensional structures may resemble mechanical accumulations of megacrysts in a melt-rich system; however, the data indicate that such a cumulate is not possible due to the presence of a static crystal matrix. This rigidity caused by the static crystal matrix would prohibit large-scale mixing and communication of magma chambers, as suggested by some authors (e.g., Chambers et al., 2018). Mechanical accumulation of megacrysts is inferred to be a direct result of density differences between melt and crystals, so if the uplift of the Tuolumne Intrusive Suite was relatively vertical, “cumulates” should only observable on glacially eroded vertical and semi-vertical sections of granodiorite; instead many mosaics are observed on semi-horizontal eroded sections. Similarly, oriented crystals are not necessarily indicative of crystallization in an igneous system; oriented crystals can be produced via solid crystallization (i.e., metamorphic) processes as well.
37
reflection of increased exposure to temperature oscillations and thus increased dissolution-reprecipitation processes. In addition to coarsening from original injections of melt that formed both the equigranular and porphyritic Half Dome units, the injection of the Cathedral Peak melts would have also promoted coarsening in these previously emplaced units. The increased amount of time the unit boundary megacrysts experienced dissolution-reprecipitation in relation to other megacrysts in the units’ interiors is reflected in the size of the megacrysts as a function of distance from the boundary (Johnsons and Glazner, 2010).
Model for Megacryst Formation
Understanding the state of the system in which the K-feldspar megacrysts originated requires the answer to two separate but related questions: 1) In what type of system did they nucleate, and 2) how did they attain their size? Phase equilibria and igneous textures imply that K-feldspar megacrysts are, in part, igneous in origin (Glazner and Johnson, 2013), which is in agreement with the presence of identifiable cores in the skeleton plots. Nucleation of K-feldspar megacrysts occurs in a melt, and thus the cores qualify as igneous. A lack of K-feldspar crystals in chemically equivalent extrusive rocks (Higgins, 2011) indicates that nucleation takes place after the crystallinity of a magma causes it to cease, preventing eruption. This switch to rheological lockup at ~50% crystallinity (Vigneresse and Tikoff, 1999) and particle locking threshold at ~72 to 75% crystallinity (Vigneresse et al., 1996) induces a static crystal matrix, drastically reducing mobility of the system while altering and minimizing the number of pathways fresh, hot melt from a subsequent magma replenishment can follow.
In an open system with melt replenishments providing thermal oscillations, fully
38
systems, and these fluctuations likely promote solid-state coarsening. Late-stage coarsening occurs via diffusion in an igneous system via “meltamorphism” (Coleman et al., 2017) or in a metamorphic setting via aqueous fluid (Cashman and Ferry, 1988; Higgins, 1999). The conversion of Ba-rich biotite to chlorite may free up some Ba (Glazner and Johnson, 2013), which may contribute to the coarsening of the outermost zones in a mostly solid system and account for the Ba-depleted groundmass K-feldspar and relatively Ba-rich megacryst rims. Late-stage, partly and wholly solid-state coarsening qualifies these K-feldspar megacrysts as both igneous and metamorphic or metasomatic (Higgins, 1999), having nucleated in a melt and coarsened while the system cooled, both as a crystal mush and solid granodiorite.
39
chemical interfingering of zones, and individually variable zone patterns on opposite transects of the same megacryst with regions of varying correlation.
CONCLUSIONS
This study came to the following conclusions:
1) Barium zones in the K-feldspar megacrysts are resolvable down to ~20 μm in micro CT scans.
2) Maps of internal zoning are unique to individual megacrysts and imply that they
crystallized in individual melt zones with limited melt communication in a static crystal matrix that grew and decreased in melt connectivity as the system cooled.
3) Significant differences between zones on opposite sides of the same megacryst indicate that at some point, the static crystal matrix created subzones from which unique zoning patterns on opposite sides of the megacryst formed. Opposite transects from the same megacryst are not significantly correlated.
4) Skeleton plots reveal identifiable cores that nucleated and crystallized in an igneous environment, followed by a divergence in zone patterns that indicate dissolution of outer zones and a move toward growth via dissolution-reprecipitation in a partly or wholly solid system (i.e., the cores are igneous, and the rims are metaigneous to metamorphic). The megacrysts are, therefore, neither phenocrysts nor porphyroblasts, but metaigneous crystals.
Ultimately, this study shows that K-feldspar megacrysts have phenocrystic cores and coarsen both in a static crystal matrix and in a solid system via dissolution-reprecipitation induced by temperature oscillations introduced to the system by consecutive melt
40
ideas surrounding incremental growth (e.g., Coleman et al., 2004; Glazner et al., 2004), whereby mostly solid plutons form slowly via small melt influxes.
41
REFERENCES
Ackerson, M. R., Mysen, B. O., Tailby, N. D., and Watson, E. B., 2018, Low-temperature crystallization of granites and the implications for crustal magmatism: Nature, v. 559, no. 7712, p. 94-97.
Andersen, N. L., Jicha, B. R., Singer, B. S., and Hildreth, W., 2017, Incremental heating of Bishop Tuff sanidine reveals preeruptive radiogenic Ar and rapid remobilization from cold storage: Proceedings of the National Academy of Sciences, v. 114, no. 47, p. 12407-12412.
Bachmann, O., and Bergantz, G. W., 2008, Deciphering magma chamber dynamics from styles of compositional zoning in large silicic ash flow sheets: Reviews in Mineralogy and Geochemistry, v. 69, no. 1, p. 651-674.
Bachmann, O., Dungan, M. A., and Lipman, P. W., 2002, The Fish Canyon Magma Body, San Juan Volcanic Field, Colorado: Rejuvenation and Eruption of an Upper-Crustal
Batholith: Journal of Petrology, v. 43, no. 8, p. 1469-1503.
Barboni, M., and Schoene, B., 2014, Short eruption window revealed by absolute crystal growth rates in a granitic magma: Nature Geoscience, v. 7, no. 7, p. 524.
Bateman, P. C., 1992, Plutonism in the central part of the Sierra Nevada batholith, California, 2330-7102.
Bell, T. H., 1985, Deformation partitioning and porphyroblast rotation in metamorphic rocks: a radical reinterpretation: Journal of Metamorphic Geology, v. 3, no. 2, p. 109-118.
Bindeman, I. N., and Bailey, J. C., 1999, Trace elements in anorthite megacrysts from the Kurile Island Arc: a window to across-arc geochemical variations in magma compositions: Earth and Planetary Science Letters, v. 169, no. 3, p. 209-226.
Burgess, S., and Miller, J., 2008, Construction, solidification and internal differentiation of a large felsic arc pluton: Cathedral Peak granodiorite, Sierra Nevada Batholith: Geological Society, London, Special Publications, v. 304, no. 1, p. 203-233.
Cabane, H., Laporte, D., and Provost, A., 2005, An experimental study of Ostwald ripening of olivine and plagioclase in silicate melts: implications for the growth and size of crystals in magmas: Contributions to Mineralogy and Petrology, v. 150, no. 1, p. 37-53.
Carmichael, I. S. E., Turner, F. J., and Verhoogen, J., 1974, Igneous Petrology, New York, McGraw-Hill, 739 p.
42
Challener, S. C., and Glazner, A. F., 2017, Igneous or metamorphic? Hornblende phenocrysts as greenschist facies reaction cells in the Half Dome Granodiorite, California: American Mineralogist, v. 102, no. 2, p. 436-444.
Chambers, M., Memeti, V., Eddy, M. P., Schoene, B., and Paterson, S., 2018, Magma Mush Bodies and Crystal Recycling Constrained by Zircon Dates from Cores and Rims of K-Feldspar Megacrysts from the Tuolumne Intrusive Complex, Geological Society of America Annual Meeting: Indianapolis.
Cherniak, D., 2002, Ba diffusion in feldspar: Geochimica et Cosmochimica Acta, v. 66, no. 9, p. 1641-1650.
Clavero, J. E., Sparks, R. S. J., Pringle, M. S., Polanco, E., and Gardeweg, M. C., 2004, Evolution and volcanic hazards of Taapaca Volcanic Complex, Central Andes of Northern Chile: Journal of the Geological Society, v. 161, no. 4, p. 603-618.
Clemens, J., Helps, P., and Stevens, G., 2009, Chemical structure in granitic magmas–a signal from the source?: Earth and Environmental Science Transactions of the Royal Society of Edinburgh, v. 100, no. 1-2, p. 159-172.
Cnudde, V., Masschaele, B., Dierick, M., Vlassenbroeck, J., Hoorebeke, L. V., and Jacobs, P., 2006, Recent progress in X-ray CT as a geosciences tool: Applied Geochemistry, v. 21, no. 5, p. 826-832.
Coleman, D. S., Bartley, J. M., Glazner, A. F., and Pardue, M. J., 2012, Is chemical zonation in plutonic rocks driven by changes in source magma composition or shallow-crustal differentiation?: Geosphere, v. 8, no. 6, p. 1568-1587.
Coleman, D. S., and Glazner, A. F., 1997, The Sierra Crest magmatic event: Rapid formation of juvenile crust during the Late Cretaceous in California: International Geology Review, v. 39, no. 9, p. 768-787.
Coleman, D. S., Glazner, A. F., and Bartley, J. M., 2017, Meltamorphism, Geological Society of America Annual Meeting: Seattle, Washington, United States.
Coleman, D. S., Gray, W., and Glazner, A. F., 2002, U-Pb Geochronological Evidence for Incremental Filling of the Tuolumne Intrusive Suite Magma Chamber, Geological Society of America Annual Meeting: Denver.
Coleman, D. S., Gray, W., and Glazner, A. F., 2004, Rethinking the emplacement and evolution of zoned plutons: Geochronologic evidence for incremental assembly of the Tuolumne Intrusive Suite, California: Geology, v. 32, no. 5, p. 433-436.
Cooper, K. M., and Kent, A. J. R., 2014, Rapid remobilization of magmatic crystals kept in cold storage: Nature, v. 506, p. 480.
43
Andes) and the Importance of Sulphur in Silicic Subduction-related Magmas: Journal of Petrology, v. 45, no. 4, p. 855-881.
Costa, F., and Singer, B., 2002, Evolution of Holocene dacite and compositionally zoned
magma, Volcán San Pedro, southern volcanic zone, Chile: Journal of Petrology, v. 43, no. 8, p. 1571-1593.
Cox, R., Dempster, T., Bell, B., and Rogers, G., 1996, Crystallization of the Shap Granite: evidence from zoned K-feldspar megacrysts: Journal of the Geological Society, v. 153, no. 4, p. 625-635.
Crabtree, S. M., and Lange, R. A., 2010, Complex Phenocryst Textures and Zoning Patterns in Andesites and Dacites: Evidence of Degassing-Induced Rapid Crystallization?: Journal of Petrology, v. 52, no. 1, p. 3-38.
Ernst, W. G., 1976, Petrologic Phase Equilibria, San Francisco, W.H. Freeman.
Farina, F., Stevens, G., and Villaros, A., 2012, Multi-batch, incremental assembly of a dynamic magma chamber: the case of the Peninsula pluton granite (Cape Granite Suite, South Africa): Mineralogy and Petrology, v. 106, no. 3, p. 193-216.
Gagnevin, D., Daly, J., Waight, T. E., Morgan, D., and Poli, G., 2005, Pb isotopic zoning of K-feldspar megacrysts determined by Laser Ablation Multi-Collector ICP-MS: Insights into granite petrogenesis: Geochimica et Cosmochimica Acta, v. 69, no. 7, p. 1899-1915. Gagnevin, D., Daly, J. S., and Poli, G., 2008, Insights into granite petrogenesis from quantitative
assessment of the field distribution of enclaves, xenoliths and K-feldspar megacrysts in the Monte Capanne pluton, Italy: Mineralogical Magazine, v. 72, no. 4, p. 925-940. Gilluly, J., 1948, Origin of Granite, Ann Arbor, Michigan, Edwards Brothers, Inc., The Memoir
Series of the Geological Society of America, 139 p.:
Ginibre, C., Wörner, G., and Kronz, A., 2004, Structure and dynamics of the Laacher See magma chamber (Eifel, Germany) from major and trace element zoning in sanidine: a cathodoluminescence and electron microprobe study: Journal of Petrology, v. 45, no. 11, p. 2197-2223.
Glazner, A. F., Bartley, J. M., Coleman, D. S., Gray, W., and Taylor, R. Z., 2004, Are plutons assembled over millions of years by amalgamation from small magma chambers?: GSA today, v. 14, no. 4/5, p. 4-12.
Glazner, A. F., and Johnson, B. R., 2013, Late crystallization of K-feldspar and the paradox of megacrystic granites: Contributions to Mineralogy and Petrology, v. 166, no. 3, p. 777-799.
44
Grotzinger, J. P., and Jordan, T. H., 2014, Understanding Earth, New York, W.H. Freeman and Company, 672 p.
Gualda, G. A. R., 2019, On the origin of alkali feldspar megacrysts in granitoids: the case against textural coarsening: Contributions to Mineralogy and Petrology, v. 174, no. 11, p. 88. Hayward, N., 1992, Microstructural analysis of the classical spiral garnet porphyroblasts of
south-east Vermont: evidence for non-rotation: Journal of Metamorphic Geology, v. 10, no. 4, p. 567-587.
Higgins, M. D., 1998, Origin of Anorthosite by Textural Coarsening: Quantitative Measurements of a Natural Sequence of Textural Development: Journal of Petrology, v. 39, no. 7, p. 1307-1323.
-, 1999, Origin of megacrysts in granitoids by textural coarsening: a crystal size distribution (CSD) study of microcline in the Cathedral Peak Granodiorite, Sierra Nevada, California: Geological Society, London, Special Publications, v. 168, no. 1, p. 207-219.
-, 2011, Quantitative petrological evidence for the origin of K-feldspar megacrysts in dacites from Taapaca volcano, Chile: Contributions to Mineralogy and Petrology, v. 162, no. 4, p. 709-723.
Johnson, B. R., and Glazner, A. F., 2010, Formation of K-feldspar megacrysts in granodioritic plutons by thermal cycling and late-stage textural coarsening, v. 159, no. 5, p. 599-619. Kaczor, S. M., Hanson, G. N., and Peterman, Z. E., 1988, Disequilibrium Melting of Granite at the Contact with a Basic Plug: A Geochemical and Petrographic Study: The Journal of Geology, v. 96, no. 1, p. 61-78.
Karakas, O., Wotzlaw, J.-F., Guillong, M., Ulmer, P., Brack, P., Economos, R., Bergantz, G. W., Sinigoi, S., and Bachmann, O., 2019, The pace of crustal-scale magma accretion and differentiation beneath silicic caldera volcanoes: Geology, v. 47, no. 8, p. 719-723. Ketcham, R. A., and Carlson, W. D., 2001, Acquisition, optimization and interpretation of X-ray
computed tomographic imagery: applications to the geosciences: Computers & Geosciences, v. 27, no. 4, p. 381-400.
Kistler, R., Chappell, B., Peck, D., and Bateman, P., 1986, Isotopic variation in the Tuolumne intrusive suite, central Sierra Nevada, California: Contributions to Mineralogy and Petrology, v. 94, no. 2, p. 205-220.
Krajewski, K. J., 2019, Mechanisms and rate of emplacement of the Half Dome Granodiorite [B.S.: University of North Carolina at Chapel Hill, 23 p.
45
Long, P. E., and Luth, W. C., 1979, Petrogenesis of microcline megacrysts from Precambrian granitic rocks of the Dixon-Penasaco area, northern New Mexico, in Ingersoll, R. V., ed., New Mexico Geological Society Guidebook, 30th Field Conference: Santa Fe Country, p. 145-153.
Long, P. E., and Luth, W. C., 1986, Origin of K-feldspar megacrysts in granitic rocks;
implications of a partitioning model for barium: American Mineralogist, v. 71, no. 3-4, p. 367-375.
Lundstrom, C., 2009, Hypothesis for the origin of convergent margin granitoids and Earth’s continental crust by thermal migration zone refining: Geochimica et Cosmochimica Acta, v. 73, no. 19, p. 5709-5729.
Lundstrom, C. C., 2016, The role of thermal migration and low-temperature melt in granitoid formation: can granite form without rhyolitic melt?: International Geology Review, v. 58, no. 3, p. 371-388.
Luth, W. C., Jahns, R. H., and Tuttle, O. F., 1964, The granite system at pressures of 4 to 10 kilobars: Journal of Geophysical Research (1896-1977), v. 69, no. 4, p. 759-773. Marsh, B., 1981, On the crystallinity, probability of occurrence, and rheology of lava and
magma: Contributions to Mineralogy and Petrology, v. 78, no. 1, p. 85-98.
Means, W. D., and Park, Y., 1994, New experimental approach to understanding igneous texture: Geology, v. 22, no. 4, p. 323-326.
Memeti, V., Chambers, M., Eddy, M. P., and Schoene, B., 2019, Protracted Magmatic K-Feldspar Megacryst Growth Revealed with CA-ID-TIMS-TEA U-Pb Zircon
Geochronology in the Tuolumne Intrusive Complex, California, Geological Society of America Annual Meeting: Phoenix.
Memeti, V., Paterson, S., Matzel, J., Mundil, R., and Okaya, D., 2010, Magmatic lobes as “snapshots” of magma chamber growth and evolution in large, composite batholiths: An example from the Tuolumne intrusion, Sierra Nevada, California: GSA Bulletin, v. 122, no. 11-12, p. 1912-1931.
Mills, R. D., and Glazner, A. F., 2013, Experimental study on the effects of temperature cycling on coarsening of plagioclase and olivine in an alkali basalt: Contributions to Mineralogy and Petrology, v. 166, no. 1, p. 97-111.
Mills, R. D., Ratner, J. J., and Glazner, A. F., 2011, Experimental evidence for crystal coarsening and fabric development during temperature cycling: Geology, v. 39, no. 12, p. 1139-1142.
46
Müller, A., Breiter, K., Seltmann, R., and Pécskay, Z., 2005, Quartz and feldspar zoning in the eastern Erzgebirge volcano-plutonic complex (Germany, Czech Republic): evidence of multiple magma mixing: Lithos, v. 80, no. 1-4, p. 201-227.
Munnikhuis, J. K., 2016, Variation of Sr and Pb Isotopes in Megacrystic K-Feldspar from the Cathedral Peak Granodiorite, California [Master of Science: University of North Carolina at Chapel Hill, 83 p.
Nemchin, A. A., Giannini, L. M., Bodorkos, S., and Oliver, N. H. S., 2001, Ostwald ripening as a possible mechanism for zircon overgrowth formation during anatexis: theoretical
constraints, a numerical model, and its application to pelitic migmatites of the Tickalara Metamorphics, northwestern Australia: Geochimica et Cosmochimica Acta, v. 65, no. 16, p. 2771-2788.
Oldenburg, C. M., Spera, F. J., Yuen, D. A., and Sewell, G., 1989, Dynamic mixing in magma bodies: Theory, simulations, and implications: Journal of Geophysical Research: Solid Earth, v. 94, no. B7, p. 9215-9236.
Paterson, S. R., Vernon, R., and Zak, J., 2005, Mechanical instabilities and physical accumulation of K-feldspar megacrysts in granitic magma, Tuolumne Batholith, California, USA: Journal of Virtual Explorer, v. 18, no. 1, p. 1-18.
Perini, G., Tepley III, F. J., Davidson, J. P., and Conticelli, S., 2003, The origin of K-feldspar megacrysts hosted in alkaline potassic rocks from central Italy: a track for low-pressure processes in mafic magmas: Lithos, v. 66, no. 3-4, p. 223-240.
Phipps, R. L., 1985, Collecting, preparing, crossdating, and measuring tree increment cores, US Department of the Interior, Geological Survey.
Pirsson, L. V., 1908, Rocks and Rock Minerals, New York, John Wiley & Sons, Inc., 414 p.: Pitcher, W. S., 1997, The Nature and Origin of Granite, London, Chapman & Hall, 544 p.: Piwinskii, A. J., 1968, Experimental Studies of Igneous Rock Series Central Sierra Nevada
Batholith, California: The Journal of Geology, v. 76, no. 5, p. 548-570.
-, 1973, Experimental studies of granitoids from the Central and Southern Coast Ranges,
California: Tschermaks mineralogische und petrographische Mitteilungen, v. 20, no. 2, p. 107-130.
Piwinskii, A. J., and Wyllie, P. J., 1968, Experimental Studies of Igneous Rock Series: A Zoned Pluton in the Wallowa Batholith, Oregon: The Journal of Geology, v. 76, no. 2, p. 205-234.