Received: July 30, 2015; Revised: October 24, 2015; Accepted: November 12, 2015
© The Author 2015. Published by Oxford University Press. All rights reserved. For Permissions, please email: [email protected].
doi:10.1093/carcin/bgv160
Advance Access publication November 16, 2015 Original Manuscript
49
original manuscript
Genetic variants in the mTOR pathway and breast
cancer risk in African American women
Ting-Yuan David Cheng
*
, Christine B.Ambrosone, Chi-Chen Hong,
Kathryn L.Lunetta
1, Song Liu
2, Qiang Hu
2, Song Yao, Lara Sucheston-Campbell,
Elisa V.Bandera
3, Edward A.Ruiz-Narváez
4, Stephen A.Haddad
4, Melissa A.Troester
5,
Christopher A.Haiman
6, Jeannette T.Bensen
5, Andrew F.Olshan
5, Julie R.Palmer
4and
Lynn Rosenberg
4Department of Cancer Prevention and Control, Roswell Park Cancer Institute, Buffalo, NY 14263, USA,
1Department
of Biostatistics, Boston University School of Public Health, Boston, MA 02118, USA,
2Department of Biostatistics and
Bioinformatics, Roswell Park Cancer Institute, Buffalo, NY 14263, USA,
3Cancer Prevention and Control Program, Rutgers
Cancer Institute of New Jersey, Rutgers, The State University of New Jersey, New Brunswick, NJ 08903, USA,
4Slone
Epidemiology Center at Boston University, Boston, MA 02215, USA,
5Department of Epidemiology, Gillings School of Global
Public Health, University of North Carolina at Chapel Hill, Chapel Hill, NC 27599, USA and
6Department of Preventive
Medicine, Norris Comprehensive Cancer Center, University of Southern California Keck School of Medicine, Los Angeles, CA
90089, USA
*To whom correspondence should be addressed. Tel: +1 716 845 3102; Fax: +1 716 845 8125; Email: [email protected]
Abstract
The phosphatidylinositol 3-kinase–AKT–mammalian target of rapamycin (mTOR) pathway has been implicated in breast
carcinogenesis. However, there has been no large-scale investigation of genetic variants in the mTOR pathway and breast
cancer risk. We examined 28 847 single-nucleotide polymorphisms (SNPs) in 61 mTOR pathway genes in the African American
Breast Cancer Epidemiology and Risk consortium of 3663 cases [1983 estrogen receptor-positive (ER+) and 1098 ER-negative
(ER−)] and 4687 controls. Gene-level analyses were conducted using the adaptive rank truncated product (ARTP) test for 10 773
SNPs that were not highly correlated (r
2< 0.8), and SNP-level analyses were conducted with logistic regression. Among genes
that were prioritized (nominal P < 0.05, ARTP tests), associations were observed for intronic SNPs TSC2 rs181088346 [odds ratio
(OR) of each copy of variant allele = 0.77, 95% confidence interval (CI) = 0.65–0.88 for all breast cancer] and BRAF rs114729114
(OR = 1.53, 95% CI = 1.24–1.91 for all breast cancer and OR = 2.03, 95% CI = 1.50–2.76 for ER− tumors). For ER− tumors, intronic
SNPs PGF rs11542848 (OR = 1.38, 95% CI = 1.15–1.66) and rs61759375 (OR = 1.34, 95% CI = 1.14–1.57) and MAPK3 rs78564187 (OR
= 1.26, 95% CI = 1.11–1.43) were associated with increased risk. These SNPs were significant at a gene-wide level
(Bonferroni-corrected P < 0.05). The variant allele of RPS6KB2 rs35363135, a synonymous coding SNP, was more likely to be observed in
ER− than ER+ tumors (OR = 1.18, 95% CI = 1.05–1.31, gene-wide Bonferroni-corrected P = 0.06). In conclusion, specific mTOR
pathway genes are potentially important to breast cancer risk and to the ER negativity in African American women.
Introduction
African American (AA) women have the highest prevalence
of obesity (58.6% with body mass index >30 kg/m
2) (
1
) among
racial/ethnic groups in the USA. AA women are also more likely
the association of obesity with breast cancer risk may differ by
tumor subtypes defined by receptor status, including estrogen
receptor (ER) (
4
,
5
). Although research has suggested several
biological pathways relevant to obesity (e.g. inflammation and
hormonal factors), the mechanisms by which body size
influ-ences breast cancer risk are largely unclear (
6
). Because a key
causal factor for obesity is positive energy imbalance, that is,
energy intake being greater than expenditure, pathways related
to energy signaling may be important to the underlying
mecha-nism behind the influence of obesity on breast cancer risk.
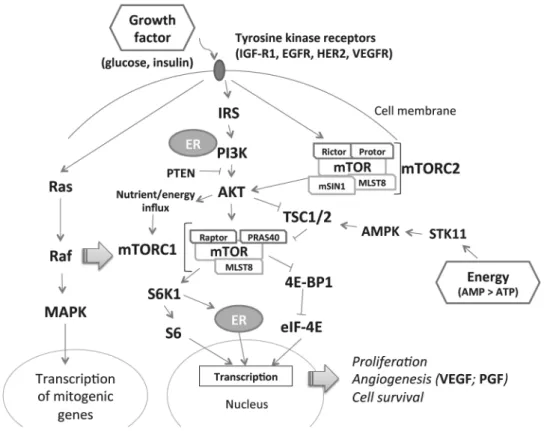
The phosphatidylinositol 3-kinase–AKT–mammalian target
of rapamycin (mTOR) pathway can sense both cellular growth
conditions and energy signaling (
Figure 1
). In cells with excess
energy, adenosine monophosphate signals the mTOR complex
1 (mTORC1), activating a variety of downstream responses
including cell proliferation, angiogenesis and blockage of
cell autophagy (
7
). In addition, mTORC2 receives signals from
growth factors (e.g. glucose and insulin) and further stimulates
AKT and mTORC1 (
8
).
AKT1
and
MTOR
mutations are observed
in breast cancer tumor tissue (
9
). Thus, the mTOR pathway may
be important in breast carcinogenesis, and investigating genetic
polymorphisms in this pathway may shed light on associations
between obesity and breast cancer risk. To date, there are few
studies examining the association of genetic variation in the
mTOR pathway and breast cancer risk (
10
) and subtypes (
10
,
11
),
and only a small number of single-nucleotide polymorphisms
(SNPs) have been examined. Also, to our knowledge, no
pub-lished study has assessed this association among AA women.
Here, we investigated the association of genetic variants in the
mTOR pathway with breast cancer risk in a large sample of AA
women. We examined the association of variants in genes in
the mTOR pathway with overall breast cancer risk, as well as
with ER-positive (ER+) and ER-negative (ER−) breast cancer risk
separately because of potential differences in etiology related
to obesity (
4
,
5
). We also investigated the association of variants
with ER negativity in case-only analysis.
Methods
Study population
We included women with incident invasive breast cancer or ductal car-cinoma in situ and controls with available DNA for genotyping in the African American Breast Cancer Epidemiology and Risk (AMBER) consor-tium (12,13). The AMBER consortium pools data from four studies with large numbers of AA women: the Carolina Breast Cancer Study (CBCS), the Women’s Circle of Health Study (WCHS), the Black Women’s Health
Study (BWHS) and the Multiethnic Cohort (MEC) Study. Briefly, the CBCS is a population-based case–control study of women aged 20–74 years in North Carolina conducted 1993–1996 (phase I) and 1996–2001 (phase 2) (14). Breast cancer cases were identified through the North Carolina Central Cancer Registry; controls were identified from Division of Motor Vehicle lists (age < 65) or from Health Care Financing Administration lists (age ≥ 65). Controls were frequency matched to cases on age in 5-year age groups. The current study also included participants from CBCS phase III, a case-only prospective study started in 2008. Home visits were conducted to collect information on breast cancer risk factors and to obtain biospeci-mens. The WCHS is a case–control study of women aged 20–75 years that began in New York in 2003, subsequently expanded to New Jersey (15), and currently enrolling only AA participants in New Jersey. Breast can-cer cases were identified through major hospitals in New York City and through the New Jersey State Cancer Registry. Controls were identified through random digit dialing and through community-based recruitment (16). Controls were frequency matched to cases on 5-year age group. Data on epidemiologic risk factors and samples for DNA analysis were obtained during home interviews (4). The BWHS is a prospective cohort study of 59 000 AA women 21–69 years of age recruited from 17 states in 1995 (17). Breast cancer diagnoses were self-reported on the biennial follow-up questionnaires or identified through state cancer registries and the National Death Index. Approximately 27 000 BWHS participants provided saliva samples for DNA analysis. The MEC is a prospective study started in 1993–1996 that includes 16 594 AA women 45–75 years of age (18). Data were collected through questionnaires mailed at 5-year intervals; blood samples were obtained for DNA analysis. Cases were identified by link-age to the Hawaii Tumor Registry, the Cancer Surveillance Program for Los Angeles County and the California State Cancer Registry. For BWHS and MEC cohorts, controls were selected among study participants who had not been diagnosed with breast cancer.
For all studies, ER status was based on immunohistochemistry results from hospital pathology records and/or cancer registry data. All partici-pants were self-identified AA women. Each study obtained informed con-sent from all participants and was approved by the relevant Institutional Review Boards.
Genotyping
DNA was isolated from blood in CBCS and MEC, from saliva obtained using Oragene kits in WCHS and from saliva obtained using a mouthwash-swish method in BWHS (19). A total of 61 candidate genes of the mTOR pathway were selected based on pathway information provided by BioCarta (20) and Kyoto Encyclopedia of Genes and Genomes (KEGG) (Supplementary Table 1, is available at Carcinogenesis Online). The gene set included key proteins of the mitogen-activated protein kinases (MAPK) pathway, which can signal the mTOR pathway (10). Tag SNPs were selected based on link-age disequilibrium (r2 ≥ 0.8) with minor allele frequency ≥10%, according
to the haplotype structure of the Yoruban population in 1000 Genomes. Genotyping using the Illumina Human Exome Beadchip v1.1 with custom content was performed on samples from CBCS, WCHS and BWHS by the Center for Inherited Disease Research (CIDR). Genotypes were attempted for 6936 study subjects from the BWHS, CBCS and WCHS, and completed with call rate >98% for 6828 (3130 cases and 3698 controls). Prior to imputa-tion, we omitted SNPs that were monomorphic, were positional duplicates, were on the Y chromosome, had a P value for Hardy–Weinberg equilibrium <1 × 10⁻⁴, had call rate <0.98, had >1 Mendelian errors in HapMap trios or
had >2 discordant calls in duplicate samples. Imputation was performed at the University of Washington, Seattle, WA, using IMPUTE2 software and the 1000 Genomes Phase I reference panel (release date: 21 May 2011; December 2013 released haplotypes) (21). SNPs from the standard and cus-tom content of the exome chip were used to impute the 1000 Genomes variants present with ≥2 minor alleles on the AFR and EUR panels. As the imputation backbone for this study was not as dense as typical genome-wide association study chips, imputation quality metrics in regions with sparse coverage was lower than for genome-wide association study chips. However, 57% of all 1000 Genomes imputed variants within 60 kb of at least one genotyped SNP on our panel had r2 ≥ 0.5. Using the masking
analysis in IMPUTE2 to compare imputed to true genotypes, that is, impu-tation r2, variants with MAF ≥ 0.05 had median r2 = 0.93, and variants with
MAF < 0.05 had median r2 = 0.53. For the MEC study, genetic data from 533
Abbreviations
AA
African American
AMBER
African American Breast Cancer Epidemiology
and Risk
ARTP
adaptive rank truncated product
BWHS
Black Women’s Health Study
CBCS
Carolina Breast Cancer Study
CI
confidence interval
ER
estrogen receptor
MAPK
mitogen-activated protein kinases
MEC
Multiethnic Cohort
mTOR
mammalian target of rapamycin
mTORC
mTOR complex
OR
odds ratio
cases and 989 controls were already available, including Illumina Human 1M-Duo chip data and SNPs imputed from 1000 Genomes. The imputed genotypes from the BWHS, CBCS and WCHS were combined with the imputed genotypes from MEC into a final data set. Variants were included in the combined data set if the allele frequencies in the two subsets dif-fered by ≤0.15 or if the imputation r2 was ≥0.5 in either study. The
cri-terion of imputation r2 was more stringent than what was commonly
used in genome-wide association study (r2 ≥ 0.2–0.3) (22,23). Subsequently,
28 847 SNPs from the 61 mTOR pathway candidate genes entered statis-tical analyses for this study (see Supplementary Material, is available at Carcinogenesis Online, for rsID and other information).
To account for population structure, genotype principal components were computed using the smartpca program in the EIGENSOFT package (24). The principal components of genotype were tested for association with case status after accounting for study covariates: study, age (10-year groupings, matching variable), geographic location (matching variable) and DNA source [blood, saliva (Oragene), saliva (mouthwash)]. No prin-cipal components were strongly associated with case status after con-trolling for the study covariates. For case status and subtype association analyses, we included principal components associated in the full covari-ate model with P < 0.1.
Statistical analysis
Case–control analyses were conducted for all cases, ER+ cases and ER− cases. Among cases with known ER status, case–case analyses were con-ducted comparing genetic variants between ER− cases and ER+ cases. The case–case analysis is important because active mTOR pathway is associ-ated with lower ER expression levels in ER+ breast tumors (25), and acti-vated mTOR protein has been more frequently observed in triple-negative breast cancer than non-triple negative breast cancer (26). Two approaches were used to examine associations of SNPs and breast cancer risk: gene- and SNP-based analyses. The gene-based analysis was performed using
the adaptive rank truncated product (ARTP) test implemented in the R package PIGE (27). The ARTP combined the optimal number of most sig-nificant P-values from among the top 10 SNPs for each gene. We selected a set of 10 773 SNPs that were not highly correlated for implementing the ARTP method to avoid capturing only a few association signals for some genes due to correlations between their top SNPs. One SNP of every pair of SNPs with correlation r2 ≥ 0.8 were excluded from the gene-based tests
using the filter.R2 option in the R package AdaJoint.
SNP-level association analyses were performed for SNPs in genes with nominal P < 0.05 in the ARTP tests. We used logistic regression with case status as outcome, and an additive model for genotype, adjusting for age (10-year groups), study, geographic location, DNA source and principal components of the genotypes. P-values were corrected by the Bonferroni method for the number of SNPs tested within each gene (Padj). Imputed
SNPs with minor allele frequency (MAF) <0.02 were excluded due to low imputation quality. In addition, to avoid missing any potentially meaning-ful associations, we report top SNP-level associations for genes with nomi-nal P ≥ 0.05. P-values for heterogeneity between the risk of ER− and ER+ subtypes were calculated using a case–case only logistic regression model.
Statistical analyses were performed using PLINK (version 1.07) and R software. Functional follow-up was performed in the ENCODE (Encyclopedia of DNA Elements), including HaploReg v3 and RegulomeDB databases (28,29).
Results
Table 1
shows the ER status and age distributions of the study
participants with genotype data (3663 cases and 4687 controls)
in each study. Overall, 35.6% cases had ER− tumors, with CBCS
having the highest percentage of young cases.
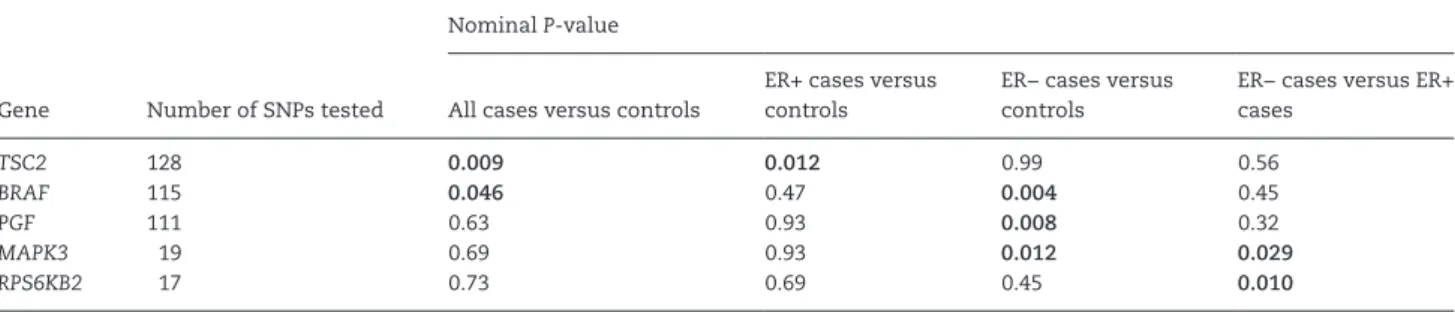
genes that had a nominal
P
value <0.05 in relation to breast
can-cer in the gene-level analysis. Tuberous sclerosis 2 (
TSC2
) and
B-Raf proto-oncogene, serine/threonine kinase (
BRAF
) were
associated with all breast cancer;
TSC2
with ER+ tumors; and
BRAF
, placental growth factor (
PGF
), and mitogen-activated
pro-tein kinase 3 (
MAPK3
) with ER− tumors. Comparing ER− cases
with ER+ cases,
MAPK3
and ribosomal protein S6 kinase, 70 kDa,
polypeptide 2 (
RPS6KB2
) had a nominal
P
< 0.05.
Table 3
shows gene-wide significant variants from the
SNP-level association analysis with all, ER+ and ER− breast cancer.
Among the nominally significant genes, the variant allele of
TSC2
rs181088346 was significantly associated with a decrease
in overall breast cancer risk [odds ratio (OR) = 0.77 for each
copy of the A allele, 95% confidence interval (CI) = 0.65–0.88,
P
adj= 0.035]. Similar ORs (0.73 and 0.88) were observed for ER+
cases and ER− cases compared with controls, respectively.
BRAF
rs114729114 was associated with increased risk of all breast
cancer (OR = 1.53 for each copy of the T allele, 95% CI = 1.24–
1.91,
P
adj= 0.012), with stronger associations with ER− tumors
(OR = 2.03, 95% CI = 1.50–2.76,
P
adj= 0.001), than ER+ tumors
(OR = 1.44, 95% CI = 1.10–1.87,
P
adj= 0.79;
P
-heterogeneity = 0.006).
PGF
rs11542848 at 5
′
-untranslated region (OR = 1.38 for each copy
of the T allele, 95% CI = 1.15–1.66,
P
adj= 0.049) and an intron SNP
rs61759375 (OR = 1.34 for each copy of the T allele, 95% CI = 1.14–
1.57,
P
adj= 0.032), as well as
MAPK3
rs78564187 (intron, OR = 1.26
for each copy of the A allele, 95% CI = 1.11–1.43,
P
adj= 0.006), were
also associated with an increase in ER− breast cancer risk. In
the case–case analysis comparing ER− and ER+ cases, a
synony-mous coding SNP, rs35363135, had the lowest
P
value in
RPS6KB2
(OR = 1.18 for each copy of the A allele, 95% CI = 1.05–1.31,
nomi-nal
P
= 0.0038,
P
adj= 0.06; data not shown).
Top SNPs in non-significant genes are listed in
Supplementary
Table 2
, is available at
Carcinogenesis
Online. Multiple signals were
observed for phosphatidylinositol-4,5-bisphosphate 3-kinase,
catalytic subunits:
PIK3CA
,
PIK3CB
,
PIK3R1
and
PIK3R3
(all cases
versus controls);
RPS6KA2
(all cases and ER− cases versus
con-trols) and regulatory associated protein of MTOR, complex 1
(
RPTOR
; all cases and ER+ cases versus controls), protein kinase,
adenosine monophosphate–activated and gamma 2
non-cata-lytic subunit (
PRKAG2
; ER− cases versus controls). Several SNPs
in
PRKAG2
,
RPS6KA2
and
RPTOR
were observed in the case–case
comparison. None of the SNPs reported in
Supplementary
Table 2
, is available at
Carcinogenesis
Online, were statistically
significant after a Bonferroni correction for total number of
tested SNPs.
Discussion
In the AMBER consortium study of breast cancer in AA women,
several genes in the mTOR pathway, namely,
TSC2
,
BRAF
,
PGF
and
MAPK3
, were associated with overall risk of breast cancer
and subtypes defined by ER status. In these genes, specific SNPs
associated with breast cancer risk were identified after
correct-ing for multiple comparisons at the gene level. To our
knowl-edge, this is the first study that systematically examined the
association of mTOR pathway genes with breast cancer risk in
AA women, a population with higher proportions of obesity and
ER− breast cancer than white women.
Among the significant SNPs in our results, several appear to be
in regions with important regulatory functions (
Supplementary
Table 3
, is available at
Carcinogenesis
Online).
PGF
rs11542848 is
located in a region with transcriptional promoters for breast
myoepithelial cells. In
PGF
, the other significant SNP rs61759375
maps to a region containing transcriptional enhancers, and
its tagged SNP rs11542848 is located in the promoter region of
5
′
-untranslated region. In addition,
MAPK3
rs78564187 also tags
several SNPs that overlap enhancer binding sites. Also, our case–
case analysis showed that a synonymous coding SNP rs35363135
in
RPS6KB2
was associated with ER− breast cancer. The SNP
is located in a region containing active promoters and likely
Table 1. Case–control status and age distribution in the studies of the AMBER consortiumCase–control status and variable CBCS WCHS BWHS MEC Total (AMBER consortium)
Breast cancer casesa 1408 821 901 533 3663
ER+ 741 (56.7)b 435 (72.5) 498 (68.1) 309 (69.6) 1983 (64.4)
ER− 595 (43.3) 165 (27.5) 233 (31.9) 135 (30.4) 1098 (35.6)
Controls 615 834 2249 989 4687
Age (year)
<50 961 (47.5) 644 (38.9) 1178 (37.4) 25 (1.6) 2808 (33.6) ≥50 1062 (52.5) 1011 (61.1) 1972 (62.6) 1497 (98.4) 5542 (66.4)
Values in parentheses are percentages.
aFive hundred and eighty-two cases (15.9%) in AMBER had unknown ER status. bPercentages of all breast cancer cases with known ER status.
Table 2. Genes in the mTOR pathway with nominally significant P-values in case–control and case–case analyses Nominal P-value
Gene Number of SNPs tested All cases versus controls
ER+ cases versus controls
ER− cases versus controls
ER− cases versus ER+ cases
TSC2 128 0.009 0.012 0.99 0.56
BRAF 115 0.046 0.47 0.004 0.45
PGF 111 0.63 0.93 0.008 0.32
MAPK3 19 0.69 0.93 0.012 0.029
RPS6KB2 17 0.73 0.69 0.45 0.010
affecting transcription factor binding (RegulomeDB score = 2b).
RPS6KB2
encodes a member of the S6K1 family of
serine/threo-nine kinases, which can modify ER expression (
30
).
Data on the mTOR pathway SNPs in relation to breast
can-cer risk or subtypes are very limited. One study examined
three functional SNPs of the late endosomal LAMTOR complex
(
LAMTOR2
and
LAMTOR3
), which is a key protein for the crosstalk
between the mTOR and the MAPK pathways, among European
women (
10
). This study found that in a small case-only analysis
(296 cases), variants in
LAMTOR3
rs148972953 were associated
with higher proportions of ER− and progesterone receptor
nega-tive breast cancers. In a subsequent larger case–control analysis
(2715 cases and 5216 controls), however, the SNP was not
asso-ciated with breast cancer risk (
10
). Although
LAMTOR3
was not
included in our gene selection, we observed two SNPs in
MAPK3
and
BRAF
, a member of the Raf family and main activator of
the MAPK pathway, were associated with a modest increase in
ER− breast cancer risk in AMBER. Another study examined six
tag SNPs in
TSC1
and
TSC2
in 1137 breast cancer cases, with
the majority being Caucasians (78%). Patients with the
TSC1
rs1073123 variant were less likely to have ER− breast cancer
than ER+ breast cancer (OR = 0.39, 95% CI = 0.14–1.08,
P
= 0.06;
homozygous variant versus common allele) (
11
). In AMBER, we
observed a non-significant inverse association for this SNP
com-paring ER− cases to ER+ cases (OR = 0.94 for each copy of the
var-iant allele, 95% CI = 0.83–1.07, nominal
P
= 0.39; data not shown).
The mechanisms of
TSC1
and
TSC2
influencing ER expression
may involve the inhibition of ER-
α
functions by tuberin, the
protein product of
TSC2
(
31
). The significant SNPs in our results
have not been reported in Caucasian or Asian women for breast
cancer risk or subtypes.
Current literature suggests that mTOR pathway genes
involved in carcinogenesis may differ by cancer site. A number
of SNPs in
RPTOR
and
AKT3
have been linked to risk of bladder
cancer and renal cell carcinoma, respectively, in non-Hispanic
whites (
32
,
33
). The reported SNPs in these two genes were not
significantly associated with breast cancer risk in AMBER
(nomi-nal
P
> 0.05; data not shown), although our exploratory analysis
suggested that a number of SNPs in
RPTOR
may be potentially
important for overall and ER+ breast cancer risks in AA women.
However, for colorectal cancer, significant SNPs were observed
in various genes including
MTOR
,
PIK3CA
,
PRKAG2
,
PTEN
,
STK11
,
TSC1
and
TSC2
(
34
). The variant in
PRKAG2
rs4128396 was
associ-ated with an increased risk of rectal cancer (OR = 1.33, 95% CI =
1.09–1.63; AC/CC versus AA genotypes) (
34
). In AMBER, however,
this SNP was associated with a decrease in ER− breast cancer
risk (OR = 0.76 for each copy of the variant allele, 95% CI = 0.59–
0.97, nominal
P
= 0.028; data not shown). These observations
require validation using populations with the same ancestral
backgrounds. From a biological point of view, the mTOR
path-way can be signaled by multiple factors (growth factors,
nutri-ents and energy), and all cells may not be equally responsive
to these factors. Thus, cells in distinctive tissues or organs may
have different requirement for mTOR (
8
).
The large sample size enabled analysis of risk for overall
breast cancer, as well as for ER+ and ER− cancer separately.
Furthermore, this was a more comprehensive evaluation of
mTOR pathway SNPs than in most previous studies. However,
several limitations should be noted. First, all the significant
SNPs identified were imputed in either the CBCS/WCHS/BWHS
combined genotyping project, the MEC genotyping project, or
both. These imputed SNPs have high accuracy [imputation
r
2≥
0.9, except for
TSC2
rs181088346 and
PGF
rs61759375 (
r
2= 0.802
and 0.884, respectively, in the MEC genotyping project) and
BRAF
Ta
ble 3.
Gene-wide significant tested SNPs for all br
east cancer
, ER+ tumors or ER− tumors
All cases v
ersus contr
ols
ER+ cases v
ersus contr
ols
ER− cases v
ersus Contr ols P -heter og enerity f Gene SNP Function Alleles a MAF b Imputation r 2 c
OR (95% CI)
d
Nominal
P
Padj
e
OR (95% CI)
d
Nominal
P
Padj
OR (95% CI)
d Nominal P Padj TSC2 rs181088346 Intr on G/A 0.06 0.909/0.802 0.77 (0.65–0.88) 2.7 × 10 −4 0.035 0.73 (0.61–0.88) 0.0010 0.13 0.88 (0.70–1.09) 0.25 1.0 0.22 BRAF rs114729114 Intr on C/T 0.03 0.728/0.950 1.53 (1.24–1.91) 1.1 × 10 −4 0.012 1.44 (1.10–1.87) 0.0069 0.79 2.03 (1.50–2.76)
5.6 x 10
-6 0.001 0.006 PGF rs11542848 5 ′ -UTR C/T 0.08 0.983/0.923 1.14 (1.01–1.29) 0.035 1.0 1.13 (0.97–1.31) 0.08 1.0 1.38 (1.15–1.66)
4.5 x 10
-4 0.049 0.22 PGF rs61759375 Intr on C/T 0.11 0.975/0.884 1.11 (1.00–1.24) 0.051 1.0 1.07 (0.94–1.22) 0.29 1.0 1.34 (1.14–1.57)
2.9 x 10
-4 0.032 0.06 MAPK3 rs78564187 Intr on G/A 0.18 Genotyped/0.966 1.07 (0.98–1.16) 0.13 1.0 1.03 (0.92–1.14) 0.63 1.0 1.26 (1.11–1.43)
3.4 x 10
-4
0.006
0.004
aMajor/minor alleles. bMinor allele fr
equenc
y among contr
ols.
cr 2 for imputed SNPs in the CBCS
, WCHS and BWHS g
enotyping pr
oject/the MEC g
enotyping pr
oject.
dAdditi
ve model with eac
h SNP coded as 0,
1 or 2 copies of the minor allele
, adjusting for a
ge , stud y, g eo gr aphic location, DN A sour
ce and principal components of the g
enotypes. eBonferr oni-corr ected P v alues; bold Padj ar
e significant at the 0.05 le
vel.
fCalculated using a case–case onl
y lo
gistic r
egr
rs114729114 (
r
2= 0.728 in the CBCS/WCHS/BWHS genotyping
project),
Table 3
]. To further validate our findings, we performed
association analyses among the individuals with a posterior
genotype probability ≥0.9 at the untyped SNPs in the CBCS/
WCHS/BWHS project (
35
). There was no material difference
in risk estimates between all individuals and those with high
certainty of the imputed genotype (
Supplementary Table 4
, is
available at
Carcinogenesis
Online). Although the quality of these
imputed SNPs was very high, results from these imputed SNPs
warrant further confirmation by genotyping. Second, we did not
have data on human epidermal growth factor receptor 2 in a
suf-ficient number of cases for specific analyses of triple-negative
breast cancer or other subtypes dependent on that molecular
marker. Lastly, our findings require validation, as the gene-level
associations were not significant after correction for multiple
tests.
In conclusion, in this systematic assessment of genetic
variation in the mTOR pathway, we identified several genes
that are associated with risk of breast cancer overall (
TSC2
and
BRAF
), ER+ tumors (
TSC2
) and ER− tumors (
BRAF
,
PGF
and
MAPK3
). Our findings suggest that the mTOR pathway
may be important in breast carcinogenesis in AA women.
Future studies on genetic variants in the mTOR pathway with
breast cancer risk and subtypes should involve obesity
phe-notypes to reveal potential gene–environment interactions.
In addition, direct assessment of mTOR activities, for
exam-ple, mTOR protein expression in tumor tissues, can provide
a better understanding of underlying mechanisms of
obe-sity regarding energy imbalance in relation to breast cancer
subtypes.
Supplementary material
Supplementary Tables 1–4
and
Supplementary Material
can be
found at
http://carcin.oxfordjournals.org/
Funding
The National Cancer Institute (grant number P01CA151135 to
J.R.P., C.B.A. and A.F.O.; R01CA058420 to L.R.; UM1CA164974 to
L.R.; R01CA098663 to J.R.P.; R01CA100598 to C.B.A. and E.V.B.;
P50CA58223 to M.A.T. and A.F.O.); the University Cancer Research
Fund of North Carolina (M.A.T. and A.F.O.); the Breast Cancer
Research Foundation (C.B.A.).
Acknowledgements
We thank participants and staff of the contributing studies.
We also wish to acknowledge the late R.Millikan, DVM, MPH,
PhD, who was instrumental in the creation of this consortium.
Pathology data were obtained from numerous state cancer
reg-istries (Arizona, California, Colorado, Connecticut, Delaware,
District of Columbia, Florida, Georgia, Hawaii, Illinois, Indiana,
Kentucky, Louisiana, Maryland, Massachusetts, Michigan, New
Jersey, New York, North Carolina, Oklahoma, Pennsylvania,
South Carolina, Tennessee, Texas and Virginia), and the results
do not necessarily represent their views.
Conflict of Interest Statement
: None declared.
References
1. Flegal, K.M. et al. (2012) Prevalence of obesity and trends in the dis-tribution of body mass index among US adults, 1999-2010. JAMA, 307, 491–497.
2. Ford, E.S. et al. (2014) Trends in mean waist circumference and abdomi-nal obesity among US adults, 1999-2012. JAMA, 312, 1151–1153. 3. Rose, D.P. et al. (2007) Adiposity, the metabolic syndrome, and breast
cancer in African-American and white American women. Endocr. Rev., 28, 763–777.
4. Bandera, E.V. et al. (2013) Body fatness and breast cancer risk in women of African ancestry. BMC Cancer, 13, 475.
5. Bandera, E.V. et al. (2015) Obesity, body fat distribution, and risk of breast cancer subtypes in African American women participating in the AMBER Consortium. Breast Cancer Res. Treat., 150, 655–666. 6. Vucenik, I. et al. (2012) Obesity and cancer risk: evidence, mechanisms,
and recommendations. Ann. N.Y. Acad. Sci., 1271, 37–43.
7. Zoncu, R. et al. (2011) mTOR: from growth signal integration to cancer, diabetes and ageing. Nat. Rev. Mol. Cell Biol., 12, 21–35.
8. Guertin, D.A. et al. (2007) Defining the role of mTOR in cancer. Cancer Cell, 12, 9–22.
9. Cancer Genome Atlas Network. (2012) Comprehensive molecular por-traits of human breast tumours. Nature, 490, 61–70.
10. De Araujo, M.E. et al. (2013) Polymorphisms in the gene regions of the adaptor complex LAMTOR2/LAMTOR3 and their association with breast cancer risk. PLoS One, 8, e53768.
11. Mehta, M.S. et al. (2011) Polymorphic variants in TSC1 and TSC2 and their association with breast cancer phenotypes. Breast Cancer Res. Treat., 125, 861–868.
12. Palmer, J.R. et al. (2014) A collaborative study of the etiology of breast cancer subtypes in African American women: the AMBER consortium. Cancer Causes Control, 25, 309–319.
13. Palmer, J.R. et al. (2014) Parity, lactation, and breast cancer subtypes in African American women: results from the AMBER Consortium. J. Natl Cancer Inst., 106, dju237.
14. Millikan, R.C. et al. (2008) Epidemiology of basal-like breast cancer. Breast Cancer Res. Treat., 109, 123–139.
15. Ambrosone, C.B. et al. (2009) Conducting molecular epidemiological research in the age of HIPAA: a multi-institutional case-control study of breast cancer in African-American and European-American women. J. Oncol., 2009, 871250.
16. Bandera, E.V. et al. (2013) Rethinking sources of representative controls for the conduct of case-control studies in minority populations. BMC Med. Res. Methodol., 13, 71.
17. Russell, C. et al. (2001) Follow-up of a large cohort of Black women. Am. J. Epidemiol., 154, 845–853.
18. Kolonel, L.N. et al. (2000) A multiethnic cohort in Hawaii and Los Ange-les: baseline characteristics. Am. J. Epidemiol., 151, 346–357.
19. Cozier, Y.C. et al. (2004) Comparison of methods for collection of DNA samples by mail in the Black Women’s Health Study. Ann. Epidemiol., 14, 117–122.
20. BioCarta. http://www.broadinstitute.org/gsea/msigdb/cards/BIOCARTA_ MTOR_PATHWAY.html (30 July 2015, date last accessed).
21. Howie, B.N. et al. (2009) A flexible and accurate genotype imputation method for the next generation of genome-wide association studies. PLoS Genet., 5, e1000529.
22. Stolk, L. et al. (2012) Meta-analyses identify 13 loci associated with age at menopause and highlight DNA repair and immune pathways. Nat. Genet., 44, 260–268.
23. Elks, C.E. et al. (2010) Thirty new loci for age at menarche identified by a meta-analysis of genome-wide association studies. Nat. Genet., 42, 1077–1085.
24. Patterson, N. et al. (2006) Population structure and eigenanalysis. PLoS Genet., 2, e190.
25. Creighton, C.J. et al. (2010) Proteomic and transcriptomic profiling reveals a link between the PI3K pathway and lower estrogen-receptor (ER) levels and activity in ER+ breast cancer. Breast Cancer Res., 12, R40. 26. Walsh, S. et al. (2012) mTOR in breast cancer: differential expression in
triple-negative and non-triple-negative tumors. Breast, 21, 178–182. 27. Yu, K. et al. (2009) Pathway analysis by adaptive combination of
P-val-ues. Genet. Epidemiol., 33, 700–709.
28. Encode Project Consortium. (2012) An integrated encyclopedia of DNA elements in the human genome. Nature, 489, 57–74.
30. Yamnik, R.L. et al. (2009) S6 kinase 1 regulates estrogen receptor alpha in control of breast cancer cell proliferation. J. Biol. Chem., 284, 6361–6369. 31. Finlay, G.A. et al. (2004) Estrogen-induced smooth muscle cell growth is
regulated by tuberin and associated with altered activation of platelet-derived growth factor receptor-beta and ERK-1/2. J. Biol. Chem., 279, 23114–23122.
32. Chen, M. et al. (2009) Genetic variations in PI3K-AKT-mTOR pathway and bladder cancer risk. Carcinogenesis, 30, 2047–2052.
33. Shu, X. et al. (2013) Energy balance, polymorphisms in the mTOR path-way, and renal cell carcinoma risk. J. Natl Cancer Inst., 105, 424–432. 34. Slattery, M.L. et al. (2010) Genetic variation in a metabolic
signal-ing pathway and colon and rectal cancer risk: mTOR, PTEN, STK11, RPKAA1, PRKAG2, TSC1, TSC2, PI3K and Akt1. Carcinogenesis, 31, 1604– 1611.