INFANT GROWTH TRAJECTORIES AND LIPID LEVELS IN
ADOLESCENCE
Ann Von Holle
A dissertation submitted to the faculty at the University of North Carolina at Chapel Hill in partial fulfillment of the requirements for the degree of Doctor of Philosophy in the
Department of Epidemiology in the Gillings School of Global Public Health.
Chapel Hill 2018
Approved by:
Kari North
Sheila Gahagan
Gerardo Heiss
Misa Graff
© 2018 Ann Von Holle
ALL RIGHTS RESERVED
ABSTRACT
Ann Von Holle: Infant growth trajectories and lipid levels in adolescence
(Under the direction of Kari North)
Developmental Origins of Health and Disease theory posits that elements of early life
affect susceptibility to chronic disease during adulthood. Postnatal growth is one such element
of early life that has been hypothesized as influencing chronic disease such as Atherosclerotic
Cardiovascular Disease (ASCVD), which is responsible for one out of every three deaths in the
United States. Researchers in the field of developmental origins hypothesize that postnatal
growth is an environmental factor that permanently programs lipid metabolism, a known
and well-established risk factor for ASCVD. We investigated the association between early
postnatal anthropometric change and adverse lipid levels in adolescence in a contemporary
Chilean birth cohort. Primary aims included: a) characterize predictors of infant growth,
b) investigate the association between early infant growth trajectories and lipid levels, and
c) evaluate the capacity of postnatal growth trajectories to modify the association between
functional genetic variants and lipid levels in adolescence.
Results from this research demonstrated distinct patterns of growth in which faster
anthropometric growth groups were associated with a more favorable lipid profile. In the
first manuscript, lower socioeconomic position was associated with a lower length velocity
SITAR parameter (-0.22, 95% CI=-0.31,-0.13). In the second manuscript, the length velocity
SITAR parameter was positively associated with HDL-C levels in adolescence (11.5, SE=4.0)
although no associations were statistically significant after adjustment for multiple
compar-isons. Lastly, the third manuscript provided little evidence supporting a concept that growth
is an effect modifier when assessing genetic associations with lipids.
Taken together, these results identify faster growth in early infancy as a protective factor.
Mechanisms by which this occurs remain an open question, and postnatal growth remains a
possible environmental cue for lipid metabolism programming. In turn, this information can
support the search for optimal postnatal growth and with it, the potential for modification of
chronic disease risk factor development later in life.
TABLE OF CONTENTS
LIST OF TABLES . . . xii
LIST OF FIGURES . . . xiv
LIST OF ABBREVIATIONS . . . xvi
CHAPTER 1: SPECIFIC AIMS . . . 1
1.1 Specific Aims . . . 1
1.1.1 Aim 1. . . 2
1.1.2 Aim 2. . . 3
1.1.3 Aim 3. . . 3
CHAPTER 2: BACKGROUND AND SIGNIFICANCE . . . 5
2.1 Overview . . . 5
2.1.1 Dyslipidemia in children . . . 5
2.1.2 Evidence for an association between postnatal growth and dyslipidemia later in life . . . 6
2.1.3 Analytic Issues . . . 7
2.1.4 Summary . . . 7
2.1.5 Directed Acyclic Graph (DAG) . . . 7
2.2 Dyslipidemia in children . . . 8
2.2.1 Stages of development in childhood . . . 9
2.2.2 Lipoproteins . . . 9
2.2.3 Age patterns in lipid level variation . . . 17
2.2.4 Tracking into adulthood . . . 19
2.2.5 Gender differences . . . 21
2.2.6 Primary genetic causes of dyslipidemia . . . 22
2.2.7 Secondary risk factors for dyslipidemia . . . 22
2.2.8 Environmental factors for infants . . . 23
2.2.9 Racial and ethnic disparities . . . 24
2.2.10 Polygenic factors . . . 26
2.3 Evidence for an association between postnatal growth and distal cardiovascular disease risk factors . . . 32
2.3.1 Animal models . . . 34
2.3.2 Human Studies . . . 36
2.3.3 Biological pathways . . . 39
2.3.4 Factors affecting postnatal growth . . . 47
2.4 Analytic Issues . . . 49
2.4.1 Current analytic approaches for growth . . . 49
2.4.2 Detecting gene-environment interactions . . . 50
2.4.3 Polygenic Risk Score . . . 54
2.5 Summary . . . 56
CHAPTER 3: RESEARCH PLAN . . . 58
3.1 Outcome Assessment . . . 58
3.1.1 Anthropometric Measures . . . 58
3.1.2 Exposure Assessment . . . 58
3.2 Data Source: Santiago Longitudinal Cohort Study (SLCS) . . . 59
3.3 Statistical Analyses . . . 62
3.3.1 Aim 1.1 – Characterize growth trajectories with SITAR method . . . 63
3.3.3 Aim 2 – Determine association between growth trajectories
and adverse lipid levels. . . 66
3.3.4 Aim 3 – Determine change in association between SNPs and adverse lipid levels across characteristics of infant growth . . . 67
CHAPTER 4: MANUSCRIPT 1 — SOCIODEMOGRAPHIC PREDICTORS OF EARLY POSTNATAL GROWTH . . . 70
4.1 Overview . . . 70
4.2 Introduction . . . 71
4.3 Methods . . . 73
4.3.1 Study sample . . . 73
4.3.2 Outcome and sociodemographic measures . . . 74
4.3.3 Statistical analyses . . . 74
4.4 Results . . . 76
4.4.1 Weight trajectories: size, tempo and velocity . . . 77
4.4.2 Length trajectories: tempo and velocity . . . 78
4.4.3 Weight-for-length trajectories: size and tempo . . . 78
4.5 Discussion . . . 79
4.6 Tables . . . 85
CHAPTER 5: MANUSCRIPT 2 — INFANT GROWTH TRAJECTORIES AND LIPID LEVELS IN ADOLESCENCE: EVIDENCE FROM A CHILEAN INFANCY COHORT . . . 89
5.1 Overview . . . 89
5.2 Introduction . . . 90
5.3 Methods . . . 93
5.3.1 Sample . . . 93
5.3.2 Anthropometric, lipid, and covariate measures . . . 94
5.3.3 Statistical Analysis . . . 94
5.4 Results . . . 97
5.4.1 SITAR . . . 97
5.4.2 LGMM . . . 98
5.5 Discussion . . . 100
5.6 Tables . . . 106
5.7 Figures . . . 113
CHAPTER 6: MANUSCRIPT 3 — INFANT GROWTH AS AN EFFECT MODIFIER OF GENETIC-LIPID ASSOCIATIONS: EVIDENCE FROM A CHILEAN INFANCY COHORT . . . 115
6.1 Overview . . . 115
6.2 Introduction . . . 116
6.3 Methods . . . 118
6.3.1 Sample . . . 118
6.3.2 Genotyping . . . 118
6.3.3 Anthropometric, lipid, and covariate measures . . . 118
6.3.4 Statistical Analysis . . . 119
6.3.5 Risk variants . . . 119
6.3.6 Genetic Risk Score (GRS) . . . 120
6.3.7 Growth estimates . . . 120
6.3.8 Confounders . . . 122
6.4 Results . . . 123
6.5 Discussion . . . 124
6.5.1 Strengths and Limitations . . . 128
6.5.2 Conclusion . . . 129
6.6 Tables . . . 129
6.7 Figures . . . 135
CHAPTER 7: DISCUSSION . . . 140
7.1.1 Study aims . . . 140
7.1.2 Results . . . 142
7.2 Strengths and Limitations . . . 143
7.2.1 Strengths . . . 143
7.2.2 Limitations . . . 144
7.3 Contributions to Public Health . . . 146
APPENDIX A: GRAFFAR INDEX COMPONENT DESCRIPTION . . . 148
APPENDIX B: SITAR MODEL FIT . . . 150
APPENDIX C: LGMM MODEL FIT . . . 154
APPENDIX D: MANUSCRIPT 3: LIPID LOCI IN HISPANIC ANCES-TRY POPULATIONS (BOTH THOSE UNIQUE TO HL ANCESTRAL POPULATIONS AND GENERALIZED TO EUROPEAN ANCESTRAL POPULATIONS . . . 155
D.1 List of genetic variants used for the trait specific genetic risk scores and considered in power calculations. . . 155
APPENDIX E: MANUSCRIPT 3: ALL PAIRWISE GROWTH CLASS DIF-FERENCES IN LIPID DISTAL OUTCOME AND MEAN LIPID DISTAL OUTCOMES BY LATENT CLASS GROUPS . . . 165
E.1 Pairwise differences in selected SNP-lipid associations across growth classes . . 165
E.2 Pairwise differences in SNP-lipid associations across growth classes for other, non-primary, lipid traits . . . 167
E.3 Pairwise differences in risk score-trait associations across growth classes . . . 174
E.4 Selected SNP-lipid additive associations by growth class . . . 175
E.5 SNP-lipid additive associations for other lipid traits by growth class . . . 177
E.6 Additive associations between risk scores and lipid traits . . . 184
E.7 SITAR GXE interaction analyses for risk scores and lipid traits . . . 185
APPENDIX F: BACKGROUND FOR POWER CALCULATIONS . . . 186
APPENDIX G: SCRIPTS FOR ANALYSES . . . 187
LIST OF TABLES
2.1 Recommended cut points for lipid and lipoprotein levels in young adults . . . 12
2.2 Postnatal growth studies and association with later plasma lipid levels. . . 38
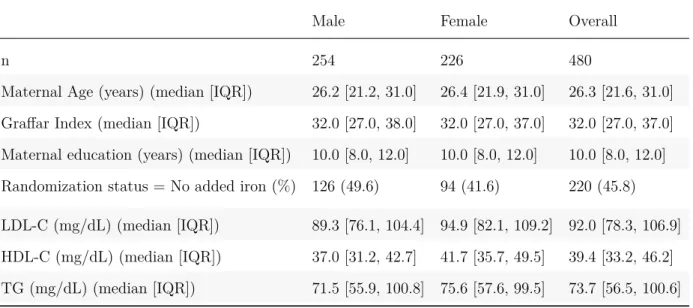
4.1 (MS1: Table 1) Descriptive statistics . . . 85
4.2 (MS1: Table 2) Sociodemographic predictors and association with weight SITAR growth parametersa,b, stratified by sex of child in the
Santiago Longitudinal Study, 1991-1996 . . . 86
4.3 (MS1: Table 3) Sociodemographic predictors and association with length SITAR growth parametersa,b, stratified by sex of child in the
Santiago Longitudinal Study, 1991-1996 . . . 87
4.4 (MS1 Table 4) Sociodemographic predictors and association with weight-for-length (WFL) SITAR growth parametersa,b, stratified by
sex of child in the Santiago Longitudinal Study, 1991-1996 . . . 88
5.1 (MS2: Table 1) Descriptive statistics, median [IQR] . . . 106
5.2 (MS2: Table 2) Coefficients for association between SITAR growth parameter (se) and lipid outcome by sex of child, type of trajectory,
and adjustment status . . . 107
5.3 (MS2: Table 3) Parameters for the growth classes . . . 108
5.4 (MS2: Table 4) Pairwise growth class differences in lipid distal outcome. . . 109
5.5 (MS2: Table 5): Mean distal lipid value by growth class and type of
growth measure . . . 110
5.6 (MS2: Table 6) Counts of people in each latent class, n . . . 112
6.1 (MS3: Table 1) Descriptive statistics for sample stratified by sex of child. . . 129
6.2 (MS3: Table 2) Comparison of candidate SNP-lipid associations from
literature and in the SLS sample. . . 130
6.3 (MS3: Table 3) Parameters for the growth classes . . . 131
6.4 (MS3: Table 4) Counts of people in each latent class, n . . . 132
6.5 (MS3: Table 5) Latent growth class pairwise differences (95% CI) in coefficient of association between distal lipid outcome (mg/dL) and
candidate SNP at nominal significance levels. . . 133
6.6 (MS3: Table 6) Coefficient for association between lipid distal outcome and SNPs for SNPs with pairwise differences across growth class groups
meeting a nominal significance at an alpha level of 0.05. . . 134
A.1 Description of items used for Graffar index . . . 148
B.1 Nonlinear mixed effects model fit evaluation: BIC for all evaluated models . . . 150
B.2 Model variance and covariance for random effects of all evaluated models . . . 151
C.1 LGMM fit statistics by type of outcome, pooled sample . . . 154
D.1 List of genetic variants used for the trait specific genetic risk scores. . . 155
E.1 Latent growth class pairwise differences in coefficient of association
between selected distal lipid outcome (mg/dL) and candidate SNPs . . . 165
E.2 Latent growth class pairwise differences in coefficient of association be-tween other, non-primary, distal lipid outcome (mg/dL) and candidate
SNPs . . . 167
E.3 Latent growth class pairwise differences in coefficient of association
between distal lipid outcome (mg/dL) and lipid-specific risk scores . . . 174
E.4 Additive association between SNP and distal outcome by growth class,
sex of child, adjusted status, selected SNP and lipid outcome . . . 175
E.5 Additive association between SNP and distal outcome by growth class,
sex of child, adjusted status, other, non-primary, SNP and lipid outcome . . . 177
E.6 Additive association between risk scores and distal lipid traits by
growth class, sex of child, adjusted status, risk scores and lipid outcome . . . 184
E.7 Gene-environment coefficients for models including lipid outcomes with risk scores and SITAR growth parameters as the genetic and
LIST OF FIGURES
2.1 Directed Acyclic Diagram (DAG) for research topic. . . 8
2.2 Lipoprotein classes (Jameson 2016). . . 10
2.3 Relationship between lipoproteins and the arterial wall (Varbo et al. 2014). . . . 11
2.4 Lipid patterns by age and racial/ethnic group in United States sample, 2005-2010 (Dai et al. 2014). . . 18
2.5 Diagram of postnatal overfeeding model (Habbout et al. 2013). . . 35
2.6 Epigenetics as a mechanism for disease (Ladd Acosta and Fallin 2016) . . . 43
2.7 Directed Acyclic Diagram (DAG) for aim 3. . . 51
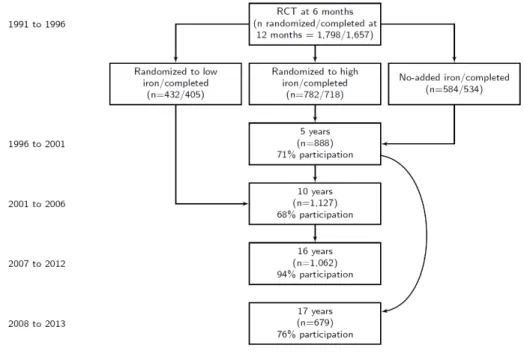
3.1 Flow chart of sample size for Santiago Longitudinal Cohort Study. . . 60
3.2 Type of change in random effects (α, β, γ) relative to the sample mean trajectory in weight growth curve trajectories following a shape invariant model (SIM). . . 64
3.3 Diagram of latent growth mixture model (LGMM) of infant growth. . . 66
5.1 (MS2: Figure 1) Growth trajectories by type of trajectory, sex of child and adjustment status. . . 113
5.2 (MS2: Figure 2) Plot of mean lipid values by class and type of distal outcome by type of trajectory, lipid outcome, sex of child, and adjustment status . . . 114
6.1 (MS3: Figure 1) Representation of structural equation model for adjusted analysis . . . 135
6.2 (MS3: Figure 2) Growth trajectories by type of trajectory, sex of child and adjustment status. . . 136
6.3 (MS3: Figure 3) Plot of association between infant weight SITAR growth velocity parameter and LDL-C levels by rs11076175 allele frequency. . . 137
6.4 (MS3: Figure 4) Histogram for slope differences between group with 2 alleles and 0 alleles of SNPs used in lipid-specific risk scores. (Slope represents association between SITAR growth parameters and lipid traits) . . . 138
6.5 (MS3: Figure 5) Histogram for slope differences between group with 1 allele and 0 alleles of SNPs used in lipid-specific risk scores. (Slope
represents association between SITAR growth parameters and lipid traits) . . . 139
7.1 Directed Acyclic Diagram (DAG) to describe paths composing total effect. . . . 145
LIST OF ABBREVIATIONS
ASCVD Atherosclerotic Cardiovascular Disease
DOHAD Developmental Origins Of Health And Disease
GWAS Genome-Wide Association Studies
GXE Genotype X Environment
HDL-C High Density Lipoprotein Cholesterol
HL Hispanic/Latino
LDL-C Low Density Lipoprotein Cholesterol
NON-HDL-C Non-High Density Lipoprotein Cholesterol
PRS Polygenic Risk Score
SITAR SuperImposition By Translation And Rotation
SLS Santiago Longitudinal Study
SNP Single Nucleotide Polymorphism
TC Total Cholesterol
TG Triglycerides
WFL Weight-for-length
CHAPTER 1: SPECIFIC AIMS
1.1
Specific Aims
Atherosclerotic Cardiovascular Disease (ASCVD) (Bays et al. 2016) is rare in childhood,
but risk factors for ASCVD are not. The prevalence of adverse levels of High Density
Lipoprotein Cholesterol (HDL-C) (<40 mg/dL), Low Density Lipoprotein Cholesterol
(LDL-C) (≥ 130 mg/dL) and triglycerides (TG) (≥ 130 mg/dL) exceeded 5% in United States
(U.S.) children from 2007 to 2010 (Kit et al. 2012; Kit et al. 2015; Magnussen, Smith, and
Juonala 2013). Importantly, such dyslipidemia in childhood tracks into later life (Celermajer
and Ayer 2006; Kallio et al. 1993), predisposing children to a cumulative risk burden and
subsequent ASCVD events in adulthood.
Strong associations exist between infant growth trajectories and the development of
ASCVD in adulthood, supporting the Developmental Origins of Health and Disease concept
(Hanson and Gluckman 2014; Barker and Osmond 1986; Osmond et al. 1993; Barker et al.
1989; Gahagan, Uauy, and Roseboom 2012; Gluckman et al. 2009). Few empirical studies
have captured the relationship between infant growth trajectories and risk factors for ASCVD
such as dyslipidemia, and of seven recent studies on this topic (Corvalan et al. 2009; Ekelund
et al. 2007; Howe et al. 2010; Kajantie et al. 2008; leunissen_timing_2009-1; Oostvogels et al.
2014; Tzoulaki et al. 2010), only one focuses on ancestrally diverse populations (Corvalan et
al. 2009). Furthermore, these characterizations of growth in infancy do not leverage advanced
methodological approaches in assessing growth. The lack of ancestral diversity in samples and
limited characterization of growth trajectories presents a knowledge gap and an important
contemporary infancy cohort of Hispanic/Latino (HL) origin – the Santiago Longitudinal
Study (SLS) (Lozoff et al. 2003; Gahagan et al. 2009). Three specific aims follow:
1.1.1 Aim 1
Characterize individual infant growth trajectories from birth to five months and identify
sociodemographic predictors of such growth in a Chilean infancy cohort.
1.1.1.1 Aim 1.1
Characterize infant growth trajectories with nonlinear mixed effects models (Cole,
Donaldson, and Ben-Shlomo 2010), which measure individual shifts relative to the population
average curve in: (a) size (above or below on the outcome scale), (b) tempo (to the right
or left on the age scale), and (c) velocity (steep or shallow slope). Assess the association
between postnatal growth characteristics and sociodemographic predictors of postnatal growth
including a socioeconomic index and maternal education.
Note: Subsequent references to “growth trajectory” or “postnatal growth” as nested
within the hypotheses refer to change in weight-for-length (g/cm), weight (kg) and length
(cm) as a group.
1.1.1.1.1 Hypothesis 1a
Positive associations will exist between length growth and favorable sociodemographic
position. Inverse associations will exist between weight and weight-for-length growth favorable
sociodemographic position.
1.1.1.2 Aim 1.2
Determine presence of child growth trajectory latent classes with latent growth mixture
models (LGMM).
1.1.1.2.1 Hypothesis 1b
Several classes of growth trajectories exist including one with a steeper weight change
than other groups.
1.1.2 Aim 2
Examine the association between infant growth trajectory characteristics and lipid levels
at 17 years of age.
1.1.2.1 Hypothesis 2
Infants with faster growth are at greater risk of adverse lipid levels in adolescence than
children with slower growth.
1.1.3 Aim 3
Assess gene-environment interaction between growth trajectory characteristics and
1.1.3.1 Hypothesis 3
Infant growth influences the strength of association between selected genetic variants
and adverse lipid levels for children. For example, in the context of extreme and less favorable
growth characteristics, a stronger association will exist between risk alleles and adverse levels
of LDL-C.
CHAPTER 2: BACKGROUND AND SIGNIFICANCE
2.1
Overview
This chapter contains three distinct sections: 1) a background for the outcome measures,
lipids and dyslipidemia, which are characterized in the context of an age range from birth to
eighteen years; 2) a motivation to examine associations between postnatal growth and chronic
disease risk factors in adolescence; 3) an outline of analytic issues that may be problematic
given the proposed hypotheses including choice of growth model, parameterization of
gene-environment interaction and polygenic risk score calculation.
2.1.1 Dyslipidemia in children
Lipids and lipoproteins are the primary focus and a continuous outcome measure in the
three aims. Characterizing these measures and how they contribute to ASCVD is necessary
prior to defining its relationship as an outcome in a causal framework as follows. Although
lipids constitute a continuous measure in the presented analyses, a review of a binary lipid
indicator, dyslipidemia, is in order as it is another commonly used measure with valuable
descriptive information.
Dyslipidemia definitions vary across many biologic and demographic domains. Childhood
is one example in which the definition of dyslipidemia varies across time periods. Other
domains include gender, racial, and ethnic groups. Furthermore, tracking of lipid levels to
Polygenic attributes of dyslipidemia will round out this background section characterizing
dyslipidemia in children. In adults, several large genetic consortia (“Global Lipids Genetics
Consortium (GLGC). Kathiresan Lab” 2014) have identified hundreds of loci influencing
plasma lipid levels in humans. In particular, these studies have produced candidate genetic
loci having a plausible function in lipid metabolism (Willer et al. 2013). Although research
is still ongoing, these genetic variants do appear to extend to populations of children (Shen
et al. 2013; Breitling et al. 2015; Tikkanen et al. 2011; Buscot et al. 2016).
2.1.2 Evidence for an association between postnatal growth and dyslipidemia later in life
The second section motivates the formulation of the hypotheses postulating an association
between postnatal growth and lipids. Postnatal life presents considerable potential for
intervention that can impact the health trajectory extending far past the immediate period.
With this potential, there have been a variety of animal and human studies in the past ten
years investigating the impact of postnatal growth on ASCVD risk factors later in life. These
studies follow the Developmental Origins of Health and Disease (DOHaD) paradigm, and
they offer evidence that abnormal growth early in development can affect cardiovascular risk
factors, including lipid levels, later in the life course.
Following a description of the current literature in both animal models and humans,
hypothesized biological pathways stemming from current research will be reviewed including
areas spanning liver function, gene expression timing and epigenetic mechanisms. Finally, a
discussion of factors that affect postnatal growth form the last part of this section, important
areas to consider as potential confounders when examining the association between postnatal
growth and dyslipidemia in adolescence.
2.1.3 Analytic Issues
The last section includes a discussion and resolution of several analytic issues that could
be problematic when specifying analyses that address the three hypotheses. Some of those
issues include: 1) generalizability of growth and dyslipidemia across source populations, 2)
choice of statistical methods to characterize growth in children, 3) accurate ways to detect
gene-environment interactions, and finally 4) formulation of a Polygenic Risk Score (PRS). In
addressing these issues certain points emerge including the importance in selecting methods
that best fit the ample data on hand during the postnatal period as well as best matching
the target population of a HL population.
2.1.4 Summary
This chapter includes characterization of 1) the outcome measure, 2) evidence supporting
the role of postnatal growth as an exposure, and 3) analytic issues presenting themselves
given the choice of exposure and outcome. As will be described next, there is ample evidence
motivating investigation of the link between a postnatal exposure and a chronic disease risk
factor such as unfavorable lipid levels in an understudied population. Furthermore, addressing
these three broad areas will provide a basis upon which relevant analyses can be designed
that support further investigation of causal effects in a HL sample.
2.1.5 Directed Acyclic Graph (DAG)
The following figure provides a conceptual diagram of the causal effect present in
the second hypothesis from the second aim of this dissertation proposal. In this diagram
dyslipidemia represents the terminal endpoint and all relevant confounders to consider when
Figure 2.1: Directed Acyclic Diagram (DAG) for research topic.
infant growth epigenotype breastfeeding
birth weight
child growth
genetic factors
adiposity, early childhood
dyslipidemia, adolesence exercise
diet
smoking SES, child
male
lipid risk allele SES
ancestry
background and significance that follow will provide support for the relationships in this
directed acyclic diagram (Fig. 2.1).
2.2
Dyslipidemia in children
Children may be free of ASCVD risk factors, but they certainly are not immune to
their development and are prime candidates for a primordial prevention framework. ASCVD
prevention efforts targeting specific risk factors (Foraker, Olivo-Marston, and Allen 2012;
Pearson 2007; Grundy et al. 1998), are featured as a cornerstone of ideal cardiovascular
health as outlined in the 2020 American Heart Association strategic plan (Lloyd-Jones et
al. 2010). Lipid measures are in all the aims, and it is one such modifiable risk factor in a
prevention framework that can accelerate the atherosclerotic process in children (Daniels,
Pratt, and Hayman 2011). ASCVD risk factors in children may be stronger predictors of
atherosclerosis than measurements at time of examination in adulthood (Gidding 2006)
making this a deserving window of time for additional research.
2.2.1 Stages of development in childhood
To clarify definitions used throughout this section, any following references to “childhood”
is meant as an informal characterization of all ages from birth to age 18 years. Young
adults would be considered ages 18-21 years (“Ages & Stages. HealthyChildren.org” 2017).
Guidelines from Healthy People 2020 initiative define early childhood from birth to eight
years, middle childhood from ages 6 to 12 years and adolescence from ten to nineteen years
(“Early and Middle Childhood Healthy People 2020” 2017). Adolescent stages in general
include early (11-14 years), middle (15-17) and late (18-22) groups (“Stages of Adolescence.
HealthyChildren.org” 2017). No universally accepted definition of childhood growth stages
exists, but these labels will be used to define age groups in the life course.
2.2.2 Lipoproteins
Lipoproteins are spherical shaped particles configured with hydrophilic and hydrophobic
lipids – fats. Adverse levels of lipoproteins function as a primary causal factor in atherogenesis
ending in cardiovascular disease. The primary role of lipoproteins is to transport hydrophilic
triglycerides and cholesterol esters through the blood from the liver or gut to tissues throughout
the body. The five basic classes of lipoproteins are categorized by their size, as can be seen
in figures figure 2.2 and 2.3. These classes include: 1) chylomicrons, 2) very low-density
lipoprotein, 3) intermediate density lipoprotein, LDL-C, and 5) HDL-C (Jameson 2016).
Subsections below will elaborate on two of these lipoprotein classes including LDL-C and
Figure 2.2: Lipoprotein classes (Jameson 2016).
Adverse lipid levels characterize dyslipidemia, and they signal higher risk of atherosclerosis
that can be modified with causal factors including lifestyle choices. A conceptual diagram
of the relationships judged relevant to the hypothesized disease process is included in Fig.
2.1. This disease in childhood negatively influences the path of atherosclerosis (Gidding 2006;
Daniels 2015), and it carries the potential for sustained exposure to atherosclerosis making it
an important area for intervention.
Dyslipidemia differs between children and adults as assessed by lipid thresholds. To
assess dyslipidemia, four separate outcomes from a standard lipid profile are commonly used:
TC, TG, LDL-C, and HDL-C. Dyslipidemia occurs when at least one of the “lipid, lipoprotein,
or apolipoprotein levels are abnormal.” (Peter O. Kwiterovich 2008b). A brief description
of each of these lipoproteins follows, and figure 2.3 (Varbo, Benn, and Nordestgaard 2014)
offers a visual description of their role in atherosclerosis in the arterial wall.
Figure 2.3: Relationship between lipoproteins and the arterial wall (Varbo et al. 2014).
Thresholds for each of these four factors exist, beyond which there is a higher risk of
“initiation and progression of atherosclerotic lesions. . . ” (Expert Panel 2011). The standard
for dyslipidemia in children started with the 1992 National Cholesterol Education Program
report (“National Cholesterol Education Program (NCEP): Highlights of the Report of the
Expert Panel on Blood Cholesterol Levels in Children and Adolescents” 1992) and most
recently ended with the 2011 guidelines from the “Expert Panel on Integrated Guidelines
for Cardiovascular Health and Risk Reduction in Children and Adolescents” (Expert Panel
2011). Values that are considered above or below acceptable thresholds are characterized in
table 2.1, as reproduced from an expert panel in 2011 (Expert Panel 2011). These values
Table 2.1: Recommended cut points for lipid and lipoprotein levels in young adults (adapted from table 9-1 in the 2011 NHLBI guidelines for lipid management in children and adolescents)
Category Low, mg/dL Acceptable, mg/dL Borderline-High, mg/dL High, mg/dL
TC <170 170-199 ≥ 200
LDL <110 110-129 ≥ 130
Non-HDL <120 120-144 ≥ 145
Apolipoprotein B <90 90-109 ≥ 110
Triglycerides
0-9 y <75 75-99 ≥ 100
10-19 y <90 90-129 ≥ 130
HDL cholesterol <40 >45 40-45
Apolipoprotein A-1 <115 >120 115-120
Dyslipidemia in children is prevalent and widespread across countries with over 20% of
children ages 6 to 19 in the United States from 2011 to 2014 having at least one abnormal
lipid measure (Nguyen, Kit, and Carroll 2015; Benjamin et al. 2017). The SLS Chilean cohort
of adolescents aged 17 years also supports the evidence that HL groups carry a larger burden
of ASCVD risk. 79% of this group had at least one abnormal measure of cardiometabolic risk
including adverse levels of TG, HDL-C, blood pressure and fasting plasma glucose (Burrows
et al. 2016). In the sections that follow, each measure from a standard lipid profile including
LDL-C, HDL-C, TG, and TG that are commonly used to assess dyslipidemia are discussed
across various racial and ethnic groups.
2.2.2.1 Quality control
It is also notable that these lipid and lipoprotein measures can vary given different
measurement techniques across different countries or regions constituting a quality control
problem. In turn, these variations, which constitute bias, may be the source of differences in
risk factor means and not any particular country-level difference. A 2004 report from the
general accounting office (GAO) of the United States (Office 1995) indicates that laboratory
cholesterol measurements have “improved from 25 to 6 percent error” in precision following
reference methods developed through the Centers for Disease Control. The same report notes
that interlaboratory precision was 5.5 to 7.2 percent in 1990.
The Centers for Disease Control (CDC) offers a standardization protocol through the
Cholesterol Reference Method Laboratory Network (CRMLN) (“CDC - Laboratory Standards
- LSP” 2017), which provides standards to labs across the world. In the past, this group had
collaborated with the European group responsible for the quality control in the MONICA
study (Project 2002), WHO Regional Lipid Reference Centre (WHO-RLRC), now defunct.
Standardization across different population sources is critical (Tolonen 2004), and it is the
assumption that laboratory quality control measures similar to what is provided by the
CDC are followed in the sections on lipids that follow. Current CDC protocol indicates that
laboratories following their protocol have bias and coefficient of variation for total cholesterol
less than or equal to 3 percent; HDL-C measures require bias ≤4 percent and coefficient of
variation ≤5 percent; LDL-C measures require bias and coefficient of variation ≤ 4 percent.
Lastly, lack of standardization or not following similar standards may result in biased and/or
less accurate lipid and lipoprotein measures.
Of note, the MONICA study, in their external quality control estimates, examined
total cholesterol in many different countries and continents. Their standardization efforts
were successful in most countries for LDL-C and TC (Tunstall-Pedoe and World Health
Organization 2003), but less so for HDL-C up until the 1990s (Project 2002, Tolonen (2004)).
Total cholesterol measurements can be quite precise, but accuracy is an issue (Cooper et al.
2.2.2.2 Triglycerides (TG)
TG provide unique information regarding cardiovascular disease risk, yet the causal
role for TG is still a matter of current research in cardiovascular disease (Miller et al. 2011;
Nordestgaard and Varbo 2014). For children, there is evidence that triglyceride levels are
an independent biomarker for subsequent cardiovascular disease (Morrison et al. 2009).
A triglyceride measure at or above 150 mg/dL is considered abnormally high for children
and corresponds to a percentile from a designated standard. For example, the value for
triglycerides in table 2.1 corresponds to the 90th percentile for people ages 20-24 in the Lipid
Research Clinics Prevalence Study (Heiss et al. 1980).
Typically, TG measures are collected after fasting given their higher postprandial
variability relative to HDL-C, and they are more difficult to collect as well as being less
frequently done (Kit et al. 2015). Interestingly, recent studies show that non-fasting levels
are considered adequate for screening purposes making the fasting efforts less important
(Nordestgaard and Varbo 2014). However, in the United States fasting levels are still
recommended and therefore they are not included in as many analyses as those with TC or
HDL-C, in which fasting is not required.
2.2.2.3 Low density lipoprotein cholesterol (LDL-C)
LDL-C levels are considered one of the strongest predictors of cardiovascular disease
as well as playing a causal role in atherosclerosis fitting into the “cholesterol hypothesis”
(Catapano and Ference 2015; Linton et al. 2000; Domanski et al. 2011). LDL-C values can be
calculated from a common lipid profile with the most frequent method being the Friedewald
equation: [LDL-cholesterol] = [total cholesterol] – [HDL-cholesterol] – [triglycerides/5]. This
indirect measure has not been without controversy (Martin et al. 2013). The Friedewald
equation was developed in a sample less than 500 people more than 40 years ago, and
assumptions regarding the ratio of TG:very low-density lipoprotein equal to 5 may be
inaccurate with the amount of variability. One alternative, proposed by Martin et al. (Martin
et al. 2013) is to use an adjustable factor for the TG:very low-density lipoprotein ratio.
However, the indirectly calculated values are very close to the directly measured LDL-C
values (Mora et al. 2009; Tanno et al. 2010).
2.2.2.4 High density lipoprotein cholesterol (HDL-C)
HDL-C is an interesting component of dyslipidemia in that it is a well established
biomarker for cardiovascular risk, but its causal role in atherosclerosis is not yet clear (Rader
and Hovingh 2014). The evolution of therapeutic treatment for LDL-C versus HDL-C levels is
one salient example representing the paucity of evidence supporting HDL-C as a causal factor.
No treatment has been found in which raising HDL-C leads to improved cardiovascular disease
outcomes, unlike the case for LDL-C and statin use. In turn, the “cholesterol hypothesis” has
thus far failed to apply to HDL-C. A plausible causal explanation, named the “HDL function”
hypothesis (Rader and Hovingh 2014), has shifted attention from the amount to the function
of HDL-C. Following this hypothesis implies little is to be gained interpreting amounts of
HDL-C in the bloodstream when evaluating HDL-C as a causal factor in atherosclerosis.
Unlike LDL-C, direct measurement of HDL-C is common and occurs via an assay. For
example, NHANES has used the direct immunoassay method since 2003 (Kit et al. 2015).
Low HDL-C is considered a risk factor with a threshold of 40 mg/dL. Contrary to TG and
LDL-C, favorable levels for the U.S. youth population have decreased over time (Kit et al.
2.2.2.5 Total cholesterol (TC)
Total cholesterol is a measure from a commonly conducted blood test and includes the
total count of all cholesterol present in the blood sample, a combination of LDL-C, HDL-C
and VLDL-C (Birtcher 2004). Average levels among U.S. children ages 6 to 19 years have
declined, with the average TC (mg/dL) levels (95% CI) moving from 165 (164, 167) in
1988-1994 to 160 (158, 161) in 2007-2010. Consistent with the decline over time reported in
the previous study, the decline continues among children ages 6-19 years in the United States
between 2011-2014 with 7.4% having high TC (Nguyen, Kit, and Carroll 2015).
2.2.2.6 TG/HDL-C ratio
One measure that has been classified as a marker for insulin resistance is the ratio
of HDL-C to TG. This ratio has been shown to be a valid marker in a diverse range of
racial/ethnic groups such as obese American youth from a range of ethnic/racial backgrounds
(Giannini et al. 2011), indigenous Argentinian children (Hirschler et al. 2015), Chinese adults
with newly diagnosed diabetes (Ren et al. 2016), and obese/overweight Italian children (Di
Bonito et al. 2015). Furthermore, in the study of Italian children, an additional positive
association was found between carotid intima-media thickness (cIMT) and concentric left
ventricular hypertrophy (cLVH) and the HDL-C to TG ratio. Despite the replications
across samples, one recent study in another group of obese and overweight children in rural
Appalachia, United States, indicated no advantage of a TG/HDL-C marker to identify insulin
resistance (Bridges et al. 2016). A caveat for this relationship is that this association between
TG/HDL-C ratio and insulin resistance and organ damage has been mostly in subsets of
general populations such as obese youth, whose lipid profile is characterized by high TG/low
HDL-C (Pires, Sena, and Seiça 2016). Further research in other subgroups is needed to
confirm the utility of this marker for insulin resistance normal weight groups.
2.2.2.7 non-High Density Lipoprotein Cholesterol (non-HDL-C)
Also associated with the TG/HDL-C ratio, non-HDL-C is another measure incorporating
a composite of lipid measures. Calculation of non-HDL-C is simply equal to TC - HDL-C.
Unlike a measure with directly measured TG, non-HDL-C does not require any fasting to
obtain meaningful estimates and is a stronger marker for coronary artery disease than LDL-C
alone (Pires, Sena, and Seiça 2016; McPherson 2013). An advantage of this measures is the
inclusion of “triglyceride-rich lipoproteins whereas LDL cholesterol does not.” (Helgadottir et
al. 2016) This particular measure has been shown in Mendelian randomization studies to
have an additional association beyond that of LDL with coronary artery disease (CAD) risk
whereas there was no effect when examining TG and coronary artery disease (Helgadottir
et al. 2016). Remnant cholesterol, with a strong association with coronary artery disease
(Varbo, Benn, and Nordestgaard 2014; McPherson 2013) may figure more prominently in
non-HDL-C and support the strength of association with coronary artery disease.
2.2.3 Age patterns in lipid level variation
Average lipid levels in U.S. children follow a distinct pattern from age 2 to 18 years.
The National Health and Examination Study (NHANES) is one of the few studies allowing
examination of lipid levels in children across a broad age range. In the United States mean
non-HDL-C levels remain between 100 and 120 mg/dL between 6 and 18 years of age between
2005-2010 for three racial/ethnic groups: Non-Hispanic Whites, Non-Hispanic Blacks and
Mexican-Americans. Within that range the levels rise from age 6 years peaking at age 10
then decline in early teens to rise again (Fig. 2.4) (Dai et al. 2014). In the same NHANES
sample with some overlap in sampling years, this prevalence pattern across age occurs when
examining separate measures of nonfasting LDL-C and TG, TC and HDL-C (Skinner et al.
Figure 2.4: Lipid patterns by age and racial/ethnic group in United States sample, 2005-2010 (Dai et al. 2014).
Notably, the pattern described above does not apply to Mexican-American females
showing little change in average levels from 6 to 12 years. In a study of more than 38,000
Brazilian adolescents aged 12-14 and 15-17 years from 2013-2014 (Faria Neto et al. 2016),
evidence of gender differences also occurs. Age was positively associated with LDL-C levels
in males but not in females, which is similar to the NHANES pattern for Mexican-American
females mentioned above. These published studies provide clues for lipid variation across
different ages in childhood in different HL samples, which may not match the average United
States patterns for children. Given these fluctuations in lipid levels across childhood, universal
lipid level screening is now recommended between ages 9 to 11 given a decline in cholesterol
levels during adolescence (Peter O. Kwiterovich 2008b; Expert Panel 2011). The next age
at which screening is recommended is 17 to 21 years. Despite these recommendations no
more than 11 percent of U.S. children in a sample exceeding 200,000 were screened in 2012
(Zachariah et al. 2015).
2.2.4 Tracking into adulthood
Once a child achieves an adverse lipid level leading to a diagnosis of dyslipidemia, the
chances are high that this child will have dyslipidemia as an adult (Kallio et al. 1993;
Labarthe, Eissa, and Varas 1991). Thus far the four largest cohorts with information to
provide estimates tracking lipids from childhood to adulthood are: 1) the Young Finns study,
2) the American Bogalusa study, 3) the Australian Childhood Determinants of Adult Health
study, and 4) the Muscatine study (Dwyer et al. 2013). These studies have built strong
evidence over time that adverse lipid levels in childhood are associated with various measures
of subclinical atherosclerosis in adulthood such as carotid intima-media thickness (IMT) and
coronary artery calcification (CAC) (Hartiala et al. 2012; Juonala et al. 2008b; Juonala et al.
2008a; Frontini et al. 2008; S. Li et al. 2007; Raitakari et al. 2003; Li et al. 2003; Davis et al.
2001; Mahoney et al. 1996).
One example representative of findings from these four studies is LDL-C levels in Finnish
adolescents predict Coronary Artery Calcification in adults aged 40 to 46 years independent
of LDL-C changes between the two age periods (Hartiala et al. 2012). For a one standard
deviation increase in adolescent LDL-C measure (mg/dL) the odds ratio for Coronary Artery
the development of adverse lifestyle changes between adolescence and measures taken during
adulthood (Magnussen et al. 2011). If individuals developed higher adiposity and and
smoking behaviors after the adolescent measures these people were found to maintain adverse
LDL-C levels in adulthood. This evidence signals the importance of intermediary lifestyle
factors related to overweight and obesity along with smoking in maintaining dyslipidemia.
The most recently published study outlining risk of atherosclerosis in adults after exposure
to abnormal lipid levels in childhood is from Finland (Juhola et al. 2011). In this study more
than 2,200 boys and girls followed for more than 27 years have a correlation of 0.43 to 0.56
(p < 0.0001) between childhood and adulthood cholesterol levels. Also, the ages of 12 to 18
years was considered as having the best sensitivity and specificity for abnormal LDL-C and
HDL-C levels during adulthood, ranging from 75% to 95% and 20% to 57%, respectively. The
evidence supports a strong link between exposure to adverse lipid levels during adolescence
and continuing link to this factor as an adult.
Research on tracking of abnormal lipid values is limited in racial diversity with the
majority of study populations being of European descent. In the Bogalusa study in which over
25% of the sample are black, there were racial differences discovered for a linear association
between childhood lipid levels and carotid intima–media thickness (IMT) in adulthood (S.
Li et al. 2007). LDL-C was identified as being linearly associated across the lifecourse in
regression analyses for both black and white females, but restricted to whites for males. Also,
triglycerides appeared to predict IMT for white males only. Given these variability in these
findings it is important to note that associations with lipids found in one population of
children may not extend to other populations, emphasizing the value in studying associations
between life course exposures and lipids in different samples such as the proposed Chilean
study sample identified for this project.
2.2.5 Gender differences
In terms of lipid metabolism, adult males and females are different given their unique
hormonal characteristics (Varlamov, Bethea, and Roberts 2015). However, observational
data for children does not support this difference, and gender comparisons in nationally
representative studies indicate little difference in prevalence of childhood dyslipidemia. In
the most recent evaluation of NHANES U.S. data from 2011-2012 for children aged 8 to
17 years, the prevalence of dyslipidemia (95% CI) was 21.0% (148.8, 28.5) and 19.3% (16.2,
22.8) for girls and boys, respectively (Kit et al. 2015). Similarly, the values for non-HDL-C,
often considered a good indicator in childhood for later preclinical atherosclerotic change
(Frontini et al. 2008), is similar in U.S. children ages 6 to 19 years across three different
time periods: 1988-1994, 1999-2002, and 2007-2010 (Kit et al. 2012). Similarities during
childhood remain across gender in countries outside of the U.S. In the proposed study sample
of Chilean children the mean HDL-C levels (SD) mg/dL for males and females aged 17 years
was 38.0 (10.1) and 42.5 (10.7), respectively (Burrows et al. 2016). Mean TG (mg/dL) were
88.4 (52.4) and 88.2 (47.6) for males and females, respectively.
Dyslipidemia prevalence estimates are similar in male and female children, but there
appears to be effect modification occurring by gender when examining the association between
dyslipidemia and obesity. With obesity being a strong comorbidity with dyslipidemia outside
of primary genetic causes in children, presence of this effect modification is an important
reason to stratify the analyses by gender. Although little is published on this topic, a recent
study of 161 Portuguese children indicates that males had stronger associations between
2.2.6 Primary genetic causes of dyslipidemia
2.2.6.1 Monogenic lipid disorders
Monogenic lipid disorders are distinguished by lipid levels that cannot be altered by
lifestyle choices and are caused by highly penetrant mutations in a small number of genes –
as low as one. Familial hypercholesterolemia (FH) is an autosomal dominant lipid disorder
characterized by very high LDL levels. Marked by disruptions in the lipid metabolic pathway,
these primary disorders are also rare. FH occurs in about 1 in 500 children in the United
States population (Peter O. Kwiterovich 2008a; Peterson and McBride 2012) and “50% of
untreated male heterozygotes and 25% of untreated female heterozygotes will develop CAD
by 50 years of age.” (Peter O. Kwiterovich 2008a) Another example of an inherited disorder
is familial combined hyperlipidemia (FCHL), a disorder characterized by overproduction of
very low density lipoproteins (VLDL). FCHL is considered to be the most common genetic
dyslipidemia in people of European ancestry (Brouwers et al. 2012).
Given the rarity of these genetic disorders in the populations we do not expect to find
many, if anyone, with this disease. However, it is worthwhile further investigating any outliers
in the analyses as a rare condition such as this may serve as a confounder for infant growth
and dyslipidemia outcomes (Basso 2006).
2.2.7 Secondary risk factors for dyslipidemia
Several high-level risk factors worth noting in children include severe hypertension
exceeding the 99th percentile, cigarette smoking, oral contraceptive use, type 1 and type 2
diabetes mellitis (DM), and BMI exceeding the 97th percentile (Expert Panel 2011; Peter O.
Kwiterovich 2008b). Type I and 2 DM could be potential confounders if these factors were on
a pathway to dyslipidemia during adolescence. One such pathway could be a genetic variant
associated with both T1DM or T2DM and infant growth. However, no such factors have been
identified in the literature. Also, childhood weight following infant growth can be considered
a mediator (Fig. 2.1) and as such should not be considered in the set of adjustment factors.
Although these conditions or risk factors can lead to dyslipidemia in adolescence they are not
considered confounders because of lack of association with prenatal growth, and as a result
will not be considered in the analyses.
Lastly, other secondary special high risk conditions include chronic kidney disease,
children with heart transplants and Kawasaki disease (Expert Panel 2011). The rarity of
these conditions eliminates these factors from further consideration.
2.2.8 Environmental factors for infants
2.2.8.1 Feeding
During the first four to six months of infancy, breastfeeding, formula feeding or some
combination thereof is the primary food source for infants. There is potential for the type
of feeding to be associated with both dyslipidemia in adolescence and weight change, thus
creating a confounding factor between the outcome and exposure of interest in this proposal.
Many studies, exceeding 30 as of 2012 (Kwiterovich 2012, 153; Koletzko 2009, 41; Hayosh
et al. 2015; Wong et al. 2018; Owen et al. 2008; Gishti et al. 2014), present inconclusive
evidence supporting an association between infant feeding and lipid levels once a child achieves
adolescence. Meta-analyses present evidence supporting a small reduction in total and LDL
cholesterol in adulthood, but no biological basis for a programming effect for adult lipid
profiles exists (Demmers 2005).
A recent study examining “lipidomic profiles” indicates there are differences according
relying on metabolic phenotyping previously unavailable in research alongside a cohort
starting after 2000, further supports the prior findings of no persistence of breastfeeding
association with lipid profiles later in age (Prentice et al. 2015). Interestingly, there were
specific lipids detected at three months found to predict weight gain at 12 months. Despite
the association between earlier lipid profile and growth, a connection between breastfeeding
as an environmental exposure in childhood and dyslipidemia in adolescence is equivocal,
reducing its potential as a confounder between infant growth and later dyslipidemia.
2.2.9 Racial and ethnic disparities
Racial and ethnic disparities in dyslipidemia exist and research on this topic is growing to
counter a knowledge gap. Relative to the non-Hispanic White population, the HL population
on average has a higher prevalence of dyslipidemia. Addressing these disparities is important
because higher cardiovascular disease burden is tightly linked with a higher prevalence of risk
factors including dyslipidemia.
Authors investigating subtypes of dyslipidemia patterns across major racial/ethnic groups
in the United States (Frank et al. 2014), found that the adult HL population is characterized
by a pattern of raised TG and lower HDL-C, increasing the risk of atherosclerosis. The
raised TG levels in HL groups has been observed elsewhere, including a systematic review
of literature representing North American countries, including Mexico, from 2000 to 2014
(Gasevic, Ross, and Lear 2015). This particular literature review determined no difference
in low HDL levels between the HL and non-Hispanic White groups, but this finding is
contradicted in other studies, including ones using NHANES data.
National Health and Nutrition Examination Survey (NHANES) is one of the most
commonly used data sources to document health disparities on a national level (Pu et al.
2016). In this survey from 1999 to 2006, the levels of hypercholesteremia (total cholesterol
>= 5.2 mmol/L = 201 mg/dL) for the HL group were lower than the referent non-Hispanic
White group, with adjusted prevalence ratio (95% CI) of 0.99 (0.94, 1.03) (Ford et al. 2010)
and the prevalence (SE) in 2005-2006 ranging from 45.6 (2.5) for African American men
to 58.7 (2.1) for white women. When considering six different HL subgroups within the
Hispanic Community Health Study/Study of Latinos sample from 2008 to 2011 (Daviglus et
al. 2012) that have the potential for considerable heterogeneity, the prevalence (95% CI) of
hypercholesteremia were lowest for South American women at 31 (27, 36) and highest for
Central American men at 55 (51, 59) – all below those noted in the NHANES sample above.
This differential in which the HL group has higher proportion with low HDL-C mirrors
findings for adults. In a sample representative of the United States, 16% of the Hispanic
group aged 8 to 17 years had low HDL-C compared to 14% of NHW group (Kit et al. 2015) in
2011-2012. Also, in the SLS sample, the data source in the proposed analyses, the prevalence
(95% CI) of low HDL-C is 70% (66%, 73%) (Burrows et al. 2016). In this Chilean sample,
the prevalence of low HDL-C is over five times the U.S. representative NHW sample, but
only represents average age 17 years versus the wider age range mentioned above.
Mean triglyceride levels in samples of children also show an atherogenic pattern in which
the HL group is more likely to have adverse levels than the non-Hispanic White group. In
the U.S. a geometric mean of TG in the non-Hispanic White group aged 12-19 years is 79
(73-86) compared to 83 (73-94) for the Mexican American group. In the SLS Chilean sample
of adolescents of a mean age of 17 years, the overall sample mean (SD) was 88.3 mg/dL (50.2)
(Burrows et al. 2016). As discussed previously in the section addressing TG, another sample
of children from Chile exceeded 90 mg/dL (Salesa Barja 2013).
Deviations from this pattern emerge across racial/ethnic groups when examining
pro-portions with hypertriglyceridemia. In the United States, a recent estimate taken from U.S.
findings with 12.1% (95% CI: 9.5, 15.2) of non-Hispanic White and 9.3% (95% CI: 7.7-11.2)
of the HL group with high TG exceeding 150 mg/dL (“Prevalence of Abnormal Lipid Levels
Among Youths — United States, 1999–2006” 2010). A similar prevalence of triglyceridemia,
9.4%, occurred in a sample of 2,900 Chilean school children with an average age of 11 years
from 2009-2011 (Barja Yáñez 2015). In contrast, a study of a U.S. population with subgroups
including non-Hispanic White and HL (Mexican-Americans) demonstrated the HL group
more likely to ever have high TG (Frank et al. 2014) than the non-Hispanic White group.
In this study comparing non-Hispanic White versus HL groups, the prevalence was 27.6%
versus 45.4% and 42.5% versus 55.9%, for men and women, respectively.
In sum, disparities between HL and non-Hispanic White groups of children appear
to follow those for adults when examining HDL-C but does not track as closely for TG.
Differences in TG tracking in racial ethnic groups across the lifecourse may account for this
difference, emphasizing the importance of examining children separately from adults. Other
explanations for divergence across age groups in racial/ethnic lipid differences may also lie in
cohort differences in HL subtypes present in U.S. populations.
2.2.10 Polygenic factors
Monogenic lipid disorders, which usually point to mutations in one specific gene as the
cause of extreme lipid levels are evident in early life. Genetic causes of dyslipidemia also
include polygenic factors in which many genetic factors contribute to a susceptibility to
dyslipidemia when combined with environmental factors such as body weight, activity and
poor diet (Kuivenhoven and Hegele 2014). Polygenic dyslipidemias are the most common
type, occupying the remainder of dyslipidemias after accounting for monogenic dyslipidemias,
the most prevalent is familial hypercholesterolemia with 1 in 500 people being affected.
Interestingly, distinguishing between the two based on phenotypes alone is not straightforward
(Medeiros et al. 2014; Stitziel et al. 2015).
Polygenic effects as defined through Genome-Wide Association Studies (GWAS) efforts
occur through common variants with small effects accumulating into larger aggregate effects
that influence lipid levels in the population. These effects act in concert with modifiable
environmental factors and form the hypothesized causal effect for dyslipidemia (Kuivenhoven
and Hegele 2014). In the past 10 years an ascendance of GWAS (Visscher et al. 2012) has
revealed many common genetic variants associated with lipid levels. As of 2013 the largest
GWAS identifies 157 loci associated with lipid levels (Willer et al. 2013) predominantly in
European ancestral groups. Given this large sample size, this particular study was able to
identify 62 new loci with smaller effects than the 95 previously identified loci (Teslovich et al.
2010). The individual loci were often associated with more than one lipid trait. For example,
there are 16 loci that associated with both HDL-C and TG levels. Taking this information
together, the field is rich for further exploration of genetic variants associated with lipid
levels.
Whether these polygenic factors consistently associate with lipids across the life course
remains unclear although there has been recent research on this topic (Buscot et al. 2016).
Reasons behind this sparsity in research includes lack of longitudinal data to assess any
changes in these associations starting in childhood and going to adulthood. Given the difficulty
in collecting information over such a long range of time this sparsity is not surprising. Though
limited in the amount of evidence present on this topic, common genetic factors identified
through the Global Lipid Genetic Consortium clearly associate with lipids throughout the
life course. Genetic factors do not operate independently when examining common chronic
disorders such as dyslipidemia, and thsi fact underlines the importance of early life as a time
for intervention given these factors manifest at young ages.
cumulative over time, and they most likely exert less of a causal effect on heterogeneity in
lipid levels earlier in life compared to later life. Children do not manifest chronic disease as
adults do, and they rarely take lipid lowering medicines so any genetic effects would be less
confounded in earlier time periods absent these biasing and/or confounding factors. Also,
there is heterogeneity in lipid levels across continental ancestral groups. Given the prior
assumption regarding environmental effects cumulating over the lifecourse one would imagine
that these ancestral group differences would be more pronounced during childhood. Young
adult samples create a promising area in which to investigate genetic effects on lipid levels –
perhaps better revealing divergence of associations across ancestral groups.
A diverse set of genetic factors also contributes to dyslipidemia in children in addition to
primary, secondary and environmental factors such as obesity. Research has mostly focused
on adults in determining associations between genetic variants and lipids, but with recent
analyses of child cohorts, information on children is growing (White et al. 2015; Juonala,
Viikari, and Raitakari 2013; Moltó-Puigmartí et al. 2013; Shen et al. 2013; Breitling et al.
2015; Punwasi et al. 2015; Tikkanen et al. 2011; Buscot et al. 2016). Variants characterized
as being associated with lipids in adults are also implicated in children. In particular, work
has been done with PRSs showing the same scores associate with lipids for children and
adults (Tikkanen et al. 2011; Buscot et al. 2016). Of note, this work replicating associations
in children pertains to populations of European descent. Analyses with smaller samples have
been conducted for Turkish (White et al. 2015) and Chinese samples (Shen et al. 2013),
but further work is needed in other racial and ethnic groups given differences in haplotypic
structure and allele frequencies.
The GWAS have established a large number of single nucleotide polymorphisms (SNPs)
associated with lipid outcomes. After identifying these lipid outcomes based on studies
with populations of European descent, analyses followed with more studies in more diverse
racial and ethnic groups, functional analyses and with other cardiovascular disease outcomes.
Results from these studies since 2013 indicate a common theme of genetic loci linked with
dyslipidemia that tend to generalize across all ancestral groups.
2.2.10.1 Generalizability of association between European-specific variants and
lipid traits to populations of HL descent.
Most GWAS studies investigating connections between genetic variants and lipid levels are
from European populations. These GWAS associations predominantly found in populations
of European descent may not exist in other groups. Reasons for lack of consistent associations
across populations include variation across populations in: 1) risk variant occurrence, 2)
allele frequencies, 3) disease prevalence, 4) risk variant effect sizes (Rosenberg et al. 2010).
Similarly, differences in genetic structure between groups can lead to differences in linkage
disequilibrium, which can also lead to a different association between a lead SNP and the
causal variant found in European populations compared to one from HL descent. All of these
factors are important areas to consider before applying results from studies derived from
European populations to analyses including HL populations.
In particular, generalizability of SNPs, or lack thereof due to the reasons mentioned above,
can compromise PRS formation. For example, without similar effect sizes across population
groups, PRSs have limited meaning when crossing over from the European samples to other
ancestral groups, such as the HL group that is the focus of these analyses. Simulations using
information from the 1000 genomes samples (Martin et al. 2017) demonstrate this concept.
The authors apply GWAS-derived information from a European descent population to form
risk scores in other populations, such as HL samples, resulting in compromised accuracy and
resultant bias. Instead, the authors recommend staying within the source population or one
of similar demographic history when computing PRSs.
the downside is there are few genetic studies outside of those using individuals of European
ancestry (Bustamante, Burchard, and De la Vega 2011), although they are on the rise. The
smaller sample size in the training data with a matching target population also means a
decrease in prediction accuracy. A recent Bayesian method has been proposed to combine
both European and the target population when creating PRSs in samples such as the
proposed one of a HL group. This approach combines the benefits of large samples present in
European samples and the representative linkage disequilibrium patterns from the smaller
target population (Marquez, Loh, and Price 2017). In the future, once published, this method
could add another means to estimate PRS. Lastly, no matter the method or approach all
authors agree that PRS prediction accuracy have yet to approach clinical utility.
Recent studies underscore the generalizability of lipid-related loci found in European
samples with HL samples when they find similarities in statistical significance and effect size
across different populations. In one 2012 study the majority of SNPs found in established
lipid risk loci from European samples were concordant in direction of effect in a HL sample:
23/28, 16/20, 21/23, and 19/21 of TC, LDL-C, HDL-C and TG, respectively (Elbers et al.
2012). Studies in different ancestral groups following large GWAS in Europeans indicates
large overlap between different ancestral groups for genes implicated in lipid variation (Coram
et al. 2013). Results from a 2013 study with both HL and African American samples indicate
a correlation of 0.69 in allelic effect sizes for the HL and African American samples for SNPS
found in a European descent GWAS sample (Coram et al. 2013).
These recent studies have been followed by another meta-analysis of HL populations in
2016 (Below et al. 2016), which reveals little heterogeneity in effect sizes between European
and HL samples. However, in this study they did find evidence for linkage disequilibrium
differences between the european ancestry sample from Global Lipid Genetic Consortium
and the HL along with evidence for novel loci in the HL sample indicating diversity in
genetic architecture. Those differences indicate a possibility for measurement error when
using tag SNPs from groups with european ancestry, which will then dilute effect sizes given
the imperfect association between tag SNPs and the functional variant (Carlson et al. 2013).
However, similarities in effect sizes of many loci across populations do demonstrate how
European results for “GWAS-identified SNPs associated with lipid traits” (Below et al. 2016)
can generalize to HL groups.
The assumption that lipid variants found primarily in samples of European descent
generalize to HL samples may not hold for our particular sample from Chile. Studies of HL
populations focused mainly on Mexicans or Mexican-Americans subgroups, and the existence
of considerable heterogeneity in HL subgroups can undermine the validity of this assumption.
However, the finding that lipid variants generalize across disparate populations such as ones
of African descent provides evidence against this sort of assumption violation. Transethnic
transferability of lipid traits are evident for both HL and African American populations
given, “more than half of the additive phenotypic variance explained by the entire genome
can be attributed to the 10% of the genome showing strongest evidence of association in
Europeans.” (Coram et al. 2013). Furthermore, European lipid risk variants share similar
direction and magnitude of effect in HL and African American populations supporting an
evolutionary biology perspective of shared lipid metabolism variants over generations and
across populations.
Although the majority of lipid variants already established in GWAS do display similar
characteristics in HL groups, there are some variants that do not. Some of these discordant
associations may be due to “different haplotypic structures or contributing variants underlying
risk at these regions. . . ” (Below and Parra 2016). It is also worth noting that the lipid-related
risk variants found in large GWAS are considered common variants. Rare risk variants
found in one ancestral group may not appear in another group, also contributing to lack of
generalizability. This issue is not a prominent factor for the proposed set of variants in these