COMMUNITY VERSUS FACILITY LONG-TERM CARE: IMPACTS ON MEDICARE
SPENDING AND SERVICE USE
Ila Hughes Broyles
A dissertation submitted to the faculty at the University of North Carolina at Chapel Hill in partial fulfillment of the requirements for the degree of Doctor of Philosophy in the Department of Health Policy and Management in the Gillings School of Global Public Health.
Chapel Hill 2014
Approved by: Morris Weinberger G. Mark Holmes Courtney Van Houtven Philip Sloane
ABSTRACT
ILA HUGHES BROYLES: Community versus Facility Long-Term Care: Impacts on Medicare Spending and Service Use
(Under the direction of Morris Weinberger)
Older Medicare beneficiaries with disabilities are a high-cost Medicare population and use substantial amounts of health care. A distinctive feature of this population is their use of long-term care (LTC), which can be provided in a facility (e.g., nursing facility, assisted living facility) or the community. This dissertation examined the effect of facility LTC versus community LTC on Medicare expenditures and service use among fee-for-service Medicare beneficiaries from 2000-2009.
I examined facility LTC’s effect on: Medicare expenditures for inpatient and physician services (Aim 1); Medicare expenditures for sub-acute services (skilled nursing facility, home health, and hospice) (Aim 2); and emergency department (ED) visits, observation days, and likelihood of 30-day or 60-30-day hospital readmission (Aim 3). To illuminate the role of competing mortality, I
implemented most models as survival-adjusted models. To account for potential unobservable differences among those who used community versus facility LTC, I used an instrumental variables approach in all models. The primary dataset for the dissertation was the Medicare Current Beneficiary Survey, supplemented with public data on LTC supply.
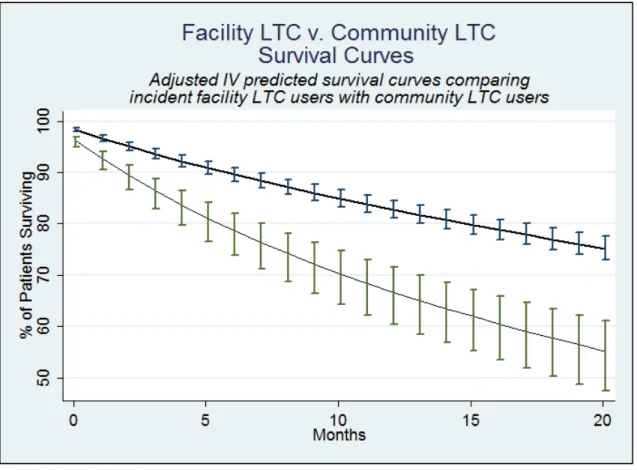
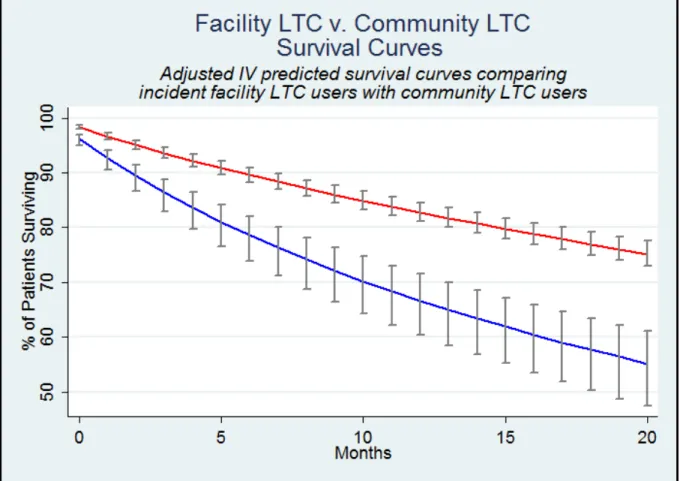
Incident facility LTC users had substantially lower adjusted cumulative survival. In Aim 1, this higher mortality for facility LTC users decreased cumulative Medicare expenditures on both inpatient and physician services, because individuals were progressively less likely to survive and use
ACKNOWLEDGEMENTS
This work was possible only due to the encouragement, guidance, and commitment of a cadre of individuals as well as generous funders.
I must begin by thanking my dissertation committee: Morris Weinberger, Mark Holmes, Courtney Van Houtven, Phil Sloane, and Kristin Reiter. Each of them brought their own lens and offered insights, solutions, and encouragement that helped me push the work forward and make each draft better. Additionally, I must thank Jeff Federspiel, who served as a consultant on this project. I owe him a debt for both his help with obtaining the data as well as introducing me to and helping me with the methodology I use here. This dissertation benefitted from his generosity of time and expertise immensely.
I want to particularly thank my advisor, Morris Weinberger, for his unflagging commitment to students’ success. He is a great champion and encourager of young researchers, in addition to an outstanding scientist himself. He not only improved my dissertation but also my quality of life. I chose UNC’s PhD program because of Morris’s obvious commitment to the PhD students as program director. As an advisor and mentor, he exceeded all expectations in his investment in and encouragement of me as a researcher and mentee.
I also want to thank Mark Holmes for his perseverance and creativity in the midst of the methodological challenges I faced. Mark was available and willing to help me find solutions for complex questions, and I would not have been able to execute this project without his good-natured, solutions-oriented problem solving.
dissertation work here. Additionally, they engaged me personally, and I gained valuable advice and mentorship from each of them.
I am grateful for the encouragement and help of friends I have found through UNC,
particularly in my cohort. I appreciated their encouragement, accountability, and friendship and look forward to lifelong friendships with many of them.
Finally, I want to thank my family. In particular, I want to thank my husband Jim Broyles. He has championed me from the outset to the finish line: moving with me to UNC so I could pursue my PhD, supporting me through coursework, walking alongside me through the inevitable challenges that a dissertation brings. His optimism was a buoy to me at the end of every day, and I am thankful to celebrate this accomplishment with him—it’s as much his as it is mine.
I am grateful to generous funding for this research. This project was generously supported by grant number R36HS022794 from the Agency for Healthcare Research and Quality and NIA
PREFACE
TABLE OF CONTENTS
LIST OF TABLES ... ix
LIST OF FIGURES ... x
LIST OF ABBREVIATIONS ... xi
CHAPTER 1. INTRODUCTION ... 1
1.1.Background ... 1
1.2.Study Purpose and Specific Aims ... 1
1.3.Study Significance ... 2
CHAPTER 2. LITERATURE REVIEW AND CONCEPTUAL MODEL ... 3
2.1.Disability, LTC, and Medicare Costs among the Elderly ... 3
2.2. Previous Research on LTC and Medicare Costs ... 4
2.3.Changing Financial Environment for Facility LTC Providers ... 5
2.4.Research Question and Hypotheses ... 7
2.5.Conceptual Model ... 8
2.6.Instruments ... 9
CHAPTER 3. APPROACH ... 15
3.1.Overview and Rationale ... 15
3.2.Data Sources ... 16
3.3.Sample ... 17
3.4.Key Variables and Measures ... 18
3.5.Analytic Files ... 21
3.6.General Analytic Approach ... 22
3.7.Sample Size and Statistical Power ... 25
CHAPTER 4. AIM 1 ... 30
4.2.Methods... 32
4.3.Results ... 37
4.4.Discussion ... 39
CHAPTER 5. AIM 2 ... 48
5.1.Introduction ... 48
5.2.Methods... 50
5.3.Results ... 53
5.4.Discussion ... 55
CHAPTER 6. AIM 3 ... 62
6.1.Introduction ... 62
6.2.Methods... 64
6.3.Results ... 66
6.4.Discussion ... 67
CHAPTER 7. SUMMARY, IMPLICATIONS, AND CONCLUSIONS ... 75
7.1.Summary of Findings ... 75
7.2.Implications for Policy and Practice ... 77
7.3.Next Steps and Future Research ... 79
7.4.Conclusion ... 80
APPENDIX 1 ... 82
APPENDIX 2 ... 84
LIST OF TABLES
Table 2.1. Nursing Facility Margins ... 13
Table 3.1. Dependent Variables and Source Files ... 28
Table 3.2. Covariates ... 28
Table 3.3. Second Stage Models ... 29
Table 4.1. Descriptive Statistics of Sample Medicare Beneficiaries Receiving LTC ... 43
Table 5.1. Medicare Sub-Acute Benefits ... 58
Table 5.2. Descriptive Statistics for Sample of LTC Users by Setting of LTC ... 59
Table 6.1. Descriptive Statistics for Sample of Discharges by Previous Setting of LTC ... 71
LIST OF FIGURES
Figure 2.1. Conceptual model. ... 14
Figure 3.1. Structure of Medicare Current Beneficiary Survey. ... 26
Figure 3.2. Sampling frame and exclusion criteria. ... 27
Figure 3.3. Study period segmentation. ... 27
Figure 4.1. Study period made up of wash-out period, treatment windows, and outcome window. ... 44
Figure 4.2. Incident facility LTC effect on survival. ... 45
Figure 4.3. Incident facility LTC’s differential effect (facility LTC vs. community LTC) on Medicare expenditures for inpatient services. ... 46
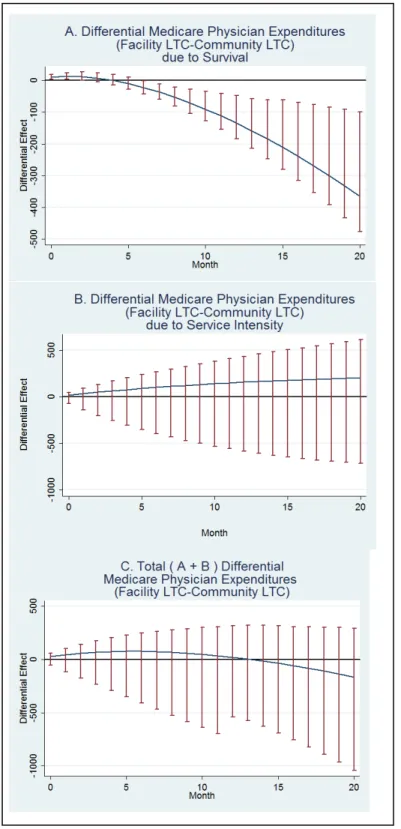
Figure 4.4. Incident facility LTC’s differential effect (facility LTC vs. community LTC) on Medicare expenditures for physician services. ... 47
Figure 5.1. Incident facility LTC effect on survival. ... 60
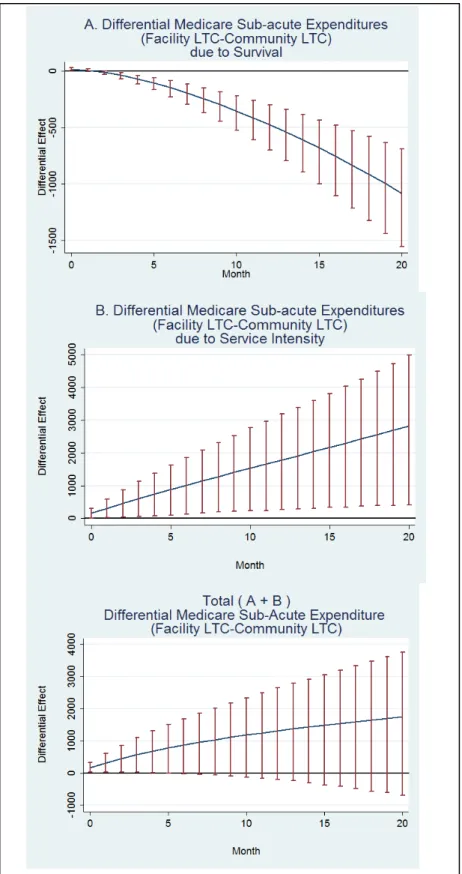
Figure 5.2. Incident facility LTC’s differential effect on Medicare sub-acute expenditures. ... 61
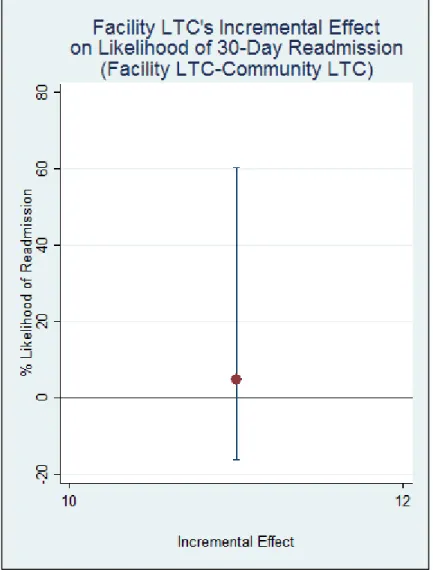
Figure 6.1. Facility LTC’s incremental effect on likelihood of 30-day readmission. ... 72
Figure 6.2. Facility LTC’s incremental effect on likelihood of 60-day readmission. ... 73
Figure 6.3. Likelihood of 30-day readmission if sample received facility LTC vs. community LTC. ... 74
LIST OF ABBREVIATIONS
ACO—Accountable Care Organization ADL—activities of daily living
ALF—assisted living facility
CCRC—continuing care retirement community COPD—chronic obstructive pulmonary disease IADL—instrumental activities of daily living IV—instrumental variable
ED—emergency department LTC—long-term care
MCBS—Medicare Current Beneficiary Survey NF—nursing facility
OAA—Older Americans Act
CHAPTER 1. INTRODUCTION
1.1.
Background
Increasing healthcare expenditures are threatening Medicare solvency and driving the U.S. healthcare crisis. Disabled older adults are among those Medicare beneficiaries with the highest healthcare costs.1,2 In addition to substantial healthcare needs, disabled older adults often require long-term care (LTC). LTC provides help with daily activities (e.g., bathing, eating) and can be delivered in a facility such as nursing facilities (NF) and assisted living facilities (ALFs) (“facility LTC”) or in community settings like one’s own home (“community LTC”).
Though Medicare does not pay for LTC, facility LTC providers have large influence on residents’ healthcare use and face financial incentives to increase residents’ Medicare-covered healthcare use. Prior research suggested that facility LTC did not increase healthcare service use,3 however the financial environment for LTC facilities has shifted dramatically since this research was conducted. Changes over the past twenty years (1990 and after) developed or amplified incentives for LTC facilities to increase healthcare use. Incentives include diminished liability (if they recommend the most aggressive treatment), decreased costs of providing care (if residents are in the hospital), and the prospect of higher margins (if patients receive Medicare-covered rehabilitation services provided by the facility).
1.2.
Study Purpose and Specific Aims
The overall objective of this research was to identify whether facility LTC affects Medicare expenditures and healthcare outcomes. My central hypothesis was that facility LTC increased use of Medicare-covered service, relative to community LTC, due to financial incentives and increased access to providers. I tested my central hypothesis by pursuing the following three specific aims:
Hypothesis 1 Facility LTC will result in higher Medicare expenditures for acute care but not of physician/practitioner services relative to community LTC.
Aim 2 To identify whether facility LTC affects Medicare expenditures for sub-acute care (skilled nursing facility, home health, and hospice) among disabled older adults.
Hypothesis 2 Facility LTC will result in higher Medicare expenditures for sub-acute care relative to community LTC.
Aim 3 To determine whether facility LTC and its associated healthcare use result in potentially avoidable health services utilization, specifically emergency department (ED) visits, hospital observation days, and re-hospitalizations. Hypothesis 3 Facility LTC will result in more potentially avoidable healthcare use relative
to community LTC.
1.3.
Study Significance
This study was significant because it sought to determine the effect of a policy-modifiable factor, LTC setting, on healthcare expenditures for high-cost Medicare beneficiaries. The identification of modifiable factors that can reduce Medicare expenditures and improve program efficiency is immediately relevant to policymakers and providers. Currently, policymakers are experimenting with new payment mechanisms in Medicare. This research could illuminate how and whether LTC settings may be affecting healthcare costs. This understanding could be incorporated into current and future payment mechanisms that incentivize LTC providers to help bend the Medicare cost-curve.
CHAPTER 2. LITERATURE REVIEW AND CONCEPTUAL MODEL
2.1.
Disability, LTC, and Medicare Costs among the Elderly
Identifying the causes of high healthcare costs has become a major research priority as concerns about U.S. healthcare spending, particularly in Medicare, continue to grow.4,5 Cost-containment interventions that focus on the highest cost beneficiaries have the potential to achieve the greatest savings.6 This has led to investment of researcher time and focus, as well as federal research funding, on patients with multi-morbidity and/or transitional care between settings.7 Unfortunately, though they may improve care delivery or patient experience, neither care
management for patients with multi-morbidity nor efforts to improve transitional care have consistently achieved Medicare cost savings among high-cost beneficiaries.8,9,10 Thus, clear solutions for
stemming cost growth among high-cost populations remains a stubborn problem.
Medicare beneficiaries with disabilities are among the highest cost beneficiaries, even after adjusting for comorbidity.11,12,13,14 Medicare beneficiaries with chronic conditions and disabilities have higher spending than individuals with chronic conditions only, regardless of the number of multi-morbidities.15 A distinctive feature of this population, as compared to other high-cost healthcare users, is their use of long-term care (LTC). Disabled beneficiaries often need LTC, which can be provided in a facility such as a nursing facility (NF) or assisted living facility (ALF) or in the community, from paid or unpaid caregivers. In addition to having disabilities that require LTC, the costliest Medicare
2.2.
Previous Research on LTC and Medicare Costs
Much previous research on the role of LTC in Medicare costs has been hindered by
methodological challenges. Facility LTC users likely have higher rates of chronic disease and medical complexity compared to other disabled individuals.17 Without considering selection effects,
researchers may have trouble distinguishing the effects of facility LTC from multi-morbidity, for example, and inadvertently attribute the costs due to chronic disease to the receipt of facility LTC. No recent studies have identified how LTC setting (facility versus community) affects Medicare
expenditures while adequately considering the selection effects involved in LTC setting. Some investigators used LTC setting as a proxy for disability level without adjusting for the unobserved characteristics that may influence LTC setting. A previous study on the effects of disability on 1993 Medicare expenditures used facility LTC residence as a proxy for high level of disability,18 however this work did not explicitly consider selection effects and used Medicare expenditures prior to the imposition of the skilled nursing facility prospective payment system. Guralnik and colleagues examined transitions to higher levels of disability and found that high healthcare costs were associated with transitions to facility-based LTC without considering selection effects.19
2.3. Changing Financial Environment for Facility LTC Providers
In the past two decades (the time elapsed since the last major experimental research on LTC’s effect on Medicare costs) the financial environment for facility LTC providers has changed substantially. First, the payment dynamics for NFs changed. The growth in NF revenues from
Medicare rehabilitation care grew dramatically from 1980 to 2000. Most NFs, over 90% in 201223, are dually certified and act as both Medicaid LTC facilities and Medicare skilled nursing facilities (SNFs). However, the presence of Medicare rehabilitation services in NF service delivery is a relatively new development. Formerly, NFs almost exclusively focused on traditional custodial LTC for residents, often paid for by Medicaid, as opposed to rehabilitation services following hospitalization (“sub-acute care”) paid for by Medicare.24 Medicare’s spending on NF sub-acute care constituted 1.6% of total U.S. spending on nursing homes in 1980.25 Following the implementation of the inpatient prospective payment system, decreasing hospital length-of-stay created a new reliance on post-hospitalization rehabilitative care and the sub-acute market grew.26,27 By 2004, Medicare payments for sub-acute care were 13.9% of U.S. payments to nursing homes.28 This segment of NF business was more profitable to NFs than custodial LTC care, particularly that paid by Medicaid. Within the study period, Medicare margins for SNFs remained high and climbed over the decade, whereas non-Medicare margins remained negative over the decade (see Table 2.1). From 1999 to 2007, while the total number of Medicare beneficiaries receiving sub-acute SNF services grew by 33%, expenditures on these services increased by 88%.29 Due to the higher margins, the incentive to increase use of this new, more profitable Medicare SNF benefit, which requires a three-day hospitalization, likely changed NF behavior. Specifically, it may have altered the healthcare delivery to NFs’ custodial LTC patients, particularly inpatient and SNF services.
policies.30 In a similar study, Grabowski and colleagues found that state introduction of a Medicaid bed-hold policy increased 30-day rehospitalizations for Medicare patients by 1.8%.31 Because this change would constitute only a spillover effect from changing payments for hospitalization of
Medicaid LTC patients, it is possible that hospitalization for long-stay Medicaid patients went up even higher. Implementation of these bed-hold policies evidently changed hospitalization practices for NF residents.
Second, the ALF market grew dramatically, with large growth in for-profit entities offering assisted living services. These facilities provided custodial care to a disabled population. There is evidence that ALFs served a similar group of patients as NFs. In addition to providing help with ADLs and IADLs, ALFs can offer physical therapy, occupational therapy, and some skilled nursing services. Residents of ALFs also have a high degree of disability and very high levels of chronic conditions.32 This descriptive information about resident similarity is validated by recent research, which suggests that ALFs may substitute for NF. One study found that a 10% increase in ALF capacity led to a 1.4% decline in NF private-pay occupancy and a 0.2–0.6% decline in overall NF patient acuity.33 In
combination, it seems that ALFs offer an alternative to NF care for some clinically similar individuals. Though they are not providers of sub-acute SNF care, ALFs also faced incentives to increase medical care. One financial incentive is the existence of a de facto bed-hold policy. ALFs, which are mostly paid privately, often require continued payment if residents are hospitalized or are admitted to SNFs for rehabilitation. Thus, if a resident is hospitalized or admitted to an SNF, the facility receives “rent” but does not have to pay for labor to provide LTC. These bed/room-hold rates are often negotiated during admission to the ALFs and patients and their families can instead opt to be discharged and lose their bed or room. Most patients in ALFs are private pay, but some are paid for by Medicaid. Currently, only a handful of states have an ALF Medicaid “bed-hold” payment policy in such cases (similar to a NF Medicaid bed-hold payment), but such policies do exist.34 These bed hold policies may serve as an incentive to increase inpatient and SNF care for ALF residents.
understand why residents were hospitalized.35 Concerns about liability were a common financial concern that drove hospitalizations for both types of facilities. Additionally, the survey reported that physicians believe they receive higher compensation for visits when they see patients in the hospital versus the LTC facility.
In addition to the changes to hospitalization and SNF incentives, policy and payment changes that impact physician and similar provider service use among facility LTC residents also occurred. Legislation in the late 1980s required NFs to provide regular physician (or substituting professional) assessments of residents at 30- or 60-day intervals.36 This legislation also strengthened the
requirements for medical directors in LTC facilities (particularly NFs), which could lower barriers to physician care for those in LTC facilities. However, qualitative evidence after this legislation suggests that LTC facility residents experienced minimal access to physicians, with monitoring by nursing staff substituting for physician care.37 Lower reimbursement for and logistical difficulty in delivering care in LTC facilities38 and the national decrease in the number of geriatricians being trained39 could have affected the availability of physician services in LTC facilities. On balance, these factors may have canceled one another out and led to no effect of facility LTC use on Medicare expenditures on physician services.
These changes, including the change in the NF financial environment and growth of ALFs, may have shaped or changed facility LTC providers’ effect on residents’ healthcare use. NFs and ALFs faced incentives to increase Medicare-reimbursed acute care because, if residents were hospitalized, facilities bore no costs of care while still receiving payments to hold the bed. ALFs had similar incentives when beneficiaries were admitted to SNFs following hospitalizations. NFs also had incentives to increase SNF sub-acute care, and encourage the required hospitalization, because they could then receive higher Medicare SNF payments, especially compared to Medicaid-paid LTC. These incentives drove my hypothesis that changing payment dynamics altered delivery of medical care to facility LTC users, particularly acute and SNF care.
2.4. Research Question and Hypotheses
outcomes. My central hypothesis was that facility LTC use increased use of Medicare-covered service, relative to community LTC, due to financial incentives and increased access to providers. I tested my central hypothesis by pursuing the following three specific aims:
Aim 1: To identify whether facility LTC affects Medicare expenditures for acute care and physician/practitioner services (e.g., nurse practitioner, etc.) among disabled older adults.
Aim 2: To identify whether facility LTC affects Medicare expenditures for sub-acute care among disabled older adults.
Aim 3: To determine whether facility LTC and its associated healthcare use result in potentially avoidable health services use, specifically emergency department (ED) visits, hospital observation days, and re-hospitalizations.
I hypothesized that facility LTC use would increase expenditures on hospitalizations and sub-acute care as well as counts of potentially avoidable health services use but would not affect
expenditures on physician services, relative to community LTC.
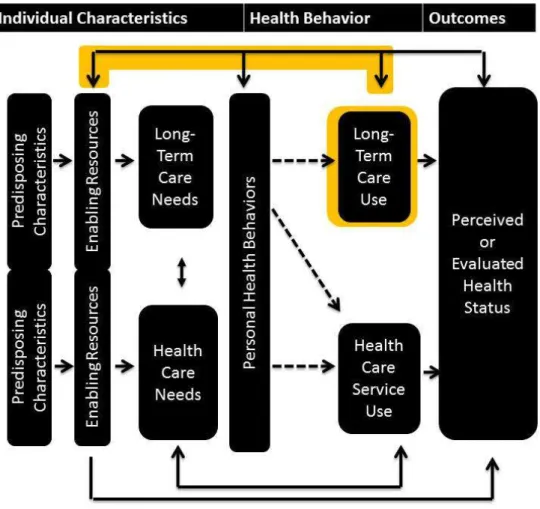
2.5. Conceptual Model
To examine the research question and drive the hypotheses, this research relied on a conceptual model informed by both the Andersen Behavioral Model and an understanding of the financial environment for LTC providers. Andersen’s model identified three categories that explain healthcare service use, breaking characteristics into (1) predisposing characteristics (demographic descriptors such as age or race), (2) enabling factors (which allow healthcare service use to take place, such as proximity to providers, transportation, and insurance status), and (3) need for services (both perceived and real).
service use can result in changes to the enabling factors for healthcare service use (see highlighted pathway in Figure 2.1).
Specifically, my conceptual model suggests that where LTC is delivered (“setting of LTC”) acts as an enabling characteristic for healthcare use. In particular, facilities that deliver LTC have increased access to healthcare services through relationships with hospitals or other providers. They may also have financial incentives to increase service use for some services, particularly acute and sub-acute care. These financial incentives take several forms and are described in detail in Section 2.3. Due to the financial incentives for facilities, I hypothesized that individuals who receive facility LTC will have higher healthcare services use, particularly acute (Aim 1) and sub-acute care (Aim 2) and potentially avoidable healthcare use such as ED visits and readmissions (Aim 3), as a result of this enabling characteristic. In my model, facility LTC acts as a more potent enabling characteristic for healthcare use compared to community LTC.
2.6. Instruments
The conceptual model also supports the use of the proposed instruments to predict LTC setting within the study population (disabled older adults receiving LTC). Instrumental variables require you to identify exogenous variables (“instruments”) that will predict treatment. However, these variables must only affect your outcome through your treatment, once other covariates are controlled for (“the exclusion restriction”). I sought to identify instruments that would predict LTC setting (facility versus community LTC) but not healthcare use, outside of pathways for which I can explicitly control (income, education, race, etc.).
Number of Adult Children
Among disabled beneficiaries receiving LTC, a higher number of adult children should be correlated with a lower likelihood of receiving facility LTC. Number of adult children should act as an enabling characteristic for community LTC, because they provide informal caregiving that can entirely or partially meet an individuals’ LTC needs. However, number of adult children should predict neither co-morbidities nor acuity of disease that leads to healthcare use.
caregiving (and thus increases the use of informal caregiving). Informal caregiving then acts as a substitute for facility LTC use. Thus, an increasing number of adult children should decrease facility LTC use.
Currently, informal caregiving represents the bulk of long-term care in the United States. In addition to spouses, adult children are a major source of informal caregiving.41 For individuals ages 60 to 75 living the community with 2+ ADLs, spouses act as primary caregivers for about 50% of adults and children act as primary caregivers for about 35% of adults. However, for those over age 75, children provide the majority of caregiving.42
The number of children can affect the availability of informal caregiving in multiple ways. Caregiving responsibilities may be shared across more siblings as family sizes grow.43 This can directly increase the availability of caregivers and the duration of informal caregiving, because sharing the workload could help prevent caregiver burnout. Both of these increase the supply of informal caregiving. Importantly, the protective effect against burnout, although enhanced by geographic proximity, is not entirely limited by geography. Adult children located at a distance can provide emotional support to a sibling providing primary caregiving support.44 This may bolster the quality (and duration) of informal caregiving available and thus the supply.
Threats to the Exclusion Restriction
First, although fertility and health status may be simultaneous for the childbearing population, there should be no direct causal relationship between previous fertility and current health needs for older adults. Fertility, with rare exceptions, ends well before the age of the study population (ages 50 and older).
There are several indirect effects that are possible. It is possible that previous fertility affects income among older adults and thus health status (e.g., a woman who quit working due to
Second, there is a possibility that previous fertility was affected by previous mental health status or previous health status, both of which could also affect an older adult’s current health status. However, current health status can be controlled for as well.
Finally, there is the threat of unobservable characteristics that affect both previous fertility and current health status. Although this is always a risk for instruments, the time gap between previous fertility and current health status should allay some of these concerns.
Supply of Assisted Living and CCRCs
Among disabled beneficiaries receiving LTC, the supply of LTC facilities in a beneficiaries’ geographic area should not be correlated with healthcare service use once local healthcare facility supply is controlled for (e.g., hospitals, etc.). The local supply of ALFs and continuing care retirement communities (CCRCs) in particular should act as an enabling characteristic for facility LTC service use but not of healthcare use.
Changes in the geographic supply of LTC facilities over the study period could predict LTC facility residence. As the U.S. population ages, the supply of ALFs and CCRCs has increased rapidly, especially in the early part of the study period (2000–2006) but varied substantially by geography, so there was expected to be substantial variation in these items over the study period.45
There are multiple pathways through which supply of ALFs and CCRCs could affect LTC facility use. First, the availability of these facilities may act as a substitute for nursing home care. Recent research suggests that the availability of ALFs decreases low-care nursing home residents marginally.46 There are other pathways in which assisted living facilities do not act as substitutes but as complements. These pathways assume that, on average, these types of facilities may be a more palatable setting than a traditional NFs for older adults who consider themselves only minorly
Notably, individuals most likely to be influenced by these supply factors are individuals who are able to afford to pay for ALFs and CCRCs. Although new surveys reflect that ALFs are more varied in price and luxury than was formerly understood, residential care facilities still serve a primarily private-pay population.47 Thus, the treatment effect of this instrument will be concentrated among individuals able to afford private-pay LTC. However, because approximately 40% of residential care facilities had at least one resident for whom LTC was paid, in some part, by Medicaid,48 the effect should not only be to upper-income populations.
Threats to the Exclusion Restriction
Because Medicare does not directly pay for LTC and these facilities (CCRCs and ALFs) do not also supply healthcare, the availability of ALFs and CCRCs should not affect individuals’
healthcare use unless they are living in the facility. Thus, there should be no direct effects that violate the exclusion restriction.
There is one primary indirect effect that supply of these facilities could have on healthcare use. Economic prosperity could have increased the supply of both these facilities and other
healthcare facilities simultaneously. As a result, economic prosperity (which increases the availability of these facilities) could also increase healthcare spending for individuals. However, we can control for geographic characteristics, time trends, and other healthcare provider supply characteristics (e.g.,skilled nursing facilities) that would act as the pathway for the effect of economic prosperity.
Supply of Home-Delivered Meals
The availability of publicly funded community LTC support such as Meals on Wheels could act as a supply factor that increases community LTC use. Home-delivered meals likely act as a complement to other informal and formal caregiving in the community. However, because it is determined at an area level, it does not co-vary with individual-level LTC need characteristics that could also affect healthcare access (such as dementia, etc.). Emerging research validates this hypothesis. State spending on OAA-funded Meals on Wheels decreased the prevalence of nursing facility residents that were classified as low-care.49 The study was at the state level, included
Threats to the Exclusion Restriction
Funding for Meals on Wheels may be predicted by other community-level factors that also affect healthcare availability and delivery. State-wide commitment to community LTC as well as other factors that may also affect healthcare use, such as Medicaid funding, could affect Meals on Wheels. Thus, we controlled for average state Medicaid per diem for nursing facilities and the percentage of state Medicaid budgets spent on home-and-community-based services. It is also likely that state funding for Meals on Wheels is also affected by the general community-level supply factors that were previously discussed and were controlled for in the analysis.
Table 2.1.
Nursing Facility Margins
Medicare50 17%51 9.4%52 13.7% 13.3% 16.6% 18.5%
For-profit53 16.1% 15.7% 19.1% 20.7%
Non-profit54 3.5% 3.5% 6.9% 9.5%
Non-Medicare55 -.7% -2.8% -1.3% -.9% -2.6% -1.2%
CHAPTER 3. APPROACH
3.1.
Overview and Rationale
This study sought to identify the comparative effect of incident facility LTC versus community LTC on Medicare expenditures and potentially avoidable healthcare use. To achieve this objective, the study used nationally collected survey and claims data in an observational design. A major challenge to achieving the study purpose was methodological. Both multi-morbidity and mortality directly increase healthcare use and are highly prevalent among disabled older adults. Because of this high prevalence, it is difficult to identify adequate control groups for individuals who receive facility LTC. However, by using advanced econometric techniques, including instrumental variables (IVs), this research sought to address selection effects and determine the independent effect of facility LTC use on Medicare expenditures. Additionally, given the higher risk of mortality in our older, disabled population of interest, the approach sought to account for competing risk from mortality by using survival-adjusted models, which explicitly model mortality, where it was feasible.
The Medicare Current Beneficiary Survey (MCBS), a nationally representative survey matched with claims data, served as the primary data source. Each of the study aims used an IV approach to compensate for possible selection effects when comparing beneficiaries receiving facility LTC versus community LTC. The potential instruments predicting likelihood of facility LTC versus community LTC were the same for all aims and included (1) number of adult children, (2) supply of LTC facilities in their geographic area (e.g., assisted living facilities (ALF) and continuing care retirement communities (CCRC), etc.), and (3) state-level funding for home-delivered meals for homebound individuals (Meals on Wheels). Each aim also incorporated survival-adjusted
methodologies,57 because this is the best measure of cost in a population with higher likelihood of death. To determine the effect of LTC setting on service-specific Medicare expenditures, Aim 1 used generalized linear models with dependent variables of Medicare expenditures on acute and
Medicare expenditures on sub-acute services, including skilled nursing facility (SNF), home health, and hospice care. To determine the effect on avoidable health services use, Aim 3 used generalized linear models estimating counts (ED visits and number of hospital observation days) and maximum likelihood models estimating likelihood of any services (30- and 60-day hospital readmission).
3.2. Data Sources
The Medicare Current Beneficiary Survey (MCBS) comprised the bulk of the data used in all Aims. The MCBS is a nationally representative panel survey of Medicare beneficiaries. Panels are introduced annually and followed for four years (see Figure 3.1). Survey information is available only for the fall of each year (Figure 3.1). In addition to collecting demographic information, the MCBS
survey asks participants questions about disability, LTC services, and health status. The survey data is matched to other information that is gathered continuously, including Medicare claims containing the healthcare service use and expenditures of participants and residence tracking (such as between the community and a facility). The file includes information about geographic location of participants (to the zip code level). I combined information from the Access to Care file and the Cost & Use file to obtain survey information for four consecutive calendar years and used claims information from the Cost & Use file to provide Medicare service use for the later three years.
participants in the survey for years 2000–2009 and included their survey responses and LTC supply over time.
3.3. Sample
I sought to identify a sample of individuals who are at risk for facility LTC use or at equipoise between facility and community LTC. To identify this group, I needed to identify individuals who could feasibly receive community LTC and do not have to receive facility LTC. Thus, the sampling frame included individuals who enter the MCBS living in the community and did not use facility LTC for the first three months in the survey (see Figure 3.2). Medicare-paid skilled nursing facility (SNF) stays alone did not qualify as facility LTC use (and thus an exclusion from the sampling frame), because these are healthcare services, as defined in the conceptual model, and an outcome of Aim 2 of this dissertation. However, if the three-month look-back period only included a Medicare-paid SNF stay, the individual was excluded, because prior use of facility LTC before the SNF stay was unknown.
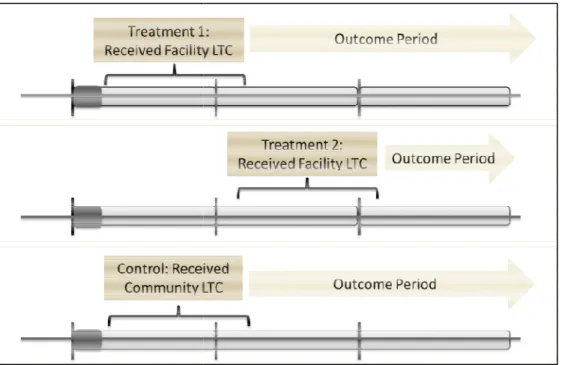
To delineate the time period in which someone was eligible for treatment versus the outcome period, I defined 3 time categories: a wash-out period for their first three months in the survey
(January–March), a treatment period of from April 1 to March 31, and an outcome period from April 1 until the end of their participation in the MCBS (see Figure 3.3). To ensure there were enough treated individuals, there were two treatment periods per cohort (see Figure 3.3). We included a second potential treatment window (April 1, Year 2, to March 31, Year 3) for those who were eligible for but did not use facility LTC during the first treatment window. Controls were identified from those who received community-based LTC during the first treatment period for each cohort.
Sample Identification
Within the sampling frame specified (those at risk of facility LTC use), I identified two samples:
Sample #1: The first sample was a clinically similar group of patients gathered by matching community LTC users to facility LTC users by age. I separated out individuals in the sampling frame into 3-year age “bins” (i.e. 50–52, 53–55, etc.). For each individual who used facility LTC during the treatment window, I randomly selected three individuals in the same three-year age bin (ages 50+) who received community-based LTC. I used a “greedy” matching process in which community LTC users (controls) could be sampled multiple times. This allowed me to homogenize the sample and ensured I was using the instrument to predict facility LTC use in a similar group of individuals. This group of facility LTC and community LTC users comprised Sample 1.
Sample #2: The second sample was comprised from all discharges that occurred during the outcome period for all facility LTC users (treated) and community LTC users (controls) individuals outlined in the sampling frame.
3.4. Key Variables and Measures
Exposures
The most critical measure was treatment, or receipt of LTC. Incident facility LTC (treatment initiation) occurred when someone moved to a LTC facility during the treatment period (after they began the survey in the community and used no facility LTC during the wash-out period). For this analysis, LTC facilities included NFs, ALFs (which includes board & care home, domiciliary care facilities, personal care facilities, rest home/retirement homes), and CCRCs.
2010.60 These facilities must balance patient care concerns with their own financial well-being. Second, although ALFs do not offer SNF care, they still face incentives to increase medical care. One financial incentive is the existence of a de facto bed-hold policy for private-pay residents, detailed in the conceptual model (Section 2.3). Liability is likely another major incentive to increase medical care, especially because ALFs may have less medical staff than NFs. Third, there is not a definitive clinical distinction between residents of NFs and ALFs. In addition to providing help with functional
limitations, ALFs can offer physical therapy, occupational therapy, and some skilled nursing services. Residents of ALFs have a high degree of disability and very high levels of chronic conditions.61 This descriptive information is validated by recent research, which suggests that ALFs may substitute for NF care. One study found that a 10% increase in ALF capacity led to a 1.4% decline in NF private-pay occupancy and a 0.2–0.6% decline in overall NF patient acuity.62 In combination, it seems that ALFs offer an alternative to NF care for some clinically similar individuals. Finally, many ALF users in our sample go on to use NF care (only 19% of sample 1 used exclusively ALFs). In summary, because ALFs face financial incentives to increase healthcare, the care they deliver is similar to care delivered in a NF, and residents often go on to receive NF care, residents who entered an ALF for the first time were grouped among the treated for this analysis.
Individuals received “community LTC” if they reported receiving help with any ADL in their survey responses during the treatment period and lived in the community for the entirety of the survey. If they received Medicare-covered SNF care with no accompanying Medicaid or private pay-covered LTC facility stay, they were still considered to have lived in the community.
Outcomes
provider outcome; SNF, home health, and hospice claims were used for the sub-acute expenditure outcome; outpatient claims were used for ED visits (identified using revenue center codes 450–459 or 981); and observation days were identified using the outpatient and inpatient claims. Readmissions were identified using the Yale All-Cause Readmission Definition63 and generated from the inpatient claims file. See Table 3.1 for a summary of dependent variables by aim and source claims files.
Covariates
I sought to identify and operationalize the key pre-disposing, enabling, and need factors for healthcare use among disabled older adults (listed in Table 3.2) as covariates. All variables listed came from the MCBS from the fall prior to the treatment window, with the exception of local-level healthcare supply and LTC funding, which came from the year the treatment window started.
I included predisposing characteristics including age, gender, level of education (high school, some college, and college graduate), and race (African American), all of which were gathered via self-report. The lack of inclusion of more granular race and ethnicity categories was due to very low numbers in the treated sample. I included enabling characteristics such as Medicaid eligibility at any point in the year preceding the treatment window, rural residence (three categories defined by RUCA codes by zip code), Census region geographic area, and elements predicting LTC service use (state Medicaid % spending on HCBS, state NF per diem rates). Local healthcare supply was intended to be hospital and SNF counts in the beneficiary’s zip code but low variation in hospital counts led to collinearity and thus only SNF counts were used.
measure for ADL disability to account for the gradation of ADL disabilities by taking the sum of all six of the binary ADL variables.
To capture if a person considered him or herself semi-independent physically while still exhibiting some functional dependence, I created another variable that indicates that the person exhibits any IADL needs. Similar to ADLs, the MCBS asks whether the individual usually has any difficulty with using the telephone, and the potential responses are yes, no, or does not do (in which case there is a follow-up question of whether the individual does not do them due to health problems). For IADLs, I created a single binary variable indicating difficulty in any IADL and counted any
indication of difficulty with any of these activities. However, almost the entire sample had IADL disability, thus we were not able to include it in the final model. Finally, I used survey responses on a variety of cognitive functional measures to assess presence of any cognitive limitation.
The most important healthcare need factors were diagnoses. To identify co-morbidities, I used survey responses of whether someone had ever received a variety of diagnoses including hip fracture, breathing problems (including asthma, emphysema, or COPD), Alzheimer’s, diabetes, non-skin cancer, stroke, congestive heart failure, hypertension, angina, arteriosclerotic heart disease, myocardial infarction, and heart arrhythmias.
Instruments
Number of adult children was taken from survey responses and run as a continuous variable. Zip-code level counts of ALFs and CCRCs were represented as counts and were also continuous. State spending on Meals on Wheels was translated to state per capita spending for the over-65 population and translated to 2004 dollars, to be consistent with all dollar measures in the analysis.
3.5. Analytic Files
period), because the outcome of Medicare costs was no longer observable. The second file (Analytic File #2) was limited to individuals with hospital discharges and had observations as person–hospital discharge combinations. It included indicators for 30- and 60-day readmission in each file, death within 30 or 60 days, or censoring within 30 or 60 days due to HMO enrollment or survey roll-off.
3.6. General Analytic Approach
I implemented an IV approach for all outcomes, using survival-adjusted methods64 for all outcomes except 30- and 60-day readmissions. IVs accounted for unobservable differences between facility and community LTC users. The survival-adjusted model allowed me to decompose the total effect of facility LTC on healthcare service use to a portion due to service intensity versus a portion due to survival differences.
Main treatment was use of facility LTC (). The first stage (eq1) predicted facility LTC based on included covariates and instrumental variables, as discussed in the conceptual model. X was a vector of the pre-disposing, enabling, and need characteristics listed in Table 3.2.
(eq1)
The second stage models estimated survival and healthcare use (̂. They included the residuals from eq1 (because all second stages incorporated non-linear estimation techniques)65 as well as the treatment of facility LTC ( and other pre-disposing, enabling, and need
characteristics () listed in Table 3.2 but excluded the instruments.
was uncensored, I estimated the period’s predicted healthcare service ̂, ! and the marginal effect of treatment on healthcare service $̂, ! $⁄ .66
In a survival model, the estimated healthcare service use in a given period for any individual is ̂ "# & ̂ 1 ( ̂), or the weighted sum of the utilization
conditional on survival to that period and death in that period. The total estimated utilization over the period ̂ is the sum of the period-specific estimates ̂ ∑ ̂+, . The marginal effect of a covariate in X—for example, receiving LTC in a facility—on ̂ can be broken down into individual effects on utilization due to survival differences (first curly bracket in eq 2) and service intensity (second curly bracket).67
$̂ $⁄ ∑ -. . . / 0
12#34
14 & ̂ 1 ( ̂)
"# 51671434 8̂ ( ̂9:
;
<"# 5 1=>?3144 81 ( 9 1=>@31A4 :B CD
D D E
+
, (eq2)
Each element of the marginal effect was calculated through the steps listed previously. The final step involved combining these estimates to calculate the total marginal effects (eq2), which was also presented as the two partial effects due to service intensity versus survival differences.
In all models, we used a two-staged residual inclusion technique, as mentioned previously.68 However, for the survival-adjusted models (all models except for readmission), we implemented a 2SRI-based strategy with two deviations from the typical approach. First, we used the residual in the probit space rather than the more common probability space, analogous to the inverse Mills ratio in a
classic Heckman model.69 Second, due to collinearity between the residual and the covariates (mean variance inflation factor >10), we had poorly behaved estimation algorithms. Thus, we simulated the residual by conducting multiple replications with a random draw from the standard normal distribution consistent with the parameter estimates. We simulated a value of > given the true value of
cause tests of endogeneity (such as the test of the significance of the residual term in the second stage) to fail to reject exogeneity when, in fact, endogeneity is present. Thus, we conducted a range of endogeneity tests and implemented models as IVs, to be conservative.
Aim 1: Analyses
I constructed two different second-stage models with similar structure and analysis for each but with different dependent variables (see Table 3.3). I constructed both models using Analytic File #1. The survival-adjusted approach described in the General Analytic Strategy was the same across both models. As mentioned in the general analytic approach, the instrumented variable was facility LTC. I applied a generalized linear model for both second-stage models. The dependent variable was expenditures on inpatient care in Model 1 and, for Model 2, expenditures on physician and
practitioner services (e.g., nurse practitioner, physical therapy, etc.), including outpatient labs. I bootstrapped 5,000 replications to obtain standard errors for both predicted services use and marginal effects of facility LTC.
Aim 2: Analysis
The approach, including the model specification, was the same as Aim 1 (see Table 3.3). For this Aim, I used Analytic File #1. Again, the instrumented variable was use of facility LTC. I applied a generalized linear model in the second stage. The dependent variable was Medicare expenditures on SNF, home health, and hospice care. I bootstrapped to obtain standard errors for both predicted service use and marginal effects of facility LTC.
Aim 3: Analyses
The third aim used instrumental variables to estimate the effect of facility LTC on potentially avoidable services use over time. I planned to estimate five different models with different dependent variables (see Table 3.3). In this aim, all dependent variables for ED visits, hospital observation days, and re-admissions were binary or count measures.
observation days in the sample, I was not able to implement the model for the observation days (model 4) and only modeled ED visits (model 5).
For models 6 and 7, I planned to use logistic regression to estimate the treatment’s effect on likelihood of 30-day and 60-day hospital readmission. Models 6 and 7 used Sample #2, which includes only those with a hospital admission. The logistic model specifies the likelihood of readmission as
ProbReadmit|XT 4U⁄1 4U, where T ( V T T W(eq6)
Again, X is a vector of pre-disposing, enabling, and need characteristics listed in Table 3.2. I bootstrapped to obtain standard errors for both predicted services use and marginal effects of facility LTC.
3.7. Sample Size and Statistical Power
For all aims, incident facility LTC users comprised the treatment group. Using the sampling frame explained earlier, I initially estimated that I would have roughly 1000 incident facility LTC person-year combinations. Although these numbers were roughly met (n=985), censoring due to HMO enrollment and admission to a psychiatric hospital reduced the treated group to n=864. Initial power calculations were made using the programs powerreg and powerlog for Stata 11.0. These analyses allow me to detect the required sample size to detect a minimum effect size—α=0.05 with power ≥ 80%. To change predictive accuracy of the R2=.01 from the addition of my key variable (facility LTC) with 30 control variables, I would need a sample size of 780 for continuous outcomes (spending). To detect a change in .05 predicted probability of a dichotomous outcome, I would need a sample size of 630. In both instances the estimated N of incident facility LTC person-year
combinations gives a sufficient sample size for Sample 1. For the dependent variable of
sufficiency of power, I included a composite outcome of death or readmiss for 30 day readmission up to 840 and for 60 day
Figure 3.1. Structure of Medicare Current Beneficiary Survey
sufficiency of power, I included a composite outcome of death or readmission, which increased cases up to 840 and for 60 day readmission up to 1,068.
Structure of Medicare Current Beneficiary Survey.
Figure 3.2. Sampling frame and exclusion c
Figure 3.3. Study period segmentation
. Sampling frame and exclusion criteria.
Table 3.1.
Dependent Variables and Source Files
Aim Dependent Variable Source Claims File Additional Notes
1
Medicare Acute Care
Expenditures Inpatient Medicare
Physician/Practitioner Expenditures
Physician
2 Medicare Sub-Acute Care Expenditures
SNF, Home Health, and Hospice
3
Number of ED Visits Outpatient Revenue center codes 450-459 or 981
Number of Hospital Observation Days
Outpatient and Inpatient
Revenue Center codes and HCPCS codes
Likelihood of 30-day
hospital readmissions Inpatient
Yale All-Cause Unplanned Hospital Readmission Likelihood of 60-day
hospital readmissions Inpatient
Yale All-Cause Hospital Readmission
Table 3.2. Covariates
Factors Affecting Health Care Use Variable Type
Predisposing Age Continuous
Gender Categorical
Marital Status Categorical
Education (Highest) Categorical
Race/Ethnicity Categorical
Enabling Medicaid Eligibility Categorical
Geographic Location (RUCA Codes) Categorical State LTC Spending (% Medicaid on HCBS, Medicaid
NF per diem) Continuous
Local LTC Supply (Hospital SNF counts by Zip Code) Continuous
Need Diagnoses Categorical
Cognitive Limitations Categorical
Charlson Comorbidity Index Continuous
ADLs Continuous
Table 3.3.
Second Stage Models
Model Specification
Aim Model Dependent Variable Second Stage Model Sample Restrictions
1
1 Medicare Acute Care Expenditures
Survival-adjusted Generalized
Linear Model None (Analytic File 1)
2
Medicare
Physician/Practitioner Expenditures
Survival-adjusted Generalized
Linear Model None (Analytic File 1)
2 3 Medicare Sub-Acute Care Expenditures
Survival-adjusted Generalized
Linear Model None (Analytic File 1)
3
4 Number of ED Visits Survival-adjusted Generalized
Linear Model None (Analytic File 1) 5 Number of Hospital
Observation Days
Survival-adjusted Generalized
Linear Model None (Analytic File 1) 6 Likelihood of 30-day
hospital readmissions Logit Model
Individuals with ≥1 hospital stay (Analytic File 2)
7 Likelihood of 60-day
hospital readmissions Logit Model
CHAPTER 4. AIM 1
4.1.
Introduction
Identifying strategies to bend the Medicare cost-curve is a significant and ongoing policy
concern.70,71 Medicare beneficiaries with disabilities are among the highest cost beneficiaries to Medicare, even after adjusting for comorbidity.72,73,74,75,76 Medicare beneficiaries with chronic conditions and
disabilities have higher spending than individuals with chronic conditions only, regardless of the number of comorbidities.77 Due to the disproportionate healthcare spending on this population, new policies and programs introduced under the Affordable Care Act (e.g., ACOs, the Community-based Care Transitions Program, etc.) will need to target older, disabled Medicare beneficiaries to achieve Medicare savings. However, to successfully reduce only excess healthcare use, policymakers must first understand what drives the outsized healthcare spending on this vulnerable population.
One important driver of healthcare costs among older Medicare beneficiaries with disabilities is long-term care (LTC) that helps with activities of daily activities (e.g., bathing, eating). LTC may be
delivered in community settings (e.g., patients’ homes) by paid or unpaid caregivers or in facilities such as nursing facilities (NF) and assisted living facilities (ALF). Although Medicare does not cover custodial facility-based LTC, LTC facilities have consistent, ongoing interactions with residents and likely influence their Medicare-covered healthcare use. Experimental demonstrations in the 1970s and 1980s found no difference in healthcare costs between those receiving community-based LTC versus NF care.78
However, since these demonstrations, changes in the financial environment for LTC facilities created new incentives for facility LTC providers to increase healthcare use by their residents. Given the new
Changing Environment for LTC Facilities since the 1980s
Since the Medicare experimental demonstrations that showed no difference in healthcare costs by LTC setting, several changes in the payment dynamics for LTC facilities may have increased
hospitalizations for facility LTC residents. First, prospective payment systems decreased hospital length of stays and increased reliance on sub-acute skilled nursing facility (SNF) care following hospitalization.79 Medicare paid well for these sub-acute services, particularly in the 1990s, and NFs began to focus on the relative profitability of Medicare reimbursement for sub-acute SNF care compared to Medicaid
reimbursement for traditional custodial NF care. As a result, from the late 1980s to the early 2000s, NFs increasingly focused on sub-acute care and revenue from SNF patients, despite Medicare policy changes that attempted to stem cost growth in this area.80 Receiving Medicare-covered SNF rehabilitation benefits required a qualifying 3-day hospitalization. Therefore, an incentive to shift patients from
Medicaid-reimbursed NF care to Medicare-Medicaid-reimbursed SNF care could have increased hospitalization rates among NF residents.
Second, many states implemented Medicaid bed-hold policies for custodial LTC, where Medicaid paid NFs to hold beds for enrollees admitted to the hospital. These bed-hold policies allowed NFs to receive payment from Medicaid without providing services. Although the payment protected residents from losing their spots, these bed-hold payments increased hospitalizations for NF residents.81,82
Third, the ALF market grew dramatically83 and Medicaid began paying ALFs for LTC services. ALFs substituted for NF services in certain patient populations.84 Additionally, ALFs faced incentives to increase hospitalizations of their residents, because ALFs often required continued private-pay payment when residents were hospitalized.85 Similar to the Medicaid bed-hold policy in NFs, continued payments without the costs of providing LTC created an incentive to hospitalize ALF residents. Finally, concerns about liability and physician accessibility and reimbursement may have created incentives for both NFs and ALFs to hospitalize patients.86
substituting professional) assessments of residents at 30- or 60-day intervals.87 Second, OBRA strengthened requirements for medical directors in LTC facilities (particularly NFs), which could lower barriers to physician care for those in LTC facilities relative to disabled individuals in the community. However, qualitative evidence suggests that LTC facility residents experienced minimal access to physicians,88 with monitoring by nursing staff substituting for physician care. Lower reimbursement, logistical difficulty in delivering care in LTC facilities,89 and the national decrease in the number of geriatricians being trained90 could have reduced the supply of physician services in LTC facilities. On balance, these factors may have canceled one another out and led to no effect of facility LTC use on Medicare expenditures on physician services.
Research on LTC Setting in the New Financial and Policy Environment
Since these changes, there has been limited research revisiting the effect of LTC setting on Medicare expenditures. The receipt of informal care decreased Medicare expenditures on acute services in the early 1990s.91,92 Other studies found that bed-hold policies were associated with higher
hospitalization rates among NF residents93,94 and, among dual eligibles, residence in NFs relative to the community increased their risk of hospitalization.95 However, researchers have not revisited the effect of facility LTC in the general LTC population, and none of these studies explicitly modeled the effects of mortality and its potential role in healthcare service use.
Given the urgency of scrutinizing Medicare costs and the changes in the LTC facility landscape, we examined whether and to what extent incident facility LTC affects Medicare expenditures for inpatient care and physician expenses. We hypothesized that, among older Medicare beneficiaries with disabilities, those receiving facility LTC would have higher Medicare expenditures for inpatient care but not for
physician care compared to those receiving community LTC.
4.2. Methods
We tested our hypothesis using an instrumental variables (IV) approach within a survival-adjusted model to account for (1) the likelihood of unobservable differences between facility LTC versus
Survival-Adjusted Model Construction
Because the population of interest had a non-trivial risk of death, end-of-life associated costs were an important component of their healthcare expenditures. Traditional modeling that predicts resource use when death is a competing risk, such as multinomial models, often treat death and healthcare service use as mutually exclusive outcomes, which they are not. Alternatively, researchers might exclude those who die, yet death may be on the pathway through which treatment affects costs. Healthcare costs around the time of death tend to increase, yet death also acts as a competing risk for healthcare use and can decrease healthcare costs because there is no opportunity to use services (and incur costs) after death.
Thus, we modeled Medicare expenditures using survival-adjusted methods that explicitly model the role of survival trajectories in healthcare service use. They also allow decomposition of a treatment effect on expenditures into two parts: (1) changes in patient survival and (2) intensity of service use.96,97 In brief, we estimated three different models: (1) a survival model for all person-periods in which the
beneficiary survived and was not censored using discrete-time survival methods and a probit model; this allowed us to calculate the hazard function for death , ! and the predicted probability of survival "#, !, as well as the marginal effect of facility LTC on each of these; (2) a generalized linear model
predicting expenditures conditional on death in that period, from which we generated the period’s
predicted expenditures ̂ , ! and the marginal effect of facility LTC on expenditures $̂, ! $⁄ ; and (3) a generalized linear model estimating expenditures conditional on survival in the period, from which we estimated the period’s predicted expenditures ̂, ! and the marginal effect of facility LTC on expenditures $̂, ! $⁄ . A modified Park Test was used to identify the correct family in the generalized linear models.
on expenditures due to survival differences (first curly bracket below) and service intensity (second curly bracket):
$̂ $⁄ X -. . . / Y Z [ Z \$"#
$ & ̂ 1 ( ̂)
"# ]$$ 8̂ ( ̂9^
_ Z ` Z a + ,
b"# ] $̂$ 81 ( 9 $̂$ ^c
C D D D E
Greater detail on the survival-model construction can be found at Basu & Manning (2010) and Federspiel et al. (2013). Marginal effects were bootstrapped using 5,000 replications to generate confidence
intervals.
Implementing IV
Another key challenge to this research was possible selection bias due to unobservable differences between incident users of facility LTC and those who received community LTC. To address these concerns, we used IVs to account for potential bias due to unobservable differences in the two groups. Valid IVs should be associated with the “treatment” (here, use of LTC facility) but not otherwise associated with the outcome (Medicare expenditures). We proposed three IVs. First, number of children has been used as an instrument to predict the effect of informal caregiving (a type of community LTC) on healthcare use.98,99,100 Second,we considered local supply of LTC facilities, including ALFs and
continuing care retirement communities (CCRC), and third, state-level spending on home-delivered meals (Meals on Wheels). These instruments should affect facility LTC service use but not healthcare use directly when controlling for local healthcare facility supply and state spending on home and community-based services (HCBS).101
Within the general framework of a survival-adjusted model, each model used IVs to adjust for unobserved confounding factors when comparing facility and community LTC users. The first stage predicted treatment (facility LTC, or FLTC) as a function of the IVs and X, a vector of the pre-disposing, enabling, and need characteristics listed in Table 4.1, using a probit model.
The three second-stage models were estimated, predicting survival and Medicare expenditures. Due to non-linear models in the second stage and a discrete endogenous variable, the IV analysis required the use of a two-stage residual inclusion (2SRI) method,102 in which the residuals from the first stage were included, as well as the treatment of facility LTC (W, and other pre-disposing, enabling, and need characteristics () listed in Table 4.1.
We implemented a 2SRI-based strategy, with two deviations from the typical approach. First, we used the residual in the probit space rather than the more common probability space, analogous to the inverse Mills ratio in a classic Heckman model103. Second, because collinearity between the residual and the covariates (mean variance inflation factor >10) led to poorly behaved estimation algorithms, we simulated the residual by conducting multiple replications with a random draw from the standard normal distribution consistent with the parameter estimates. See Appendix 1 for details.
Data Source and Sample
Information about individuals and their healthcare use came from the nationally representative 2000–2009 Medicare Current Beneficiary Survey (MCBS).104 Panels of beneficiaries are introduced annually and followed for four years. Information on LTC supply came from: (1) U.S. Census ZIP Code Business Patterns, which provided data on the local supply of LTC providers (CCRCs, ALFs, and NFs) in participants’ zip code area;105 (2) State Program Reports provided 2000–2009 state-level spending on home-delivered meals funded through Title III-C2 of the Older Americans Act of 1965, which we
translated into per capita amounts for the over-65 population;106 and (3) Medicaid payment rates for NFs and percent of Medicaid spending on HCBS came from the Brown University LTCFocus Web site. For the survival-adjusted analytic method, data files were constructed such that observations were person-months. Periods in our analysis were calendar months because the SSA-verified MCBS death date listed the calendar month of death.
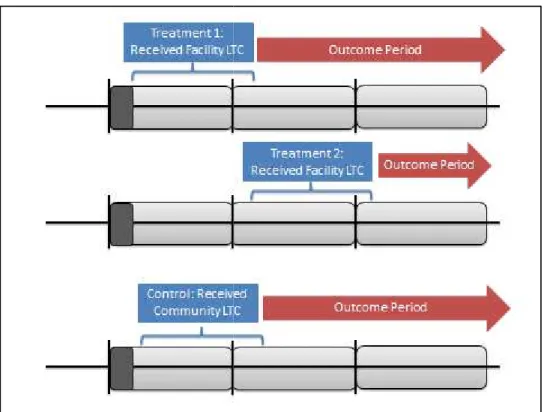
during the first treatment window; and (3) the outcome period started at the end of their treatment window and continued for a maximum 21 months—the outcome period was split into calendar months.
The sample was created by matching incident facility LTC users (treatment group) to community LTC users (controls). Beneficiaries were eligible if they were ages 50 and older, entered the MCBS living in the community, did not use facility LTC during the wash-out period, and used community LTC or facility LTC during the treatment window. Other exclusion criteria included residence in Puerto Rico, missing number of adult children, or individuals who had only an SNF stay during the wash-out period (meaning their SNF stay began before the beginning of the wash-out period and ended after it, so we could not see whether they had previously lived in an LTC facility).
Incident facility LTC use during a one-year treatment window constituted treatment (Figure 4.1). Incident facility use included a non-Medicare–paid stay in an NF or any stay in an ALF as indicated in the residence history file. Assisted living, board & care homes, domiciliary care facility, personal care
facilities, rest homes, and adult/group homes were all considered ALFs.
We matched each beneficiary receiving facility LTC to several similarly aged beneficiaries who received community LTC in the first treatment window (April 1, Year 1, to March 31, Year 2) and never went on to receive facility LTC. Community controls were age-matched to facility LTC users within three-year age-bins at a ratio of three community LTC controls for each facility LTC recipient. Individuals were censored due to death, HMO enrollment, or end of survey participation.