Abstract—We propose a new technique to generate a fully specified pre-computed low power test set in a deterministic BIST using simple gray counters within reasonable clock cycles. In our approach, only a small part of the circuit under test (CUT) is active, the rest of the CUT is fed with low leakage input patterns. Even the active part is fed by a gray counter which make the overall power consumption extremely low. The approach requires moderate number of reseeding and nominal hardware overload over pseudo random BIST using LFSR or CA. Moreover, instead of storing in the memory, the seed patterns can also be fed through a low cost, slow tester which allows us to efficiently combine a BIST with external testing using slower tester
Index Terms— Test per clock BIST, test set embedding, low power BIST, reseeding
I. INTRODUCTION
uilt-in Self Test (BIST) is being increasingly used today for large and complex chips. Based on the test application method, BIST can be classified into two types [1]: test-per-clock and test-per-scan. In test-per-clock method, a test pattern is applied to the CUT in every clock cycle and the test response is captured by a response analyzer. In test-per-scan scheme, a test pattern is serially loaded into the scan chain and then the pattern is applied to the CUT. Thus, for an n input circuit, n + 1 cycles are needed to apply a pattern [1]. Based on the pattern generation scheme, BIST can also be classified as pseudo-exhaustive [1], pseudo-random [1][2] and deterministic. Generally, in BIST solution, pseudo-random patterns are generated using LFSR or CA for detecting the random pattern detectable faults. For the random pattern resistant faults, techniques based on test point insertion [12], reseeding [3][13], bit flipping [14] or fixing [15], and weighted random pattern testing [16] have been proposed in literature. Another technique to test random pattern resistant faults is based on deterministic BIST.
In a deterministic BIST, it takes into account a pre-computed set of patterns and generates the patterns among other patterns. The most trivial way to do that is to store the patterns in a ROM [4] and apply one pattern in every clock cycle. However, the area overhead is extremely high. The solutions are: using a mapping logic between LFSR and CUT [5] or test set embedding [6]-[11].
S. Kundu is with the Indian Institute of Technology Kharagpur, West Bengal, India. (phone: +919831219984; fax: +91 3222 - 282264; e-mail: [email protected]).
S. Chattopadhyay is with the Indian Institute of Technology Kharagpur, West Bengal, India. (phone: +919831219984; fax: +91 3222 - 282264; e-mail: [email protected]).
In test set embedding, a large test set TS is produced in
such a way that a pre-computed test set TD is produced
within TS (|TD| ≤ |TS|). Several techniques have been
proposed for test embedding. In [6][7], use of binary counter as a pattern generator has been shown. They proposed two kinds of operations to minimize the cycle length. The first one is the preprocessing operation such as constant column elimination, identical column merging and complemented column merging. The second operation, known as basic operation, consists of column permutation and complementary column generation. In [7], counter reseeding and counter + ROM based approaches have been proposed. In [9][10] a twisted ring counter is used for test set embedding in a test per clock approach. In [8], test set embedding based on width compression has been proposed. A reconfigurable network, between the LFSR and scan chains, has been used for test set embedding in [11]. In [5], a phase shifter network based on XOR-tree has been used between LFSR and CUT to match the output of LFSR to that of a deterministic test set. All these approaches except [5] used unspecified pattern set (that is pattern with don’t care) for test set embedding.
In a different context, power consumption during testing is becoming one of the most important metric of testing because power consumption during testing is much higher than that of normal mode of operation [17][18]. High average power leads to high heat dissipation, which may damage chip or package and results in reliability degradation due to hot spots [19]. Peak power causes voltage drop and ground bounce. So, it is mandatory to consider power metric while proposing a test solution.
There are many approaches to reduce power consumption in BIST environment. These are - suitable seed selection [20], dual seed LFSR [21], and low transition random pattern generator [22] using a k (k being the number of LFSR cells) input AND gate and a T flip-flop. Another approach as proposed in [23][24] is vector filtering in which the patterns which do not detect any faults are filtered out or blocked from reaching the CUT.
In this paper, we propose a novel technique to embed a fully specified, power aware test pattern set in a BIST environment. The pattern set used is such that it consumes less leakage and dynamic power while applied to CUT. Initially, we tried to generate the whole test set using a single gray counter, that is, for an n input circuit, we assume that an n bit gray counter will generate the whole pattern set. But, the cycle length required in this case will be huge. So, we have performed a Particle Swarm Optimization (PSO) based column reordering and complement column generation technique over the original low power test set, to reduce the cycle length. Though, we have achieved
Embedding a Low Power Test Set for
Deterministic BIST using a Gray Counter
S. Kundu and S. Chattopadhyay
significant reduction in cycle length after PSO, the cycle length required to generate the whole test set together, is still very high. So, the test set, thus obtained has been broken into smaller subsets. Now, we try to embed each of these subsets one at a time. The subsets are broken depending on a fixed counter size in such a way that, for a particular subset, the number of inputs changing, is less than or equal to the size of the counter. Rest of the bits remains constant. When all the patterns have been applied, the next seed is loaded and the process continues until all patterns in the deterministic test set have been generated.
Rest of the paper is organized as follows:
Low power test set generation is discussed in Section II. Section III describes our proposed architecture. PSO based approach to minimize cycle length is described in Section IV. Algorithm for breaking the test set into smaller set is given in Section V. Experimental results have been noted in Section VI.
II. TEST PATTERN GENERATION
The test pattern generation is exactly same as proposed in [25]. We generate a test pattern for each collapsed faults using “–D 1” option in ATPG ATALANTA [29]. The set thus obtained is rich in don’t cares (test cubes). The don’t cares of the test cubes are filled to minimize leakage power using a Genetic Algorithm based approach as described in [26]. Then the same algorithm proposed in [25] is followed to obtain the almost minimal set which gives the same fault coverage as the original set. As observed in [25], the pattern set requires on an average 70.01% less dynamic power and 6.31% less leakage power compared to the compact pattern set generated by ATALANTA in its default mode. The test set thus obtained is our deterministic test set which we embed in a BIST environment.
III. PSO BASED APPROACH TO MINIMIZE CYCLE LENGTH
We perform the preprocessing operations like constant column removal, identical column merging, and complemented column merging, on the low power test set obtained from Section II. As described in [6][7], basic operations like column permutation and complementary column generation, can drastically reduce the cycle length for testing. The authors of the same paper have also proved that the problem is NP-hard. They proposed a hill climbing technique to solve this problem. We have used a PSO based approach for column permutation and complement column generation.
Particle Swarm Optimization (PSO) [27] is a population based stochastic technique developed by Eberhart and Kennedy in 1995. PSO is initialized with a group of particles with random position and searches for optima by updating their position through generations. In our case, the particle structure is as follows:
Particle {
int column_permutation[ No of Input ] ; int complemented_column[ No of Input ] ; }
Where column_permutation will be holding the column numbers in which they should appear in the final ordering and complemented_column tells us whether a column be
used in its original form or in complemented form. Let n be the number of inputs. Then, for a particle, column_permutation will be a permutation of numbers between 1 and n. complemented_column[i] will be either 0 or 1 for a particular input i ( 1 ≤ i ≤ n ) - 0 means the column will be used in its original format, 1 means complemented. The PSO algorithm starts with an initial random position of particles with random velocity. For our case, we start with an arbitrary ordering of columns and also random column type. We also include the original column permutation with all columns in its original form as a starting position of a particle. Over the iterations, the particles change their positions according to their velocity and attempt to achieve an optimal solution.
The new position of each particle is calculated using a set of swap operations over its old position. The details of swap operators are given in [28]. We follow the exact procedure as described in [28] for calculating the swap operators.
The fitness of each particle is calculated in terms of cycle length required to produce the entire test set using an n bit gray counter (n being the number of input). For a binary counter [6], the straight distance of a test set T is max(ri) -
min(ri), where ri’s are the values of the binary patterns of the
rows of T. The wraparound distance of T is 2n – max(r i– rj)
where ri and rjare consecutive row patterns in sorted order
and ri > rj.The cyclic distance of T is the minimum of its
straight and wraparound distances. For a gray code counter, calculating the straight and wraparound distance requires the knowledge of the pattern sequence generated by it. Given an n bit pattern, we should able to tell the sequence number in which the pattern will be produced starting from an initial pattern in a gray counter. For simplicity, we consider a reflected gray counter for generation of patterns starting from all 0 pattern. The following pseudo code is used to calculate the sequence number of a pattern in a reflected gray counter.
function calculate_sequence( int *patt ) {
if( patt[No_of_Input - 1] == 0 ) pos = 0 ;
else
pos = 1 ;
for( i = 2 ; i < No_of_Input ; i ++ ){ if( patt[No_of_Input - i] == 1 ) pos = 2i – 1 – pos ; }
Return pos; }
Where patt[No_of_Input] is the pattern for which the sequence number is to be calculated. Here patt[0] holds the most significant bit (MSB) and patt[ No of Input – 1] holds the least significant bit (LSB). Let us consider a 4 bit pattern 1010, then patt[3] = 1, patt[2] = 0 , patt[1] = 1 , and patt[0] = 0.
The algorithm will work as follows:
1010 will appear in 12th position in a reflected gray counter if we consider 0000 to be the 0th pattern.
Once the sequence of each pattern is known, it is a trivial work to find the cycle length. The patterns are sorted according to their sequence numbers. Then the same method as described for binary counter is used. The cycle length is used as a fitness for the particles and we are trying to minimize the cycle length in the PSO. The PSO results are shown in Table I.
We achieve on an average 52.2% reduction over original cycle length but as it can be seen from column 3; still the cycle length is very high. So it is not feasible to generate the entire pattern set in one run using an n bit gray counter, n being the number of input. The next section describes the algorithm for breaking the pattern set into smaller subsets. The table also notes CPU times needed in milliseconds.
TABLEI
RESULT OF PSO TO MINIMIZE CYCLE LENGTH
Circuit Original
cycle length
After PSO cycle length
% Reduction
Time ( in ms )
s208 196612 98307 50.0 0.89
s382 9078783 4194305 53.8 1.41
s400 6172 4373 29.1 1.11
s420 4.83E+09 2.15E+09 55.6 6.46
s510 16777521 8388618 50.0 9.84
s526 8696832 4194326 51.8 12.76
s641 4.6E+15 2.25E+15 51.1 93.76
s713 1.35E+16 4.5E+15 66.7 116.28
s820 4718607 2097492 55.5 16.13
s832 5172381 2117654 59.1 17.43
s838 5.53E+19 2.77E+19 50.0 53.05
s953 1.17E+11 3.44E+10 70.5 21.84
s1196 2.01E+09 5.37E+08 73.3 34.17
s1238 2.01E+09 5.37E+08 73.3 12.63
s1488 14683 10838 26.2 5.19
s1494 12291 10338 15.9 5.30
s1423 1.39E+27 6.19E+26 55.6 79.01
Avg. Reduction 52.2
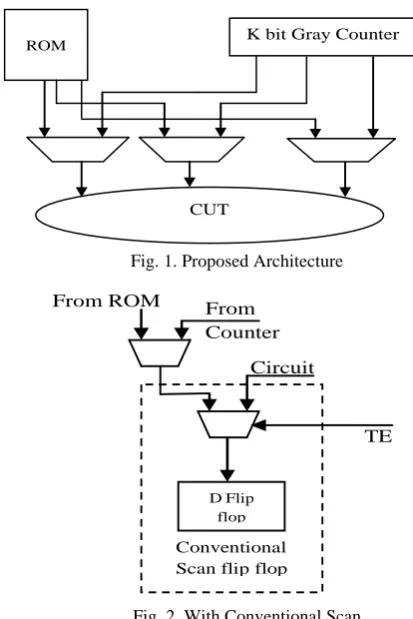
IV. PROPOSED ARCHITECTURE
The proposed architecture is shown in Fig. 1. For an n input circuit, we use a k bit gray counter. The rest n - k inputs will be fed directly from memory or from an external low cost, slow tester. For any seed, the n - k inputs are remaining constant for the entire cycle length of pattern generation. The changing k inputs are also fed using a gray counter. So the overall dynamic power consumption is very less. Another advantage of this approach is that the idle part of CUT is fed by low leakage patterns. This is because, as described in Section II, the don’t care bits of each pattern are filled to minimize leakage. So, the leakage power consumption of the CUT is also reduced.
The proposed approach is test per clock scheme where at each clock cycle one pattern is applied. The advantage of this approach is that it can also work with conventional scan design. In fig. 2, we show how it can be added with scan design. But in this case, the seeds have to be stored in the memory. Here, Mux 1 decides whether a constant value or gray counter value will be fed to a scan input. Mux 2 and the D flip-flop constitute the conventional scan D flops. Another advantage of this approach is that the multiplexers placed are not in the functional critical path and hence the maximum operating frequency for functional purpose does not get affected.
CUT
[image:3.595.313.520.46.356.2]ROM K bit Gray Counter
Fig. 1. Proposed Architecture
DFlip
flop
TE Circuit
From Counter From ROM
[image:3.595.46.292.266.485.2]Conventional Scan flip flop
Fig. 2. With Conventional Scan
The length of a counter depends not only on the nature of the circuit and its test set, but also on number of seeds to be stored in memory and the test cycles. As shown in the experimental result section, there is a good amount of tradeoff existing between counter length, number of seeds and also number of clock cycles required.
V. FINDING SMALLER SET
The objective here is to find a subset of the total set TD
depending on a predefined counter length (size) in such a way that the number of inputs changing in the smaller set should be less or equal to the counter length. Rest of the inputs remain constant for the entire subset. This process continues until we cover all the patterns in test set TD. The
algorithm takes as input the test set TD and an integer
Counter Length. To understand the algorithm, the following notation is required. Let t1 and t2be two test patterns, then
t1∩t2 is the set of inputs which have same values in both t1
and t2. We use a temporary set Tsub to hold the patterns in
one subset.
Algorithm: Finding sub set (Inputs: TD and Counter
Length)
Inputs: Test Set (TD) and Counter Length
Outputs: Subsets of TD depending on Counter Length
Step 1. For each pattern, find how many and what are the bit positions of it that matches with rest of the patterns. We define for each pattern, a variable, No_of_pattern_matching, which holds the value of the number of other patterns match that with this pattern with number of bit positions greater than or equal to the specified limit (Number of Input – Counter Length).
[image:3.595.45.292.268.481.2]memory and the algorithm terminates. Otherwise go to Step 3.
Step3. Find the pattern with maximum No_of_pattern_matching. Set Tsub = Null. Add the
pattern to Tsub.
Step 4. Find the pattern which matches in the maximum positions with t1∩t2∩…∩ti, where each ti is a
member of Tsub. If the number of matches is less
than (Number of Input – Counter Length), go to Step 6, otherwise go to Step 5.
Step 5. Let the pattern be tj. Add this pattern to Tsub, that is,
Tsub = Tsub U tj. Go to Step 4.
Step 6. The set Tsub thus obtained holds the patterns which
have at least (Number of Input – Counter Length) number of bits matching. Write Tsub in a file and set
TD = TD – Tsub and Tsub = Null. If TD is empty, then
the algorithm terminates, otherwise go to step 1. After generating the subsets, a proper seed for each set is selected. The seed selection is determined by the cycle length. Straight and wraparound distances for each set are calculated according to the method described in Section IV. If straight distance is less than wraparound distance, then the pattern with least sequence number is used as seed, otherwise, the initial pattern of wraparound sequence is used as seed.
For each file, one seed pattern is required. So the total number of seeds required is equal to the number of files generated plus the patterns obtained in Step 2.
VI. EXPERIMENTAL RESULTS
In this section, we apply our gray counter based BIST to medium and few large full scan version of ISCAS’89 benchmark circuits. It is very difficult to compare our result with other approaches because most of the test set embedding techniques [6]-[11] took test cubes as their deterministic test set. So, they have the advantage of specifying the don’t care bits in such a way that the cycle length comes down. The techniques show their results only for random pattern resistant faults. They assumed that all the random pattern detectable faults were detected by pseudo random testing using LFSR or CA within a number of pre-specified clock cycles. Also, the power consumed by their approaches is not shown.
Here, in this experiment, we consider a fully specified low power pattern set capable of detecting all the detectable faults in the CUT. In Table II, we show our result for test set embedding. Column 2 notes the counter size which is actually given as an input to the algorithm proposed in Section V. The 3rd column indicates the number of seed patterns required. These patterns can be directly stored in the ROM or a slow speed, low cost tester can be used to feed the patterns. Column 4 indicates the number of initial low power patterns and column 5 notes down the total number of clock cycles required to generate all the low power patterns in our method.
Since it is very difficult to directly compare our results with existing techniques, we define a variable named embedding efficiency and compare our results based on that. The embedding efficiency is defined as a ratio of initial number of patterns to the number of patterns required to
embed the initial set. Table III compares our result with [10].
TABLEII
TEST SET EMBEDDING RESULTS
Circuit Counter Length
# Seed
# patterns in Initial Set
# clock cycles required
s208 6 8 47 262
s382 7 8 60 473
s386 6 12 74 388
s400 7 6 61 352
s420 8 8 43 912
s510 7 12 67 586
s526 7 12 97 808
s641 9 19 143 4111
s713 9 23 136 4401
s820 7 18 120 940
s832 7 22 115 866
s838 10 27 219 11043
s953 10 15 99 6065
s1196 8 27 188 3072
s1238 8 28 193 3222
s1423 12 25 185 37999
s1488 6 23 129 622
s1494 6 21 124 577
s5378 16 51 654 1355127
s9234 20 52 931 22489934
TABLE III
COMPARISON WITH [10]
Circuit
Embedding efficiency
of our method
As proposed in [10]
# patterns in Initial
Set
# clock cycles required
Embedding efficiency
of [10]
s208 0.1794 - - -
s382 0.1268 - - -
s386 0.1907 102 2184 0.0467 s400 0.1733 96 2400 0.0400 s420 0.0471 129 20160 0.0064 s510 0.1143 103 6500 0.0158 s526 0.1200 160 8400 0.0191 s641 0.0348 200 53460 0.0037 s713 0.0309 192 45792 0.0042 s820 0.1277 195 9936 0.0196
s832 0.1328 - - -
s838 0.0198 257 136680 0.0019 s953 0.0163 227 37260 0.0061 s1196 0.0612 291 35904 0.0081 s1238 0.0599 164 33792 0.0049
s1423 0.0049 - - -
s1488 0.2074 - - -
s1494 0.2149 - - -
s5378 0.0005 - - -
s9234 4.14E-05 1521 4042896 0.0004
Avg. 0.0931 0.0136
Embedding efficiency of our method can be easily calculated by taking the ratio of column 4 and column 5 of Table 2. As it can be seen from Table 3, our embedding efficiency is much higher than the technique proposed by [10] even considering the fact that out test set does not contain any don’t cares.
From Table IV, we can see that as the counter length increases, number of seed required decreases but the embedding test length increases. This is expected because when the counter length is high, more number of original test patterns are grouped together as the number of column (No of Input – counter length) they should match, is less. The increase in number clock cycles with counter size is obvious because each bit increase in counter size, will result in double cycle length compare to its smaller size. Thus, it is extremely important to find a good counter length for each circuit. Here, we don’t propose any algorithm to find a suitable counter length for each circuit. We perform the same experiment with every circuit and choose a value empirically performing a tradeoff between cycle length and number of seeds.
TABLE IV
TRADEOFF RESULT FOR S1423 FOR DIFFERENT COUNTER SIZE
Counter Length
Number of Seeds required
Emb. Test Length
Emb. Efficie-ncy
Power ( per pattern ) Dyn. (trans)
Leak. (uw)
6 55 954 0.1939 31.87 14.47
7 50 1614 0.1146 25.34 14.46
8 42 3938 0.0470 24.74 14.48
9 39 4974 0.0372 22.28 14.51
10 32 9876 0.0187 22.03 14.51
11 30 16521 0.0112 23.02 14.41
12 25 37999 0.0049 23.00 14.62
13 24 61516 0.0037 25.30 14.55
14 21 122329 0.0015 29.49 14.60
15 21 175905 0.0011 29.31 14.76
16 19 470209 0.0004 24.62 14.34
Colum 4 of Table IV shows the embedding efficiency for each counter length. The power results are shown in Column 5 and 6. Column 5 shows dynamic power consumption in terms of average number of transitions. It is calculated by dividing total circuit transitions by the number of patterns. Leakage power results in micro watt are given in column 6. As it can be seen from column 5 and 6, the variation in both types of power is not much. But the total energy required will vary according to the test length.
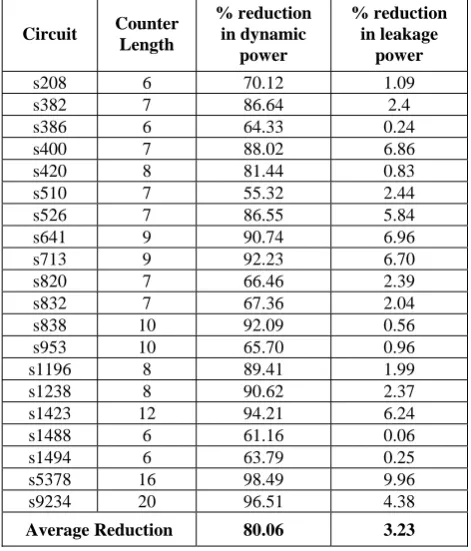
Table V shows the power consumption results produced by our method. We compare our result with LFSR based pseudo random testing technique. For an n bit circuit, we used an n bit LFSR with primitive polynomial configuration for pseudo random pattern generation.
The counter size for each circuit is given in column 2 of Table V. In this experiment, we use the same counter size given in Table II. Column 3 of Table V shows the dynamic power reduction and column 4 lists the leakage power reduction. For circuits with very high number of patterns, only the first 20,000 patterns are applied and average power per pattern is obtained. Since, the proposed scheme is a test per clock approach, power per pattern can be used as a metric. From Table V, it is evident that we have achieved high reduction in dynamic power. This is because in our case only a small part of the circuit is active. The rest of the circuit is fed by a constant pattern. The active part is also fed by a gray counter. So, the overall dynamic power is extremely low. We achieved on an average 80.06% reduction in case of dynamic power and 3.23% reduction in case of leakage power. The maximum reduction is achieved for dynamic power is 98.49% for circuit s5378. We
achieved a maximum leakage reduction of 9.96% also for circuit s5378.
We performed our simulation on a Pentium IV machine running at 3 GHz with 1 GB main memory. The CPU time taken by our method is extremely low, in order of few milliseconds. So we do not report it separately.
TABLE V
REDUCTION IN POWER WITH RESPECT LFSR BASED APPROACH
Circuit Counter Length
% reduction in dynamic
power
% reduction in leakage
power
s208 6 70.12 1.09
s382 7 86.64 2.4
s386 6 64.33 0.24
s400 7 88.02 6.86
s420 8 81.44 0.83
s510 7 55.32 2.44
s526 7 86.55 5.84
s641 9 90.74 6.96
s713 9 92.23 6.70
s820 7 66.46 2.39
s832 7 67.36 2.04
s838 10 92.09 0.56
s953 10 65.70 0.96
s1196 8 89.41 1.99
s1238 8 90.62 2.37
s1423 12 94.21 6.24
s1488 6 61.16 0.06
s1494 6 63.79 0.25
s5378 16 98.49 9.96
s9234 20 96.51 4.38
Average Reduction 80.06 3.23
In Table VI, we have compared our approach with two other low power BIST methods, LT-RTPG [22] and transition-monitoring window based approach as proposed in [30]. The reduction in dynamic power and the corresponding fault coverage achieved by the respective methods are also shown in the table. We have used the results obtained in [30] by using (LFSR=16 and TMW=8) which gives the best reduction in power by their approach. As it can be seen from the table, our method shows much higher saving than both the two techniques. Our fault coverage is also higher compared to both the methods. Our method is also suitable for leakage power reduction whereas the other two methods did not consider leakage power in to account.
VII. CONCLUSION
In this paper, we have proposed a novel BIST architecture using a gray counter based approach in such a way that within a moderate clock cycle, a fully specified, low power test set can be embedded. This approach successfully bridges two different aspects of BIST – test set embedding and low power testing. We achieved 80.06% reduction in dynamic power in comparison with pseudorandom testing using LFSR. We also achieved 3.23% reduction in leakage power.
[image:5.595.309.545.150.426.2]bits are coming from a gray counter). So, the hamming distance between successive patterns is higher than one only when the two patterns are from two different sets. So, an ordering between the pattern sets can be done to minimize the dynamic power. Further, we can reduce the peak power by this method.
Another work still left is to find a proper choice of test length. We are trying to formulate an algorithm for finding the proper counter length depending on the number of seeds and embedding cycle length.
The hardware overhead of the approach is not high. The only overhead is storing the seed patterns and that of the multiplexers.
REFERENCES
[1] M. Abramovici, M.A. Breuer, and A.D. Friedman, Digital Systems Testing and Testable Design, New York: Computer Science Press, 1990.
[2] P. Bardell, W. McAnney, and J. Savir, Built-in Test for VLSI.Pseudorandom Techniques, New York, NY: John Wiley, 1987. [3] A. A. Al-Yamani and E. J. McCluskey, “Seed encoding with LFSRs
and cellular automata,” in Proc. of ACM/IEEE Design Automation Conf., 2003, pp. 560–565.
[4] V.K. Agarwal, and E. Cerny, “Store and Generate Built-In Testing Approach”, in Proc. of Int. Symp. Fault-Tolerant Computing, pp. 35-40, 1981.
[5] M. Bellos, D. Kargaris, and D. Nikolos, “Test Set Embedding Based on Phase Shifters,” in Proc. of IEEE Computer Society Annual Symp. on VLSI, pp. 155, 2003.
[6] D. Kagaris, S. Tragoudas, and A. Majumdar, “On the Use of Counters for Reproducing Deterministic Test Sets,” IEEE Trans. Comp., vol 45, No. 12,pp. 1405-1419, Dec. 1996.
[7] D. Kagaris, and S. Tragoudas, “On the Design of Optimal Counter-Based Schemes for Test Set Embedding,” IEEE Trans. CAD, vol. 18, No. 2, pp. 219-230, Feb. 1999.
[8] K. Chakrabarty, and S.R. Das, “Test-Set Embedding Based on Width Compression for Mixed-Mode BIST,” IEEE Trans. Instrumentation and Measurement, vol. 49, No. 3, pp. 671-678, Jun. 2000.
[9] K. Chakrabarty, B.T. Murray, and V. Iyengar, “Built-In Test Pattern Generation for High-Performance Circuits Using Twisted-Ring Counters,” in Proc. of 17th IEEE VLSI Test Symp., pp. 22-27, 1999.
[10] S.Swaminathan, and K. Chakrabarty, “On Using Twisted-Ring Counters for Test Set Embedding in BIST,” JETTA, vol.17, No. 6, pp. 529-542, Dec. 2001.
[11] L. Li and K. Chakrabarty, “Test set embedding for deterministic BISTusing a reconfigurable interconnection network,” IEEE Trans. Comput.-Aided Design Integr. Circuits Syst., vol. 23, no. 9, pp. 1289– 1305, Sep. 2004.
[12] C. Schotten and H. Meyr, “Test point insertion for an area efficient BIST,” in Proc. of Int. Test Conf., 1995, pp. 515–523.
[13]S. Hellebrand, H.-G. Liang, and H.-J. Wunderlich, “A mixed-mode BIST scheme based on reseeding of folding counters,” in Proc. of Int. Test Conf., 2000, pp. 778–784.
[14] H.-J. Wunderlich and G. Kiefer, “Bit-flipping BIST,” in Proc. of Int. Conf. Computer-Aided Design, 1996, pp. 337–343.
[15] W. Li, C. Yu, S. M. Reddy, and I. Pomeranz, “A scan BIST generation method using a Markov source and partial bit-fixing,” in Proc. of ACM/IEEE Design Automation Conf., 2003, pp. 554–559. [16] S. Wang, “Low hardware overhead scan based 3-weight weighted
random BIST,” in Proc. of Int. Test Conf., 2001, pp. 868–877. [17] J P. Girard, “Survey of Low-power Testing of VLSI Circuits,” IEEE
Design & Test of Computers, vol. 19, no. 3, pp. 80–90, 2002. [18] Y. Zorian, “A Distributed BIST Control Scheme for Complex VLSI
Devices,” in Proc. of VLSI Test Symp., pp. 4-9, 1993.
[19] N. Nicolici and X. Wen, “Embedded Tutorial on Low Power Test,” in Proc. of ETS., pp. 202-207, 2007.
[20] P. Girard, L. Guiller, C. Landrault, S. Pravossoudovitch, J. Figueras,S. Manich, P. Teixeira, and M. Santos, “Low energy BIST design: Impact of the LFSRTPG parameters on the weighted switching activity,” in Proc. of Int. Symp. on Circuits and Systems, CD-ROM Proceedings, June 1999.
[21] S. Wang and S. K. Gupta, “DS-LFSR: A new BIST TPG for low heat dissipation,” in Proc. of Int. Test Conf., pp. 848–857, November 1997. [22] S. Wang and S. K. Gupta, “LT-RTPG: A new test-per-scan BIST TPG for low heat dissipation,” in Proc. of Int. Test Conf., pp. 85–94, September 1999.
[23] P. Girard, L. Guiller, C. Landrault, and S. Pravossoudovitch, “A TestVector Inhibiting Technique for LowEnergy BIST Design,” in Proc. of VLSI Test Symp., April 1999, pp. 407–412.
[24] S. Manich , A. Gabarró , M. Lopez , J. Figueras , P. Girard , L. Guiller , C. Landrault , S. Pravossoudovitch , P. Teixeira , M. Santos, “Low Power BIST by Filtering Non-Detecting Vectors,” Journal of Electronic Testing: Theory and Applications, vol. 16 n.3, p.193-202, June 2000.
[25] S. Kundu, Krishna K.S, and S.Chattopadhyay, “Test Pattern Selection and Customization Targeting Reduced Dynamic and Leakage Power Consumption," in Proc. of Asian Test Symp., CD-ROM Proceedings, November 2009.
[26] S. Kundu and S. Chattopadhyay, “Scan-chain masking technique for low power circuit testing,” in Proc. of ASQED, pp. 183-188,July 2009.
[27] Kennedy I. and Eberhart R. C., “Particle swarm optimization,” in Proc. of IEEE International Conference on Neural Networks, Piscataway, NJ. pp.1942-1948, 1995.
[28] K.-P. Wang, L. Huang, C.-G. Zhou, and W. Pang, “Particle swarm optimization for traveling salesman problem,” in Proc. of Int. Conf. on Machine Learning and Cybernetics, vol. 3, pp. 1583–1585, Shanghai, China, August 2003.
[29] H. Lee and D. Ha, “On the Generation of Test Patterns for Combinational Circuits,” Tech. Rep. 12-93, Dept. of Electrical Engg., Virginia Polytechnic Institute and State University, 1993.
[30] Y. Kim, M-H. Wang, Y. Lee and S. Kang, “A New Low Power Test Pattern Generator using a Transition Monitoring Window based on BIST Architecture,” in Proc. of Asian Test Symposium, pp. 230–235, Dec. 2005.
TABLE VI
COMPARISON WITH OTHER LOW POWER BIST METHODS
Circuit
LT-RTPG [22] Transition-Monitoring Window [30] By Our Method
%red. in
dynamic power Fault Coverage
%red. in dynamic
power Fault Coverage
%red. in dynamic power
Fault Coverage
s838 33.1 89.92 66.3 97.62 92.09 100.00
s953 34.5 96.16 65.9 95.04 65.70 100.00
s1196 20.4 95.53 64.3 96.71 89.41 100.00
s1423 30.9 98.42 68.8 98.17 94.21 99.08
s5378 27.0 98.74 65.2 95.04 98.49 99.12