The Second Multilingual Surface Realisation Shared Task (SR’19):
Overview and Evaluation Results
Simon Mille UPF, Barcelona [email protected]
Anja Belz University of Brighton [email protected]
Bernd Bohnet Google Inc.
Yvette Graham
ADAPT Research Centre, DCU [email protected]
Leo Wanner
ICREA and UPF, Barcelona [email protected]
Abstract
We report results from the SR’19 Shared Task, the second edition of a multilingual sur-face realisation task organised as part of the EMNLP’19 Workshop on Multilingual Sur-face Realisation. As in SR’18, the shared task comprised two different tracks: (a) a Shallow Track where the inputs were full UD structures with word order information removed and to-kens lemmatised; and (b) a Deep Track where additionally, functional words and morpholog-ical information were removed. The Shallow Track was offered in 11, and the Deep Track in three languages. Systems were evaluated (a) automatically, using a range of intrinsic metrics, and (b) by human judges in terms of readability and meaning similarity to a refer-ence. This report presents the evaluation re-sults, along with descriptions of the SR’19 tracks, data and evaluation methods, as well as brief summaries of the participating systems. For full descriptions of the participating sys-tems, please see the separate system reports elsewhere in this volume.
1 Introduction and Task Overview
Following the success of the First Multilin-gual Surface Realisation Shared Task in 2018 (SR’18), which had the goal to stimulate the ex-ploration of advanced neural models for multi-lingual sentence generation from Universal De-pendency (UD) structures,1 the second edition of the task (SR’19) aims to build on last year’s re-sults and achieve further progress. While Natural Language Generation (NLG) has been gaining in-creasing attention from NLP researchers, it con-tinues to be a smaller field than e.g. parsing, text classification, sentiment analysis, etc. Universal dependencies are also enjoying increasing atten-tion: the number of UD treebanks is continuously
1http://universaldependencies.org/
growing, as is their size (and thus the volume of available training material).2
The SR tasks require participating systems to generate sentences from structures at the level of abstraction of outputs produced by state-of-the-art parsing. In order to promote linkage with pars-ing and earlier stages of generation, participants are encouraged to explore the extent to which neu-ral network parsing algorithms can be reversed for generation. As was the case with its predecessor tasks SR’11 (Belz et al.,2011) and SR’18 (Mille et al., 2018), SR’19 comprises two tracks distin-guished by the level of specificity of the inputs:
Shallow Track (T1): This track starts from UD structures in which most of the word order infor-mation has been removed and tokens have been lemmatised. In other words, it starts from un-ordered dependency trees with lemmatised nodes that hold PoS tags and morphological information as found in the original treebank annotations. The task in this track therefore amounts to determining the word order and inflecting words.
Deep Track (T2): This track starts from UD structures from which functional words (in partic-ular, auxiliaries, functional prepositions and con-junctions) and surface-oriented morphological and syntactic information have additionally been re-moved. The task in the Deep Track thus also involves reintroduction of functional words and morphological features, in addition to what is re-quired for the Shallow Track.
The training and development data for both tracks and the evaluation scripts were released on April 5th 2019, the training data on August 3rd 2019 and the outputs were collected two weeks later on August 19th; the teams had up to 4 months to
velop their systems.3 Compared to SR’18, SR’19 has a broader variety of languages hence even more emphasis on multilinguality, with 11 lan-guages from 9 language families:4 Arabic (Afro-Asiatic), Chinese (Sino-Tibetan), English (Ger-manic), French, Portuguese and Spanish (Italic), Hindi (Indo-Iranian), Indonesian (Austronesian), Japanese (Japonic), Korean (Koreanic) and Rus-sian (Balto-Slavic). This reflects a trend in NLP towards taking into account increasing numbers of languages for the validation of developed models; see e.g., SIGMORPHON 2019, which addressed crosslingual inflection generation in 100 language pairs.5
In the remainder of this paper, we describe the Shallow and Deep Track data (Section2), and the evaluation methods we used to evaluate submit-ted systems (Sections3.1and3.2). We then intro-duce the participating systems briefly (Section4), report and discuss evaluation results (Section 5), and conclude with some discussion and a look to the future (Section6).
2 Data
2.1 Overview of datasets and additional resources
In order to create the SR’19 training, development and test sets, we used as data sources 20 UD tree-banks6 for which annotations of reasonable qual-ity were available, providing PoS tags and mor-phologically relevant markup (number, tense, ver-bal finiteness, etc.). Unlike in SR’18, several tree-banks were available for some languages, enabling us to use out-of-domain as well as silver standard datasets as additional test data (for details see Sec-tion2.3). Table1gives an overview of the variety and sizes of the datasets.
Teams were allowed to build models trained on any SR’19 dataset(s) of their choice, but not exter-nal task-specific data. Other resources were, how-ever, permissible. For example, available parsers such as UUParser (Smith et al., 2018) could be run to create a silver standard versions of provided datasets and use them as additional or alternative training material, and publicly available
off-the-3
In the case of one team, we agreed to move the two week window between test data release and submission to one week earlier.
4
At SR’18, there were ten languages from five families. 5
https://www.aclweb.org/portal/ content/sigmorphon-shared-task-2019
6universaldependencies.org
shelf language models such as GPT-2 (Radford et al., 2019), ELMo (Peters et al., 2018), poly-glot (Al-Rfou et al.,2013) or BERT (Devlin et al., 2018) could be fine-tuned with publicly available datasets such as WikiText (Merity et al., 2016) or the DeepMind Q&A Dataset (Hermann et al., 2015).
Datasets were created for 11 languages in the Shallow Track, and for three of those languages, namely English, French and Spanish, in the Deep Track. As in 2018, Shallow Track inputs were generated with the aid of Python scripts from the original UD structures, this time using all avail-able input sentences. Deep Track inputs were then generated by automatically processing the Shallow Track structures using a series of graph-transduction grammars covering steps 5–11 in Section 2.2 below. In the training data, there is a node-to-node correspondence between the deep and shallow input structures, and they are both aligned with the original UD structures. We used only information found in the UD syntactic struc-tures to create the deep inputs, and tried to keep their structure simple. Moreover, words were not disambiguated, full prepositions may be missing, and some argument relations may be underspeci-fied or missing.
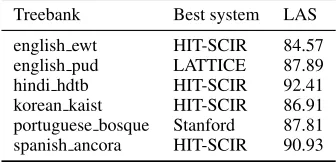
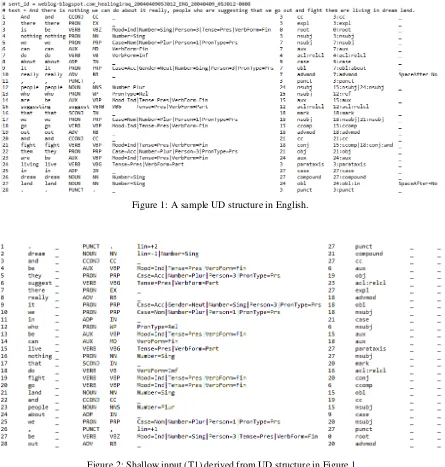
Structures for both Shallow and Deep Tracks are trees, and are released in a slightly modified CoNLL-U format, comprising the following ten columns: [1] Position, [2] Lemma, [3] Wordform, [4] PoS, [5] Fine-grained PoS (if available), [6] Features (FEATS), [7] governor, [8] dependency relation, [9] additional dependency information, and [10] metadata.7 Figure1shows a sample orig-inal UD annotation for English; the corresponding shallow and deep input structures derived from it are shown in Figures2and3, respectively (the last two columns are empty for the task).
2.2 Task data creation
To create the data for the Shallow Track, the orig-inal UD data was processed as follows:
1. Word order information was removed by ran-domised scrambling, but in the training data, the alignment with the original position of each word in the sentence was maintained via a feature in theFEATScolumn;
7http://universaldependencies.org/
Data type Dataset Track train dev test
In-domain
arabic padt (ar) T1 6,075 909 680 chinese gsd (zh) T1 3,997 500 500 english ewt (en) T1, T2 12,543 2,002 2,077 english gum (en) T1, T2 2,914 707 778 english lines (en) T1, T2 2,738 912 914 english partut (en) T1, T2 1,781 156 153 french gsd (fr) T1, T2 14,450 1,476 416 french partut (fr) T1, T2 803 107 110 french sequoia (fr) T1, T2 2,231 412 456 hindi hdtb (hi) T1 13,304 1,659 1,684 indonesian gsd (id) T1 4,477 559 557 japanese gsd (ja) T1 7,133 511 551 korean gsd (ko) T1 4,400 950 989 korean kaist (ko) T1 23,010 2,066 2,287 portuguese bosque (pt) T1 8,328 560 477 portuguese gsd (pt) T1 9,664 1,210 1,204 russian gsd (ru) T1 3,850 579 601 russian syntagrus (ru) T1 48,814 6,584 6,491 spanish ancora (es) T1, T2 14,305 1,654 1,721 spanish gsd (es) T1, T2 14,187 1,400 426
Out-of-domain
english pud (en) T1, T2 - - 1,000 japanese pud (ja) T1 - - 1,000 russian pud (ru) T1 - - 1,000
Automatically parsed
[image:3.595.130.465.63.388.2]english ewt-HIT (en) T1, T2 - - 1,795 english pud-LAT (en) T1, T2 - - 1,032 hindi hdtb-HIT (hi) T1 - - 1,675 korean kaist-HIT (ko) T1 - - 2,287 portuguese bosque-Sta (pt) T1 - - 471 spanish ancora-HIT (es) T1, T2 - - 1,723
Table 1: SR’19 dataset sizes for training, development and test sets (number of sentences).
2. Missing lemmas were added in the file, since in some cases the lemma value was empty (e.g. Portuguese-gsd dataset) or generalised (e.g. @card@ or @ord@ for cardinal and or-dinal numbers in the English-gum dataset);8
3. The lines corresponding to combined lexi-cal units (e.g. Spanish “del” <de+el> lit. ’of.the’) and the contents of columns [9] and [10] were removed;
4. Information about the relative order of com-ponents of named entities, multiple coordina-tions and punctuation signs was added in the
FEATS column (dependency relations com-pound, compound:prt, compound:svc, flat,
flat:foreign,flat:name,fixed,conj,punct);
For the Deep Track, the following steps were ad-ditionally carried out:
5. Edge labels were generalised into pred-icate/argument labels, in the Prop-Bank/NomBank (Palmer et al., 2005; Meyers et al., 2004) fashion. That is, the
8Thank you to Guy Lapalme for spotting this.
syntactic relations were mapped to core (A1, A2, etc.) and non-core (AM) labels, applying the following rules: (i) the first argument is always labeled A1 (i.e. there is no external argument A0); (ii) in order to maintain the tree structure and account for some cases of shared arguments, there can be inverted argument relations; (iii) all modifier edges are assigned the same generic labelAM; (iv) there is a coordinating relation. See also the inventory of relations in Table2.
6. Functional prepositions and conjunctions in argument position (i.e. prepositions and con-junctions that can be inferred from other lexi-cal units or from the syntactic structure) were removed (e.g. about and that in Figure 2); prepositions and conjunctions retained in the deep representation can be found under a
A2INV dependency; a dependency pathGov AM→Dep A2INV→Prepis equivalent to a predicate (the conjunction/preposition) with 2 arguments:Gov←A1 Prep A2→Dep.
at-Deep label Description Example
A1, A2, ..., A6 nth argument of a predicate fall→the ball A1INV, ..., A6INV nth inverted argument of a predicate the ball→fall AM/AMINV (i) none of governor or dependent are argument of the other fall→last night
(ii) unknown argument slot
LIST List of elements fall→[and] bounce NAME Part of a name Tower→Eiffel
DEP Undefined dependent N/A
Table 2: Deep labels.
tribute/value pairs, as were definiteness tures, and the universal aspect and mood fea-tures9, see examples in Figure3.
8. Subject and object relative pronouns directly linked to the main relative verb were re-moved (instead, the verb was linked to the an-tecedent of the pronoun); a dummy pronoun node for the subject was added if an origi-nally finite verb had no first argument and no available argument to build a passive; for a pro-drop language such as Spanish, a dummy pronoun was added if the first argument was missing.
9. Surface-level morphologically relevant infor-mation as prescribed by syntactic structure or agreement (such as verbal finiteness or ver-bal number) was removed, whereas semantic-level information such as nominal number and verbal tense was retained.
10. Fine-grained PoS labels found in some tree-banks (see e.g. column 5 in Figure 2) were removed, and only coarse-grained ones were retained (column 4 in Figures2and3).
11. In the training data, the alignments with the tokens of the Shallow Track structures were added in theFEATScolumn.
Figure3shows an example Deep Track input that corresponds to the original and shallow structures in Figures1and2.
2.3 Additional test data
For additional test data, we used automatically produced UD parses, which we then processed in the same way as the gold-standard structures, us-ing the best parsers from the CoNLL’18 shared task on the dataset in question.10 We used the
9http://universaldependencies.org/u/
feat/index.html
10See the rankings per treebanks at https:
//universaldependencies.org/conll18/ results-las.html.
UD2.3 version of the dataset, whereas CoNLL’18 used UD2.2; we selected treebanks that had not undergone major updates from one version to the next according to their README files on the UD site, and for which the best available parse reached a Labeled Attachment Score of 85 and over.11 There were datasets meeting these criteria for En-glish (2), Hindi, Korean, Portuguese and Spanish; the Harbin HIT-SCIR parser (Che et al.,2017) had best scores on four of these datasets; LATTICE (Lim et al., 2018) and Stanford (Qi et al., 2019) had the best scores for the remaining two;12 see Table3for an overview.
As is the case for all test data, in the additional automatically parsed test data alignments with sur-face tokens and with Shallow Track tokens are not provided; however, in the cases described in 4 above, the relative order is provided.
Treebank Best system LAS
[image:4.595.331.499.453.534.2]english ewt HIT-SCIR 84.57 english pud LATTICE 87.89 hindi hdtb HIT-SCIR 92.41 korean kaist HIT-SCIR 86.91 portuguese bosque Stanford 87.81 spanish ancora HIT-SCIR 90.93
Table 3: The 6 combinations of dataset and parser out-puts selected for the automatically parsed test set.
2.4 Data formats for evaluations
Unlike in SR’18, where detokenised outputs only were used, the SR’19 teams were asked to pro-vide tokenised (for automatic evaluations) as well as detokenised (for human evaluations) outputs; if no detokenised outputs were provided, the to-kenised files were also used for the human
evalu-11The best score on the English-EWT dataset is slightly be-low this threshold (84.57), but the dataset was selected any-way because English was expected to be the language most addressed by the participants.
Figure 1: A sample UD structure in English.
Figure 2: Shallow input (T1) derived from UD structure in Figure1
.
ation. The reason for using tokenised outputs for automatic evaluation is the inclusion of languages like Chinese and Japanese where sentences are se-quences of characters with no white-space separa-tors. Two of the metrics used in automatic eval-uations, BLEU and NIST, compute scores based on matching sequences of characters; if there is no whitespace, the whole sentence is the sequence that is used for matching. As a result, one single different character in a sentence would prevent a match with the reference sentence, and a null score would be assigned to the whole sentence. The fol-lowing example shows a Spanish sentence in its tokenised and detokenised forms:
• Tokenised sample (Spanish): All tokens are preceded by a white space.
El´ıas Jaua , miembro del Congresillo , con-sidera que los nuevos miembros del CNE deben tener experiencia para “ dirigir pro-cesos complejos ” .
• Detokenised sample (Spanish): White spaces before or after some punctuation signs are re-moved.
El´ıas Jaua, miembro del Congresillo, con-sidera que los nuevos miembros del CNE deben tener experiencia para “dirigir proce-sos complejos”.
In the original UD files, the reference sentences are by default detokenised. In order to carry out the evaluations of the tokenised outputs, we built a tokenised version of the reference sentences by concatenating the words of the second column of the UD structures (see Figure 1) separated by a whitespace.
3 Evaluation Methods
3.1 Automatic methods
We used BLEU, NIST, and inverse normalised character-based string-edit distance (referred to as DIST, for short, below) to assess submitted sys-tems. BLEU (Papineni et al.,2002) is a precision metric that computes the geometric mean of the
n-gram precisions between generated text and ref-erence texts and adds a brevity penalty for shorter sentences. We use the smoothed version and re-port results forn= 4.
NIST13 is a related n-gram similarity metric
13http://www.itl.nist.gov/iad/mig/
tests/mt/doc/ngram-study.pdf; http:// www.itl.nist.gov/iad/mig/tests/mt/2009/
weighted in favor of less frequent n-grams which are taken to be more informative.
DIST starts by computing the minimum num-ber of character inserts, deletes and substitutions (all at cost 1) required to turn the system output into the (single) reference text. The resulting num-ber is then divided by the numnum-ber of characters in the reference text, and finally subtracted from 1, in order to align with the other metrics. Spaces and punctuation marks count as characters; output texts were otherwise normalised as for all metrics (see below).
The figures in the tables below are the system-level scores for BLEU and NIST, and the mean sentence-level scores for DIST.
Text normalisation: Output texts were nor-malised prior to computing metrics by lower-casing all tokens, removing any extraneous whitespace characters.
Missing outputs: Missing outputs were scored 0. We only report results for all sentences (incor-porating the missing-output penalty), rather than also separately reporting scores for just the in-coverage items.
Important note: The SR’19 scores are not di-rectly comparable to the SR’18 ones, since the SR’18 scores were calculated on detokenised out-puts, whereas the scores presented in this report were calculated on tokenised outputs (see Section 2.4). In addition, the method for calculating the DIST score in SR’18 was different in that it did not take into account the whole sentence.14
3.2 Human-assessed methods
For the human evaluation, we selected a sub-set of language/track combinations based on number of submissions received and availabil-ity of evaluators: four Shallow Track in-domain datasets (Chinese-GSD, English-EWT, Russian-SynTagRus, Spanish-AnCora), one Shallow Track dataset coming from parsed data (Spanish-AnCoraHIT) and one (in-domain) Deep Track
dataset (English-EWT).
As in SR’11 (Belz et al., 2011) and SR’18 (Mille et al.,2018), we assessed two quality cri-teria in the human evaluations, in separate evalua-tion experiments, Readability andMeaning Simi-larity, and used continuous sliders as rating tools, the evidence being that raters tend to prefer them
(Belz and Kow, 2011). Slider positions were mapped to values from 0 to 100 (best). Raters were first given brief instructions, including the direction to ignore formatting errors, superfluous whitespace, capitalisation issues, and poor hy-phenation. The statement to be assessed in the Readability evaluation was:
The text reads well and is free from gram-matical errors and awkward constructions.
The corresponding statement in the Meaning Sim-ilarity evaluation, in which system outputs (‘the black text’) were compared to reference sentences (‘the grey text’), was as follows:
The meaning of the grey text is adequately expressed by the black text.
Slider design: As in SR’18, and for conformity with what has emerged as an affordable human evaluation standard over the past three years in the main machine translation shared tasks held at WMT (Bojar et al., 2017, 2018; Barrault et al., 2019), we used a slider design as follows, with the pointer starting at 0:
Mechanical Turk evaluations: As in SR’18, we ran human evaluation on Mechanical Turk us-ing Direct Assessment (DA) (Graham et al.,2016), the human evaluation used at WMT campaigns to produce official ranking of machine translation systems (Barrault et al.,2019). We ran both mean-ing similarity and readability evaluations, as sepa-rate assessments, but using the same method.
Quality assurance: System outputs are ran-domly assigned to HITs (following Mechanical Turk terminology) of 100 outputs, of which 20 are used solely for quality assurance (QA) (i.e. do not count towards system scores): (i) some are re-peated as-is, (ii) some are rere-peated in a ‘damaged’ version and (iii) some are replaced by their cor-responding reference texts. In each case, a mini-mum threshold has to be reached for the HIT to be accepted: for (i), scores must be similar enough, for (ii) the score for the damaged version must be worse, and for (iii) the score for the reference text must be high. For full details of how these ad-ditional texts are created and thresholds applied, please refer to Barrault et al. (2019). We report QA figures for the MTurk evaluations below.
Test data sets for human evaluations: Test set sizes out of the box varied for the different lan-guages. For the human test sets we selected either the entire set or a subset of approximately 500, whichever was the smaller number, for a given lan-guage, motivated by the power analysis provided by Graham et al. (2019). For subsets, test set items were selected randomly.
Reported scores: In keeping with the WMT ap-proach, we report both average raw scores and average standardised scores per system. In or-der to produce standardised scores we simply map each individual evaluator’s scores to their stan-dard scores (or z-scores) computed on the set of all raw scores by the given evaluator using each evaluator’s mean and standard deviation. For both raw and standard scores, we compute the mean of sentence-level scores.
Code: We were able to reuse, with minor adap-tations, the code produced for the WMT’17 evalu-ations.15
4 Overview of Submitted Systems
ADAPTis a sequence to sequence model with de-pendency features attached to word embeddings. A BERT sentence classifier was used as a reranker to choose between different hypotheses. The im-plementation is very similar to ADAPT’s SR’18 submission (Elder and Hokamp,2018).
The BME-UW system (Kov´acs et al., 2019) learns weighted rules of an Interpreted Regu-lar Tree Grammar (IRTG) to encode the cor-respondence between word sequences and UD-subgraphs. For the inflection step, a standard sequence-to-sequence model with a biLSTM en-coder and an LSTM deen-coder with attention is used.
CLaC(Farahnak et al.,2019) is a pointer net-work trained to find the best order of the input. A slightly modified version of the transformer model was used as the encoder and decoder for the pointer network.
TheCMU(Du and Black,2019) system uses a graph neural network for end-to-end ordering, and a character RNN for morphology.
DepDist (Dyer, 2019) uses syntactic embed-dings and a graph neural network with message passing to learn the tolerances for how far a de-pendent tends to be from its head. These directed
15https://github.com/ygraham/
dependency distance tolerances form an edge-weighted directed acyclic graph (DAG) (equiva-lent to a partially ordered set, orposet) for each sentence, the topological sort of which generates a surface order. Inflection is addressed with regex patterns and substitutions approximating produc-tive inflectional paradigms.
TheDipInfoUnitorealiser (Mazzei and Basile, 2019) is a supervised statistical system for surface realisation, in which two neural network-based models run in parallel on the same input structure, namely a list-wise learning to rank network for lin-earisation and a seq2seq network for morphology inflection prediction.
IMS(Yu et al.,2019) uses a pipeline approach for both tracks, consisting of linearisation, com-pletion (for T2 only), inflection, and contraction. All models use the same bidirectional Tree-LSTM encoder architecture. The linearisation model or-ders each subtree separately with beam search and then combines them into a full projective tree; the completion model generates absent function words in a sequential way given the linearised tree of content words; the inflection model predicts a sequence of edit operations to convert the lemma to word form character by character; the contrac-tion model predicts BIO tags to group the words to be contracted, and then generate the contracted word form of each group with a seq2seq model.
The LORIA submission (Shimorina and Gar-dent, 2019) presents a modular approach to sur-face realisation with three subsequent steps: word ordering, morphological inflection, and contrac-tion generacontrac-tion (for some languages). For word ordering, the data is delexicalised, the input tree is linearised, and the mapping between an input tree and output lemma sequence is learned using a factored sequence-to-sequence model. Morpho-logical inflection makes use of a neural character-based model, which produces word forms character-based on lemmas coupled with morphological features; finally, a rule-based contraction generation mod-ule is applied for some languages.
The OSU-FBpipeline for generation (Upasani et al., 2019) starts by generating inflected word forms in the tree using character seq2seq mod-els. These inflected syntactic trees are then lin-earised as constituent trees by converting the rela-tions to non-terminals. The linearised constituent trees are fed to seq2seq models (including models with copy and with tree-LSTM encoders) whose
outputs also contain tokens marking the tree struc-ture. N-best outputs are obtained for orderings and the highest confidence output sequence with a valid tree is chosen (i.e, one where the input and output trees are isomorphic up to sibling order, en-suring projectivity).
TheRALIsystem (Lapalme,2019) uses a sym-bolic approach to transform the dependency tree into a tree of constituents that is transformed into an English sentence by an existing English re-aliser, JSrealB (Molins and Lapalme,2015). This realiser was then slightly modified for the two tracks.
Surfers(Hong et al.,2019) first performs delex-icalisation to obtain a dictionary for proper names and numbers. A GCN is then used to encode the tree inputs, and an LSTM encoder-decoder with copy attention to generate delexicalised outputs. No part-of-speech tags, universal features or pre-trained embeddings / language models are used.
The Tilburgapproach (Ferreira and Krahmer, 2019), based on Ferreira et al. (2018), realises multilingual texts by first preprocessing an input dependency tree into an ordered linearised string, which is then realised using a rule-based and a sta-tistical machine translation (SMT) model.
Baseline: In order to set a lower boundary for the automatic and human evaluations, a simple En-glish baseline consisting of 7 lines of python code was implemented16. It generates from a UD file with an in-order traversal of the tree read by py-conll and outputting the form of each node.
5 Evaluation results
There were 14 submissions to the task, of which two were withdrawn; 9 teams participated in the Shallow Track only, two teams participated in both tracks, and one team in the Deep Track only. For the Shallow Track, four teams (BME, IMS, LO-RIA and Tilburg) generated outputs for all lan-guages (29 datasets), four teams (ADAPT, CLaC, RALI and OSU-FB) submitted only for the En-glish datasets, and three teams (CMU, DepDist and DipInfo-UniTo) submitted in several but not all languages. For the Deep Track, two of the three teams (IMS, Surfers) addressed all languages (13 datasets), and one team (RALI) addressed English only. IMS is the only team to have submitted re-sults for all 42 datasets.
–T1-BLEU– ADA BME CLa CMU Dep Dip IMS LOR RAL OSU Til
ar padt 26.4 23.01 64.9 16.71 21.12
en ewt 79.69 59.22 22.08 77.47 60.51 43.5 82.98 60.37 41.23 62.38 59.57 en gum 81.39 57.57 15.32 82.39 66.06 44.24 83.84 60.7 46.68 49.91 59.39 en lines 41.62 48.78 15.3 75.49 59.81 32.42 81 58.82 41.28 54.56 57.02 en partut 51 61.37 10.07 78.98 62.68 35.11 87.25 53.64 48.43 7.37 64.87 es ancora 61.09 76.47 59.29 83.7 43.02 59.29 es gsd 53.74 70.15 57.14 82.98 53.16 54.48 fr gsd 43.8 60.15 44.91 27.04 84 54.6 52.1 fr partut 49.17 63.7 55.05 37.69 83.38 54.14 66.01 fr sequoia 46.72 62.79 46.87 28.95 85.01 53.71 57.41 hi hdtb 63.63 64.07 80.56 26.51 60.72
id gsd 54.22 63.71 85.34 46.27 53.03
ja gsd 49.53 63.59 50.19 87.69 38.8 43.02
ko gsd 46.08 41.81 74.19 37.85 2.14
ko kaist 47.23 73.93 39.75 1.39
pt bosque 39.53 39.82 77.75 52.69 51.18
pt gsd 30.39 27.16 75.93 33.45 40.48
ru gsd 54.58 32.04 71.23 55.09 6.84
ru syntagrus 50.91 76.95 59.99 30.51
zh gsd 58.72 68.54 59.64 32.87 83.85 48.21 53
en pud 84.07 60.42 12.36 80.35 45.61 86.61 61.43 46.84 67.91 63.29
ja pud 53.65 66.52 86.64 41.72 44.37
ru pud 10.15 58.38 52.37 16.35
en ewtHIT 77.21 58.07 21.21 76.6 43.23 81.8 58.5 39.77 60.58 59.08
en pudLAT 80.66 53.46 12.89 76.22 44.06 82.6 55.4 41.5 66.18 57.92
es ancoraHIT 61.26 77.28 83.31 43.2 59.58
hi hdtbHIT 64.27 80.19 26.99 61.54
ko kaistHIT 46.72 74.27 41.83 1.73
[image:9.595.88.507.63.387.2]pt bosqueST A 40.42 78.97 53.64 52.79
Table 4: BLEU-4 scores for the 29 Shallow Track datasets
–T1-NIST– ADA BME CLa CMU Dep Dip IMS LOR RAL OSU Til
ar padt 8.29 7.2 12.22 6.25 7.06
en ewt 13.44 12.62 9.77 13.28 12.5 11.56 13.61 11.89 10.69 11.29 12.56 en gum 12.6 11.99 8.64 12.73 12.07 11.15 12.69 11.15 10.74 8.5 11.8 en lines 9.19 11.54 8.23 12.43 11.68 10.05 12.71 11.17 10.19 9.89 11.64 en partut 8.59 10.34 7.14 10.74 10.23 9.08 11.01 9.29 9.28 3.21 10.27 es ancora 13.52 14.27 13.19 14.69 11.13 13.44 es gsd 11.44 11.99 11.43 12.77 10.68 11.39 fr gsd 10.33 10.86 10.32 9.58 12.45 10.66 10.89 fr partut 8.99 9.16 8.94 8.57 10.36 8.92 9.29 fr sequoia 10.55 11.04 10.47 9.72 12.53 10.56 10.93
hi hdtb 12.26 12.09 13.07 7.97 12.35
id gsd 11.82 12.01 12.83 9.79 11.41
ja gsd 9.99 10.62 9.67 12.42 8.51 9.36
ko gsd 11.98 10.54 12.27 9.98 3.43
ko kaist 12.65 13 10.62 2.52
pt bosque 9.77 9.76 12.15 10.52 11.01
pt gsd 8.85 8.57 13.07 8.89 10.69
ru gsd 11.91 9.06 12.15 11.43 4.68
ru syntagrus 13.8 15.08 13.98 10.87
zh gsd 11.85 12.28 11.98 11.16 12.78 10.27 11.61
en pud 13.36 12.6 8.83 13.18 11.81 13.47 11.81 11.4 11.74 12.69
ja pud 10.56 11.35 13.02 9.29 9.98
ru pud 9.64 10.91 11.16 7.19
en ewtHIT 13.24 12.49 9.69 13.18 11.44 13.46 11.61 10.48 10.96 12.45
en pudLAT 13.17 12.29 8.82 13.02 11.67 13.26 11.42 10.93 11.7 12.32
es ancoraHIT 13.51 14.3 14.61 11.09 13.44
hi hdtbHIT 12.29 13.05 8.01 12.46
ko kaistHIT 12.63 13.02 10.79 2.81
pt bosqueST A 9.73 12.14 10.54 11.05
[image:9.595.93.506.418.742.2]–T1-DIST– ADA BME CLa CMU Dep Dip IMS LOR RAL OSU Til
ar padt 43.06 55.72 73.71 48.96 53.44 en ewt 83.69 62.69 45.99 80.92 71.99 60.13 86.72 73.96 59.78 77.93 73.67 en gum 83.26 56.07 38.13 84.41 68.84 56.04 83.49 72.89 58.6 66.88 69.92 en lines 63.31 52.77 40.4 79.6 65.93 53.21 82.21 71.21 56.68 71.07 67.37 en partut 70.32 61.22 36.21 78.89 65.9 51.15 85.68 66.8 57.64 54.27 66.69 es ancora 58.15 75.53 62.45 79.82 63.2 63.03 es gsd 59.03 73.69 63.9 79.45 66.07 62.55 fr gsd 59.35 75.18 62.47 47.33 84.15 66.55 63.3 fr partut 56.87 79.83 69.45 54.85 82.32 65.76 72.28 fr sequoia 59.28 76.6 61.96 48.7 85.13 67.21 66.24 hi hdtb 64.04 65.85 79.07 60.67 65.63
id gsd 55.57 71.39 83.92 63.41 71.07
ja gsd 57.03 79.09 69.14 87.17 61.03 62.08
ko gsd 52.1 65.75 80.95 62.56 48.54
ko kaist 50.9 78.69 66.17 49.81
pt bosque 58.72 61.16 79.8 65.96 63.37
pt gsd 54.93 57.93 79.33 63.41 59.6
ru gsd 52.67 55.84 73.04 62.98 50.36
ru syntagrus 55.6 78.66 69.06 56.91
zh gsd 59.29 73.03 65.28 50.57 83.18 62.27 65.7
en pud 85.03 59.84 36.26 81.5 53.26 87 72.85 59.45 78.12 71.01
ja pud 56.72 77.87 84.04 61.77 60.2
ru pud 32.08 77.12 68.71 58.68
en ewtHIT 81.57 60.36 43.59 79.41 58.72 85.35 71.91 58.67 74.64 72.7
en pudLAT 83.89 56.13 36.67 79.34 54.42 86.18 70.49 57.55 76.8 67.54
es ancoraHIT 58.38 77.26 81.14 64.68 63.24
hi hdtbHIT 64.58 78.88 61.58 66.13
ko kaistHIT 50.16 79.12 67.33 51.15
[image:10.595.92.509.63.387.2]pt bosqueST A 59.72 81.56 68.09 64.32
Table 6: DIST scores for the 29 Shallow Track datasets
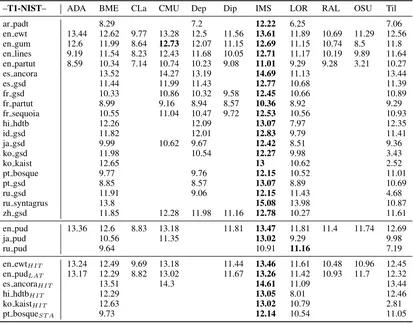
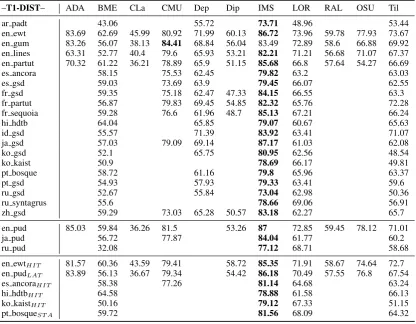
5.1 Results from metric evaluations
Tables 4,5, and 6show results for the eleven T1 systems in terms of BLEU, NIST and DIST; Table 7shows results for the three T2 systems in terms of the same three metrics. In general, scores are higher than last year. This is partly due to the fact that the evaluations are performed on tokenised sentences (see Section 2.4). Scores are about 5-10 BLEU points lower when evaluations are run on detokenised sentences; for instance, the BLEU score for ADAPT on English-EWT is 79.69, but using detokenised outputs and references it drops to 70.26, which is very close to the 69.14 score obtained in SR’18 (the SR’18 and SR’19 ADAPT systems are very similar).
IMS obtained the best scores for all metrics on almost all datasets: the only higher scores are the NIST score for the LORIA system on Russian-PUD, and the DIST score for CMU on English-GUM. IMS achieved high macro-average scores on both Shallow and Deep track datasets, with 79.97 BLEU for T1, 51.41 BLEU for T2, 12.79 NIST for T1, 10.94 NIST for T2, 81.62 DIST for T1, and 71.16 DIST for T2.
In the Shallow Track, 8 out of the 11 systems scored 59 BLEU and above on the English-EWT dataset, and three systems achieved a BLEU score of about 80, the highest score being obtained by IMS with 82.98. High scores were also achieved for Spanish, Hindi, Indonesian, French and Chi-nese (58 BLEU and above on average).
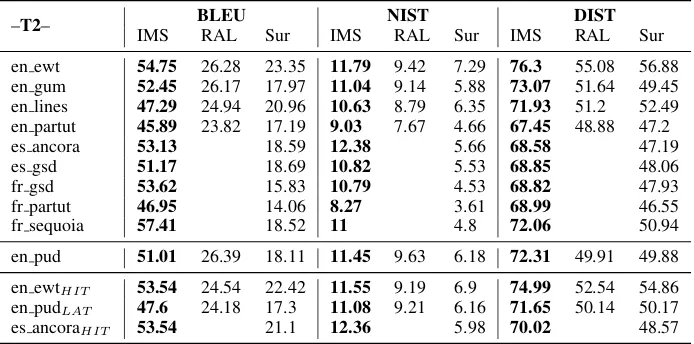
Russian-–T2– BLEU NIST DIST IMS RAL Sur IMS RAL Sur IMS RAL Sur
en ewt 54.75 26.28 23.35 11.79 9.42 7.29 76.3 55.08 56.88 en gum 52.45 26.17 17.97 11.04 9.14 5.88 73.07 51.64 49.45 en lines 47.29 24.94 20.96 10.63 8.79 6.35 71.93 51.2 52.49 en partut 45.89 23.82 17.19 9.03 7.67 4.66 67.45 48.88 47.2 es ancora 53.13 18.59 12.38 5.66 68.58 47.19 es gsd 51.17 18.69 10.82 5.53 68.85 48.06 fr gsd 53.62 15.83 10.79 4.53 68.82 47.93 fr partut 46.95 14.06 8.27 3.61 68.99 46.55 fr sequoia 57.41 18.52 11 4.8 72.06 50.94
en pud 51.01 26.39 18.11 11.45 9.63 6.18 72.31 49.91 49.88
en ewtHIT 53.54 24.54 22.42 11.55 9.19 6.9 74.99 52.54 54.86
en pudLAT 47.6 24.18 17.3 11.08 9.21 6.16 71.65 50.14 50.17
[image:11.595.125.472.63.235.2]es ancoraHIT 53.54 21.1 12.36 5.98 70.02 48.57
Table 7: BLEU-4, NIST and DIST scores for the 13 Deep Track datasets
SynTagRus and Russian-PUD datasets both con-tain mostly news texts, so the structures to gener-ate are more similar; in this context, the impact of the change of domain becomes visible.
The results on the automatically parsed datasets are in general very similar to the results on datasets that originate from gold-standard annotations. For English-EWTHIT, all scores are slightly lower
than the English-EWT scores, with no more than 2 BLEU points, 0.3 NIST points and 2.5 DIST points difference. For the English-PUDLAT, the
difference is more pronounced, up to 6 BLEU points lower e.g. for BME-UW. However, for the other four datasets, most scores are higher, with improvements up to 2 BLEU points; the excep-tions to this trend are IMS on the Hindi data and BME-UW on the Korean-Kaist data, for which the scores according to the three metrics are slightly below scores for gold-standard data.
For the Deep Track datasets, scores are gener-ally substantigener-ally lower than for the Shallow Track datasets. The trends observed for the generation from automatically parsed data are confirmed, but the out-of-domain scores for English (the only lan-guage with an out of domain dataset in the Deep Track) are lower than the in-domain ones, which could be due in particular to the difficulty of gen-erating punctuation signs.
Finally, the Lower Bound (LB) baseline system results are, as expected, very low (they are not shown in the tables): on the two datasets that are part of the human evaluation, i.e. the T1 and T2 English-EWT, it obtained 7.62 BLEU, 8.26 NIST, 37.99 DIST, and 1.31 BLEU, 4.8 NIST, 35.13 DIST, respectively.
5.2 Results of the human evaluation
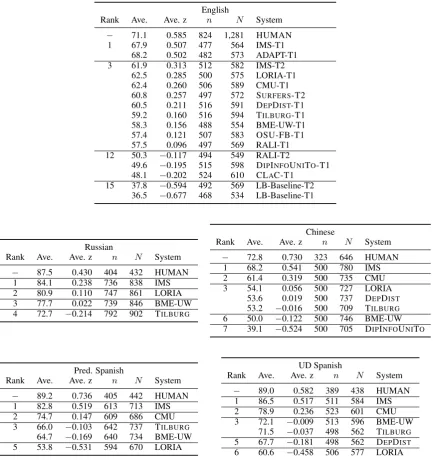
Tables8and9show the results of the human eval-uation carried out via Mechanical Turk with Direct Assessment (MTurk DA) for English, Chinese, Russian and Spanish, respectively. See Section3.2 for details of the evaluation method. ‘DA’ refers to the specific way in which scores are collected in the WMT approach which follows the evaluation approach of SR’18 but differs from what was done for SR’11.
English: For human evaluation of systems for both the Shallow (T1) and Deep (T2) Tracks, out-puts were combined into a single dataset prior to being evaluated and results for all systems are shown in Tables8and9. Average Meaning Sim-ilarity DA scores for the Shallow Track for En-glish systems range from 86.6% to 55.3% with ADAPT and IMS achieving highest overall scores in terms of both average raw DA scores and cor-responding z-scores. In order to investigate how Readability of system outputs compares to that of human-produced text, we included the original test sentences as a ‘system’ in the Readability eval-uation. Unsurprisingly, human text achieves the highest score in terms of Readability (71.1%) but is closely followed by the best performing systems in terms of Readability, IMS (67.9%) and ADAPT (68.2%), both tied with human readability (and one another) in terms of statistical significance.
sta-English
Rank Ave. Ave. z n N System
1 86.6 0.507 695 810 ADAPT-T1 85.6 0.503 672 768 IMS-T1 3 82.5 0.407 702 812 CMU-T1 4 80.6 0.324 718 826 IMS-T2
79.7 0.289 711 816 TILBURG-T1 79.3 0.276 753 859 DEPDIST-T1 78.4 0.255 720 836 OSU-FB-T1 77.0 0.222 702 816 LORIA-T1 73.5 0.164 695 796 BME-UW-T1 10 72.9 0.110 680 795 RALI-T1
69.5 −0.006 700 811 DIPINFOUNITO-T1 67.0 −0.040 692 789 SURFERS-T2 68.3 −0.052 707 808 RALI-T2 14 60.9 −0.216 752 885 CLAC-T1 15 55.3 −0.390 674 775 LB-BASELINE-T1
53.0 −0.422 733 853 LB-BASELINE-T2
Russian
Rank Ave. Ave. z n N System
1 88.3 0.238 481 551 IMS 2 83.7 0.098 477 538 LORIA
83.0 0.071 447 509 BME-UW 4 77.5 −0.134 503 577 TILBURG
Chinese
Rank Ave. Ave. z n N System
1 83.0 0.342 481 711 IMS 2 79.5 0.265 471 691 CMU 3 74.8 0.113 479 709 DEPDIST
73.0 0.043 483 676 BME-UW 74.7 0.039 479 673 TILBURG
6 66.8 −0.188 477 654 DIPINFOUNITO
67.0 −0.213 480 699 LORIA
Pred. Spanish
Rank Ave. Ave. z n N System
1 82.7 0.394 686 799 IMS 2 78.4 0.272 683 804 CMU 3 70.3 −0.042 688 803 TILBURG
67.8 −0.105 675 789 BME-UW 5 59.2 −0.422 652 754 LORIA
UD Spanish
Rank Ave. Ave. z n N System
1 81.1 0.378 620 716 IMS 2 75.8 0.168 655 753 CMU 3 72.2 0.006 614 708 TILBURG
4 70.6 −0.080 617 704 DEPDIST
[image:12.595.87.520.60.492.2]69.1 −0.111 623 705 BME-UW 6 63.2 −0.302 625 706 LORIA
Table 8: SR’19 human evaluation results forMeaning Similarity. Ave. = the average 0-100% received by systems; Ave. z = corresponding average standardized scores; systems are ranked according to Ave. z score; horizontal lines indicate clusters, such that systems in a cluster all significantly outperform all systems in lower ranked clusters;n = total number of distinct test sentences assessed;N= total number of human judgments.
tistical significance, with Surfers (60.9%).17 Finally, note that for both Meaning Similarity and Readability, as expected, the Lower Bound Baselines are tied at the last rank with significantly lower scores than the other systems.
Russian: Tables 8 and 9 show average DA scores for systems participating in the Russian task. Meaning Similarity scores for Russian sys-tems range from 88.3% to 77.5% with IMS again achieving highest overall score. In terms of Read-ability, again IMS achieves the highest average score of 84.1%. Compared to the human results,
17We tested for statistical significance of differences be-tween average DA scores using a Wilcoxon rank sum test.
there is a larger gap than that observed for English outputs, with the best system, IMS, still signifi-cantly lower than human performance in terms of Russian readability.
ref-English
Rank Ave. Ave. z n N System
− 71.1 0.585 824 1,281 HUMAN 1 67.9 0.507 477 564 IMS-T1
68.2 0.502 482 573 ADAPT-T1 3 61.9 0.313 512 582 IMS-T2
62.5 0.285 500 575 LORIA-T1 62.4 0.260 506 589 CMU-T1 60.8 0.257 497 572 SURFERS-T2 60.5 0.211 516 591 DEPDIST-T1 59.2 0.160 516 594 TILBURG-T1 58.3 0.156 488 554 BME-UW-T1 57.4 0.121 507 583 OSU-FB-T1 57.5 0.096 497 569 RALI-T1 12 50.3 −0.117 494 549 RALI-T2
49.6 −0.195 515 598 DIPINFOUNITO-T1 48.1 −0.202 524 610 CLAC-T1
15 37.8 −0.594 492 569 LB-Baseline-T2 36.5 −0.677 468 534 LB-Baseline-T1
Russian
Rank Ave. Ave. z n N System
− 87.5 0.430 404 432 HUMAN 1 84.1 0.238 736 838 IMS 2 80.9 0.110 747 861 LORIA 3 77.7 0.022 739 846 BME-UW 4 72.7 −0.214 792 902 TILBURG
Chinese
Rank Ave. Ave. z n N System
− 72.8 0.730 323 646 HUMAN 1 68.2 0.541 500 780 IMS 2 61.4 0.319 500 735 CMU 3 54.1 0.056 500 727 LORIA
53.6 0.019 500 737 DEPDIST
53.2 −0.016 500 709 TILBURG
6 50.0 −0.122 500 746 BME-UW 7 39.1 −0.524 500 705 DIPINFOUNITO
Pred. Spanish
Rank Ave. Ave. z n N System
− 89.2 0.736 405 442 HUMAN 1 82.8 0.519 613 713 IMS 2 74.7 0.147 609 686 CMU 3 66.0 −0.103 642 737 TILBURG
64.7 −0.169 640 734 BME-UW 5 53.8 −0.531 594 670 LORIA
UD Spanish
Rank Ave. Ave. z n N System
− 89.0 0.582 389 438 HUMAN 1 86.5 0.517 511 584 IMS 2 78.9 0.236 523 601 CMU 3 72.1 −0.009 513 596 BME-UW
71.5 −0.037 498 562 TILBURG
5 67.7 −0.181 498 562 DEPDIST
[image:13.595.83.517.61.522.2]6 60.6 −0.458 506 577 LORIA
Table 9: SR’19 human evaluation results forReadability. Ave. = the average 0-100% received by systems; Ave. z = corresponding average standardized scores; HUMAN denotes scores attributed to the original reference texts; systems are ranked according to Ave. z score; horizontal lines indicate clusters, such that systems in a cluster all significantly outperform all systems in lower ranked clusters;n= total number of distinct test sentences assessed; N= total number of human judgments.
erences achieve a significantly higher score than all systems in terms of readability.
Spanish Automatically Parsed (‘Pred. Span-ish’ in the tables): Tables 8 and 9 show aver-age DA scores for system outputs for the Span-ish automatically parsed data. Meaning Similar-ity scores range from 82.7% to 59.2%, with IMS achieving the highest score, significantly higher than all other participating teams. IMS and CMU achieve better scores than on the regular Spanish UD dataset, while the other systems score lower.
In terms of Readability, the text produced by the systems ranges from 82.8% to 53.8%, and again IMS achieves the highest score, again significantly higher than all other systems. But for the auto-matically parsed data, all systems score lower than on the Spanish UD dataset, showing that whereas there was no clear difference between the two datasets according to the automatic metrics, the human evaluation shows that the systems do not manage to generate texts with the same quality.
scores for all participating systems. Meaning Sim-ilarity scores range from 83% to 67%, with IMS achieving the highest score, significantly higher than all other participating teams. In terms of Readability, the produced text ranges from 68.2% to 39.1%, and again IMS achieves the highest score, again significantly higher than all other sys-tems. As for the other non-English languages, no system achieves human performance.
Results from MTurk DA quality control: Sim-ilar to SR’18, only 31% of workers passed qual-ity control (being able to replicate scores for same sentences and scoring damaged sentences lower), again highlighting the danger of crowd-sourcing without good quality control measures. The re-maining 69%, who did not meet this criterion, were omitted from computation of the official DA results above. Such levels of low quality workers are consistent with what we have seen in DA used for Machine Translation (Graham et al., 2016) and Video Captioning evaluation (Graham et al., 2017).
5.3 Correlation of metrics with human assessment
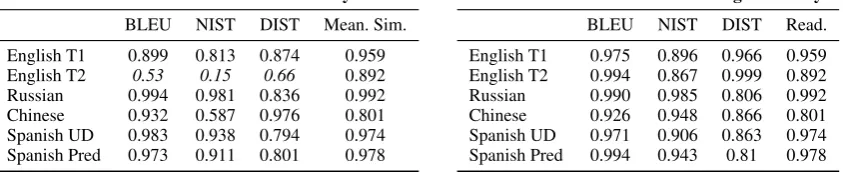
Table10shows the Pearson correlation of BLEU, NIST and DIST scores with human assessment for systems in tasks for which we ran human evalua-tions this year. These were computed on the aver-age z scores. While BLEU is the metric that corre-lates best with the human judgements in general, NIST and DIST are more erratic.
None of the automatic metrics correlate well with human judgements of Readability on the En-glish Deep Track data (‘EnEn-glish T2’ in the tables), in particular NIST with only 0.15. This contrasts with corresponding correlations for Meaning Sim-ilarity which do not appear to be affected. Com-bined with the fact that human assessment scores the deep systems higher for Readability than the metrics, this indicates that some deep systems are producing fluent text that is however dissimilar to the reference texts. The correlations for T2 should be interpreted cautiously since only four T2 sys-tems are being evaluated, which possibly distorts the numbers.
6 Conclusion
The 2019 edition of the SR task (SR’19) saw in-creased language coverage (11 languages from 9
language families, up from 10 languages in 5 fam-ilies), as well as increased participation (33 team registrations from 17 countries, up from 21 regis-trations for SR’18), with 14 teams submitting sys-tems to SR’19 (up from 8 in SR’18). Datasets, evaluation scripts, system outputs and more about the task can be found on the GenChal repository.18
Among the notable trends we can observe in evaluations are the following: (i) the best Shal-low Track English systems are closing the gap to human-written texts in terms of human evaluation of Readability; (ii) there is a notable gap between human assessment (higher) and metric assessment (lower) of deep track systems, in particular for the best deep track systems; and (iii) the correlation between BLEU and human evaluations of both Readability and Meaning Similarity is consistently above 0.9 for outputs for the gold-standard shal-low track datasets, but substantially shal-lower for deep track systems (NIST and DIST are both more er-ratic).
The biggest progress has been made in SR’19 for deep track systems: not only did we have mul-tiple Deep Track systems to evaluate (compared to just one in 2018), but the best Deep Track system performed equally well or better than most Shal-low Track systems for both Readability and Mean-ing similarity.
Another notable development has been the in-troduction of silver-standard data. Even though the quality of the texts obtained when generating from automatically parsed data is lower than when using gold-standard data, the high scores accord-ing to human evaluations suggest that the shallow inputs could be used as pivot representations in text-to-text systems such as paraphrasing, simpli-fication or summarisation applications.
Overall, the SR tasks have clearly demonstrated that generation from structured meaning represen-tations can be done with impressive success by current neural methods. Given the increased in-terest and progress we have been able to report for SR’19, we plan to continue with a third shared task in 2020, as part of which we plan to investigate ways of linking up to earlier stages of automatic language generation.
18https://sites.google.com/site/
Correlation of Metrics withReadability
BLEU NIST DIST Mean. Sim.
English T1 0.899 0.813 0.874 0.959 English T2 0.53 0.15 0.66 0.892 Russian 0.994 0.981 0.836 0.992 Chinese 0.932 0.587 0.976 0.801 Spanish UD 0.983 0.938 0.794 0.974 Spanish Pred 0.973 0.911 0.801 0.978
Correlation of Metrics withMeaning Similarity
BLEU NIST DIST Read.
[image:15.595.90.512.74.160.2]English T1 0.975 0.896 0.966 0.959 English T2 0.994 0.867 0.999 0.892 Russian 0.990 0.985 0.806 0.992 Chinese 0.926 0.948 0.866 0.801 Spanish UD 0.971 0.906 0.863 0.974 Spanish Pred 0.994 0.943 0.81 0.978
Table 10: Pearson correlation of BLEU, NIST and DIST scores with human assessment of Readability (left) and Meaning Similarity (right).
Acknowledgments
SR’19 is endorsed by SIGGEN. The work on its organisation, realisation, and evaluation was supported in part by (1) Science Foundation Ire-land (sfi.ie) under the SFI Research Centres Pro-gramme co-funded under the European Regional Development Fund, grant number 13/RC/2106 (ADAPT Centre for Digital Content Technology, www.adaptcentre.ie) at Dublin City University; (2) the Applied Data Analytics Research & Enter-prise Group, University of Brighton, UK; and (3) the European Commission under the H2020 via contracts to UPF, with the numbers 779962-RIA, 700475-IA, 7000024-RIA, and 825079-STARTS.
References
Rami Al-Rfou, Bryan Perozzi, and Steven Skiena. 2013. Polyglot: Distributed word representations for multilingual NLP. InProceedings of the Seven-teenth Conference on Computational Natural Lan-guage Learning, pages 183–192, Sofia, Bulgaria. Association for Computational Linguistics.
Loc Barrault, Ondej Bojar, Marta R. Costa-juss, Chris-tian Federmann, Mark Fishel, Yvette Graham, Barry Haddow, Matthias Huck, Philipp Koehn, Shervin Malmasi, Christof Monz, Mathias Mller, Santanu Pal, Matt Post, and Marcos Zampieri. 2019. Find-ings of the 2019 conference on machine translation (wmt19). InProceedings of the Fourth Conference on Machine Translation (Volume 2: Shared Task Pa-pers, Day 1), pages 1–61, Florence, Italy. Associa-tion for ComputaAssocia-tional Linguistics.
Anja Belz and Eric Kow. 2011. Discrete vs. contin-uous rating scales for language evaluation in NLP. In Proceedings of the 49th Annual Meeting of the Association for Computational Linguistics (ACL-HLT’11).
Anja Belz, Michael White, Dominic Espinosa, Eric Kow, Deirdre Hogan, and Amanda Stent. 2011. The first surface realisation shared task: Overview and evaluation results. InProceedings of the 13th Eu-ropean Workshop on Natural Language Generation,
ENLG ’11, pages 217–226, Stroudsburg, PA, USA. Association for Computational Linguistics.
Ondˇrej Bojar, Rajen Chatterjee, Christian Federmann, Yvette Graham, Barry Haddow, Shujian Huang, Matthias Huck, Philipp Koehn, Qun Liu, Varvara Logacheva, Christof Monz, Matteo Negri, Matt Post, Raphael Rubino, Lucia Specia, and Marco Turchi. 2017. Findings of the 2017 conference
on machine translation (WMT’17). In
Proceed-ings of the Second Conference on Machine Trans-lation, Volume 2: Shared Task Papers, pages 169– 214, Copenhagen, Denmark. Association for Com-putational Linguistics.
Ondej Bojar, Christian Federmann, Mark Fishel, Yvette Graham, Barry Haddow, Matthias Huck, Philipp Koehn, and Christof Monz. 2018. Find-ings of the 2018 conference on machine translation (wmt18). InProceedings of the Third Conference on Machine Translation, Volume 2: Shared Task Pa-pers, pages 272–307, Belgium, Brussels. Associa-tion for ComputaAssocia-tional Linguistics.
Wanxiang Che, Jiang Guo, Yuxuan Wang, Bo Zheng, Huaipeng Zhao, Yang Liu, Dechuan Teng, and Ting Liu. 2017. The hit-scir system for end-to-end pars-ing of universal dependencies. In Proceedings of the CoNLL 2017 Shared Task: Multilingual Pars-ing from Raw Text to Universal Dependencies, pages 52–62.
Jacob Devlin, Ming-Wei Chang, Kenton Lee, and Kristina Toutanova. 2018. Bert: Pre-training of deep bidirectional transformers for language understand-ing.arXiv preprint arXiv:1810.04805.
Wenchao Du and Alan W Black. 2019. Learning to Order Graph Elements with Application to Multi-lingual Surface Realization. InProceedings of the 2nd Workshop on Multilingual Surface Realisation, Hong Kong, China.
William Dyer. 2019. DepDist: Surface Realization via Regex and Dependency Distance Tolerance. In Pro-ceedings of the 2nd Workshop on Multilingual Sur-face Realisation, Hong Kong, China.
Pro-ceedings of the First Workshop on Multilingual Sur-face Realisation, Melbourne, Australia.
Farhood Farahnak, Laya Rafiee, Leila Kosseim, and Thomas Fevens. 2019. The Concordia NLG Surface Realizer at SR19. InProceedings of the 2nd Work-shop on Multilingual Surface Realisation, Hong Kong, China.
Thiago Castro Ferreira and Emiel Krahmer. 2019. Sur-face Realization Shared Task 2019 (SR’19): The Tilburg University Approach. InProceedings of the 2nd Workshop on Multilingual Surface Realisation, Hong Kong, China.
Thiago Castro Ferreira, Sander Wubben, and Emiel Krahmer. 2018. Surface realization shared task 2018 (sr18): The tilburg university approach. In Proceed-ings of the First Workshop on Multilingual Surface Realisation, pages 35–38.
Yvette Graham, George Awad, and Alan Smeaton. 2017. Evaluation of Automatic Video Captioning Using Direct Assessment. ArXiv e-prints.
Yvette Graham, Timothy Baldwin, Alistair Moffat, and Justin Zobel. 2016. Can machine translation sys-tems be evaluated by the crowd alone.Natural Lan-guage Engineering, FirstView:1–28.
Yvette Graham, Barry Haddow, and Philipp Koehn. 2019. Translationese in machine translation evalu-ation.CoRR, abs/1906.09833.
Karl Moritz Hermann, Tomas Kocisky, Edward Grefenstette, Lasse Espeholt, Will Kay, Mustafa Su-leyman, and Phil Blunsom. 2015. Teaching ma-chines to read and comprehend. In Advances in neural information processing systems, pages 1693– 1701.
Xudong Hong, Ernie Chang, and Vera Demberg. 2019. Improving Language Generation from Feature-Rich Tree-Structured Data with Relational Graph Convo-lutional Encoders. InProceedings of the 2nd Work-shop on Multilingual Surface Realisation, Hong Kong, China.
Ad´am Kov´acs, Evelin ´Acs, Judit ´Acs, Andr´as Kor-nai, and G´abor Recski. 2019. BME-UW at SR19: Surface Realization with Interpreted Regular Tree Grammars. In Proceedings of the 2nd Workshop on Multilingual Surface Realisation, Hong Kong, China.
Guy Lapalme. 2019. Realizing Universal Dependen-cies Structures Using a Symbolic Approach. In Pro-ceedings of the 2nd Workshop on Multilingual Sur-face Realisation, Hong Kong, China.
KyungTae Lim, Cheoneum Park, Changki Lee, and Thierry Poibeau. 2018. Sex bist: A multi-source trainable parser with deep contextualized lexical representations. InProceedings of the CoNLL 2018 Shared Task: Multilingual Parsing from Raw Text to Universal Dependencies, pages 143–152.
Alessandro Mazzei and Valerio Basile. 2019. The Dip-InfoUniTo Realizer at SR19: Learning to Rank and Deep Morphology Prediction for Multilingual Sur-face Realization. InProceedings of the 2nd Work-shop on Multilingual Surface Realisation, Hong Kong, China.
Stephen Merity, Caiming Xiong, James Bradbury, and Richard Socher. 2016. Pointer sentinel mixture models. arXiv preprint arXiv:1609.07843.
Adam Meyers, R. Reeves, C. Macleod, R. Szekely, V. Zielinska, B. Young, and R. Grishman. 2004. The NomBank project: An interim report. In HLT-NAACL 2004 Workshop: Frontiers in Corpus Anno-tation, Boston, MA, May 2004, pages 24–31.
Simon Mille, Anja Belz, Bernd Bohnet, Yvette Gra-ham, Emily Pitler, and Leo Wanner. 2018. The First Multilingual Surface Realisation Shared Task (SR’18): Overview and Evaluation Results. In Pro-ceedings of the 1st Workshop on Multilingual Sur-face Realisation (MSR), 56th Annual Meeting of the Association for Computational Linguistics (ACL), pages 1–12, Melbourne, Australia.
Paul Molins and Guy Lapalme. 2015. Jsrealb: A bilin-gual text realizer for web programming. In Proceed-ings of the 15th European Workshop on Natural Lan-guage Generation (ENLG), pages 109–111.
Martha Palmer, Daniel Gildea, and Paul Kingsbury. 2005. The proposition bank: An annotated cor-pus of semantic roles. Computational Linguistics, 31(1):71–105.
K. Papineni, S. Roukos, T. Ward, and W. j. Zhu. 2002. BLEU: A method for automatic evaluation of ma-chine translation. In Proc. 40th Annual Meeting on Association for Computational Linguistics, pages 311–318, Philadelphia, Pennsylvania.
Matthew E Peters, Mark Neumann, Mohit Iyyer, Matt Gardner, Christopher Clark, Kenton Lee, and Luke Zettlemoyer. 2018. Deep contextualized word rep-resentations. arXiv preprint arXiv:1802.05365.
Peng Qi, Timothy Dozat, Yuhao Zhang, and Christo-pher D Manning. 2019. Universal dependency pars-ing from scratch.arXiv preprint arXiv:1901.10457.
Alec Radford, Jeff Wu, Rewon Child, David Luan, Dario Amodei, and Ilya Sutskever. 2019. Language models are unsupervised multitask learners. OpenAI Blog, 1(8).
Anastasia Shimorina and Claire Gardent. 2019. LO-RIA / Lorraine University at Multilingual Surface Realisation 2019. InProceedings of the 2nd Work-shop on Multilingual Surface Realisation, Hong Kong, China.
the CoNLL 2018 Shared Task: Multilingual Parsing from Raw Text to Universal Dependencies. Associa-tion for ComputaAssocia-tional Linguistics.
Kartikeya Upasani, David L. King, Jinfeng Rao, Anusha Balakrishnan, and Michael White. 2019. The OSU-Facebook Realizer for SR19: Seq2seq In-flection and Serialized Tree2Tree Linearization. In Proceedings of the 2nd Workshop on Multilingual Surface Realisation, Hong Kong, China.