TALSMANDENS GRUPPE - SPRECHERGRUPPE '- SPOKESMAN'S GRQU> - GROll'E OU PORTE-PAROLE a.MM EKnPOH)nOY TYnoY - GRUPPO DEL PORTAi/OGE - 8UEAU VAN DE 'MXlRDVOERDER
••
..
•
.
•
.
••
. .
••
••
.
...
•
••••
.
.:
.
.
..
:
.
:
:·.
..
.
.
..
.
.
. . .
.
.
.
.
.
.
.
. .
.
.
. .
.
.
.
.
.
. .
. .
. . .
.
.
. . .
.
. . .
.
. .
. . .
· - ·
.
•
••
•
•
•
•••
• •
•
••
•
••
••••
• •••
•
• • •• •• •
•
••
••
•
•
• •
•
•
••
•
•
•
•••••
•••
•
•
•
•
••
PRISSl·MIDDELELSI • MIJTHlUNG AN DH PRISSI • PRISS·RIUASI • INfDRMATIDN A LA PRISSI
ANAKOINDIH rlA TON TYOO • INfORMAZIDNI Alli STAMPA • MIDIDIUNG AAN DI PIRS
9'/17-Lfll
..
Brussels, 4 October 1984 •
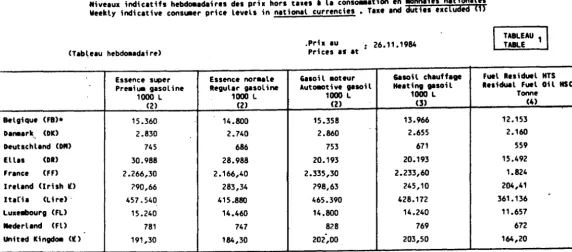
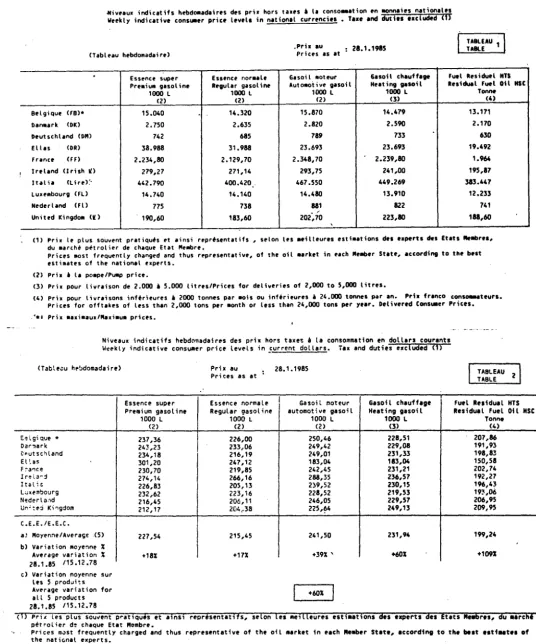
COMMISSION OIL BULLETIN N0.261
The weekly oil bulletin, published by the Commission, gives the latest available data
relating·to price development in the Member States and for the Community
as
a
whole.
The Commission considers that the bulletin contributes to improved transparency as
regards Community oil markets.
The figures given in each bulletin follow the development over time of certain prices.
They permit a comparison at any instant in time between Member States but such a
comparison may not be representative of international price relationships over a longer
period •. Moreover, it is evident that such a comparison is limited even if fluctuation~
in exchange rates are ignored; although valid for identical products sold to the sam~
categories of consumer no account is taken of market structures, (the product categori~~
reported are not in every case representative of the bulk of sales for each product ,~
each country), quality specifications and methods of distribution which are unique to
each Member State. In this context the essentially indicative nature of some elements
of table 2 is emphasised.
A detailed methodology will be appended to the bulletin published at the beginning
of each quarter.
The Commission Oil Bulletin is freely available on d~mand (telephone 235.35.75).
I
Weekly
summary
1
Evolution (in X) of Community indications for
•
1°) Weighted average pre-tax prices
for principal oil products at 24.9.1984
compared with 15.12.1978
compared with previous
week
Weighted
average
CIF cost of
oil supplies for June 1984
compared with 15.12.1978
crude
<
1
>
(Table 3)
(Table 2)
•
+58%
+3,50%
+112,50%
(1) The CIF supply· cost is derived from 111onthly de·clarations by; Member States (see
Oil Bulletin 252 .for methodology).
KOMMISSIONEN FOR DE E~ISKE F/ELLESSKABER - KOWMSSIOl'--l DER ~ H E N .GEME~HAFTEN . -·.. ···-·
laaanca sup.ir
,,..h,.
psol ine1auo1..·· (2) . . lti . .
c .. ,.
16.400. . . . rlt CN) .2.M
o.utaclll.,.. CIII) 719
fllaa CN) 30.911
Franct (ff) 2.243,30
Ireland <Irish II> 280,90 Italia (Lire> · 434.130
LuaniKlurt (FL) 15.240
llllderland (fl) 126
~itecl ICin . . . CU 185,00
· · · - · nanill• lqular ....
u ..
1aao" CZ) 15.520 2,775 659 21.981 2.076,00 273,51 392.460 14,460 719 177,30 .Pril·au ·prtns •• at.... il'aoteur
~oaottve-il
1000 L
(2)
,· .. , 15.551
2.120 715 20.193 2.225,70 216,44 427,130 14.IOO 153 195:70 24.9.1914 1,,,n Z.4t0 6IS 20.1,s 2.124,50 232,91 426.na 14,240 793 212,20
,
....
,,
,
..
. ,.,,
11.MO : ...
. ;, ;'z.aas:':
,·,:··· 541
;-.;h1S.4'1
1,119 116,S:SJ4i.m
11.657 670 160,1111(1) Pri1 le plus aouvent pratiqu61 et atnsi reprt . . ntatifa, . . lon les . . tlleure1·e1ti . . tiona dea
•...-rt•
des ltata ...._,..,,du .. ,cllt pttl'Olier de cheque Etat llellbre.
Prices aoat frequently chanpd and thus repre . . ntattve,
of
the oil . . ,kit in each..., State,accorctt ..
to Ille llelteatt . . tea of the national e1perta. ~
CZ> Prh I la po11pe/l'ullp price,
CJ) Prh pour livrataon de' 2.000 I 5.000 lltres!Prices for deliveries of 2,000 to 5,000 litres.
c,r
l'ria pilUI' ltvraiaon• inftrieurH I ZOUO tonne• par 110it ou inftrieurn I 14,000 t - • par an. Pria f , -_,eur,.•
Prices for offtaliH of lan than 2,000 tons per IIOftth or less than 24,0liO ·,ona per ,or . . . livered C.._,. Prt-.
·e,
Prta . . ,i...,.1111111..,. jrtces."ivuua incllcatifs heoeloe•da\res du prh hors tun • la cons09Ution en dollars cour1nt1 IIHkly indic1tive consuaer price levels in current dollars. Tu and dutin ucluded
<iS
E uo,nce super frt•iua g•soline
1000 L
(2)
Belgique • 269,62
Oa11111rk 266,00
Deutschl and 239,16
EllH 252,55
France 242,51
Ireland 290,75
Italia 233,40
Luaellbourg 250,55
Nedtrland 244,37
united Kingoo• 232,64
---C.E.E,/E,E,C.
al llo1enne/Av•r•9e (5) 240,21 I)) ~u i ad un IIO~enne X
A•er.ve v.riation I +251
24.'i.flit 115.12.70 c> v,ri•tiur, •vy~nne sur
lu 5 pr.:.d\lits Aver1ge v•riatic,n fu.-all 5 proeluc ts
24.9.14 /15.12.711
Prh au
Prices as at 24.9.1914
Essence noraale 61soi l aouur Regul1r g•soline aute111ot~ gaso;l
1000 L 1 L
(2) (2)
255,15 ii!55,78
255,40 250,34
219,14 231,53
236,25 164,57
224,43 240,61
283,17 296,49
211,00 229,63 ,·
237,73 243,:S2
233,43 252,36
222,96 246,10
223, 13 231,54
+21:¥ +371
I
+51XI
61soil chluff1ge Hut ing guoil
1000 L
(l) 232,97 229,17 228,52 164,57 229,67 241,08 229,42 234, 11 " 234,61 266,15
232,63
+611
TAILIAU
a:
I
TMU .
Fuel lesidual NTS
Residual Futl O~l NSC
Tonn• (4) 194,65 114,5:S 180,41 126,25 195,40 193,07 117,25 191,64 191,22 201,20 1U,04
+m
(1>
Prh lu plus souvent pr•tliiui'• et 1insi -,.·.prfttntaiTfs, selonl•s•e
i l leures est iaat ,ons des eaperU ct.s IUU ,.._,,1, 4IU . . rclltp6trol ier de chaque Etat Neabre. .
Prices aost frequently charged and thus representative of the oil aarket in each llellber St1te,. accordint to tllt best e.ti . . ttl of the national eaperts. ·
Prh • la pota91t/ P1111op price
l'rb pour livraison de 2,000 i 5.000 litres./ Prices for deliveries of 2,000 to 5,000 litres.
(2) (3) (4) (5)
Pri• p<>ur li•r1ison inftrieure • 2000 tonnes par aois ou inferieure •·24.000 tonnes par an. Pri• franco conSOllllatturs. Prices for ooft1kes of less than 2,000 tons per aonth or less than 24,000 tons per year. Delivered Cons••r Prices. La aoyenne rhult,o ci'une ponderation des quantiles cor1s-tes de chaque produit concernt au cours • l'annte 1"2
The result of ueighting the prices of the products concerned by the quantities cons . . ed durint the period 1"2
• Pril •ui . . ua/lluiaua prices.
TS8L£!1J 3
HBLE
. Cout CAF D'.;pprov·; s;onne1Hnt en brut de I a
co ... un•ute.
(IF cost of c.,...un,ty crude oil ;up;,l ie<s.
PriK au
Price a~ at
15.1?.71
.Prh au aoh de juin 1914
Price as at June 1914
Evolut Ion (X)
24.9.14 /1~.1?.71
----·---,---TALSMANDENS GRUPPE - SPRECHERGRUPPE - SPOKE:SMAN'S GROUP - GROlPE DU PORTE-FMOLE OMAM EKnPOmnov TYflOY - GRUPPO DEL PORTAVOCE - BUREAU VAN DE WOORDVOERDER
••
..
• •
.
.
••
.
••
. . ... .
••
•
•
••
•
..
•
.
••
..
•
.
.
•
·-·.
••
•
••
• • • •
.
.
. . .
.
.
.
.
.
.
.
. . . .
.
. .
.
. .
.
. .
.
.
. .
. . .
.
. .
. . .
.
.
.
. . .
.
.
...
•
•
••
•
•
•
•
•
••
••
•••
•
• •
•
•
•
•
•• •
••
•
•• ••••
•••••
•
•
•
••
••
•
•
•
•
•
•••
•
• •
•
PRESSE·MEDDELELSE • MITTHlUNG AN DH PRESSE • PRESS·REUASE • INfORMATIDN A lA PRESSE
ANHOINDIH
rlA TON
TYRO•
INfDRMAZIDNE AllA STAM~· ME1fBff111G5AAN
1
DEWer,
1984
•
COMMISSION OIL BULLETIN NO. 2 2
lf
<(
;7,
y //
The weekly oil bulletin, published by the Commission, gives the latest available data
relating·to price development in the Member States and for the Community as a whole.
The Commission considers that the bulletin contributes to improved transparency as
regards Community oil markets.
The figures given in each bulletin
1follow the development over time of certain prices.
They permit a comparison at any instant in.time between Membe~ States but such a
comparison may not be representative of international price relationships over a longer
period. Moreover, it is evident that such a comparison is limited even if fluctuations
in exchange rates are ignored; although valid for identical products sold to the same
categories of consumer no account is taken of market structures, (the product categories
reported are not in every case representative of the bulk of sales for each product in
each country), quality specifications and methods of distribution which are unique to
each Member State. In this context the essentially indicative nature of some elements
of table 2 is emphasised.
A detailed methodology will be a~pended to the bulletin published at the begjnning
of each quarter.
The Commission Oil Bulletin is freely available on demand (telephone 235.35.75).
I
Weekly
summary
I
Evolution (in X) of Community indications for
•
1°) Weighted average
pre-tax
prices
for principal oil products at
1.10.1984
<Table 2>
compared with 15.12.1978
+59%
compared with previous week
+0,90zo
2°>
Weighted average CIF cost of crude <1>
oil supplies for
.Jun.a
1984
(Table 3)
( 1)
compared with 15.12.1978
+112,5~
The CIF supply .cost is derived from monthly de"cla·rations by. Member States <see
Oil Bulletin
25
2
for methodology).
KOMMISSIONEN FOR DE EUROP.IEISKE FIELLESSKABER - KOMMSSION DER EI.R)Ao\lSCI-EN GEMEINSCHAFTEN
Mive1u1 indicetlf• hebclolledeire1 de1 pr,1 hor1 te1e1 • le conaoaaetion tn IIOllftll1ta ne~1le• Veellly indicative conauaer price level• 1n n1ttonel currtnc1ea, T11e end dutte, eacl
tiS
(Tableau hebdoll1dlir1>.,rh au
,rices II et 1. 10, 19114
T..._IAU 1
,-.1
IIHnce 1uper £Hence norult &11oil aoteur <oi l clleuff111 futl . . ,idull NTI ,r,a\1111 911oline legul•r .. ,oline Aut-t he . . toil Meeting IIIOil lesidull fuel OH IISC
1000 L 1000 L 1000 L 1000 L
,
...
CZ> (2)
m
(J) (4)lel9ique (ft)• 16. 320 1!),600 16,2?u 1,.aao 12, 19)
hnurk CH) 2,770 2,b,, 2.·;.,o 2.550 2.025
Deutlchlend CM> 763 703 759 7<rl 565
Ellll CH) 30.988 28,986 20.193 20. 193 15.492
France (ff) 2.201,20 2.076,00 2,225,N 2.124,50 1
,B39
lf'tllnd Urilh I!> 280,90 273,58 286,.;., 232,91 186,53
Itel ia (Lire) 434,130 392,,.60 449,740 426,728 351,630
Lualllllourt CFL) 15,240 14.460 14,&lO 14,240 11,657
Nederland (fl) 826 789 861 Bal 674
United Kingdom Cl> 191,60 184,00 195,20 220,90 ;66,00
<1) Pri• le plu1 souvent pratiquts et 1insi reprtsent1tif1, 1elon let .. ,lleures estlut1ons des eaperts dts Eteta lll!ll»ree,
du urcht pttrolier de cheque Etat lletlbre,
Prices aost frequently changed and thus representative, of the oil urket In each lleaber Statei, accordint to tile lle1t est1utes of tlle national ••perts,
(2) Prix • la poape/Pullp price.
CJ> Prh pour livraiton dt 2,000 • 5,000 litres/,rlces for dellver1H of 2,000 to 5,000 litres.
(4) ,ri1 pour llvralsons inftrleures • 2000 tonnes par aois ou lnftrlture1 • 24,000 tonnes par an. Prla franc• conto11111tturs.
,rices for offtekts of less then 2,000 ton1 per aonth or less~h•n 24,00D tons per year . . . livered Con11111t1r Price,.
·e, Prh uxluu1/lleal- prices,
Niveau• i"dicatifs hPbd001adaires d•s pri• hors taaes a la co"so ... ation tft dollars courants
Weekly i~d,cative con,uaer price levels in current dollars. Ta• and duties eacluoed
<1>
(Tableau hebdoaadaire)
Essence super Preai...,. gasoline
1000 L
(2)
Belgique • 264,o6
Danaark 251,13
Deutsch land 250,57
El las 2.;6,86 France 235,1>7
lrel1nd 285,82
Italia 230,34
Luaeabourg 246,58
Nederland 2<i0,6~
Unhed ICingdoa 237,63
C.E.E.IE.E.C.
•> llo,enne/Av.r1ge (5) 240;59
b) Variation aoyenne X 2~ Average vuiat ion X
1.10.64 /15.12.78
c> Variation aoyenne sur
les 5 produits
Average variation for
all 5 products 1.10.114 115.12.78
Prix •u
Prices as at
Essence noraale Regular gasoline
1000 L
(2) 2~2 ,41 2.,0,71 230,87 230,92 222,27 278,37 2o8,23 233,9i> 229,86 228,20 228,93 251' 1 .10.84
G•soil aote\lr G1soil cn • .,.ffage
autoaotive gasoil Heatfog gasoH 1000 L 1000 L
(2) (3)
263,2~ 240, 76 248,41 231,19 2,.9,26 230,54 16C,86 160,86 238,30 227, .. 6 291,<t'.> 236,99 236,62 226,41 239, .. 6 230,40 250,84 233,65 242,09 273,97
242,67 233,76
..
~ +61~L.·_5:i_J
TABLEAU ?
TABLE
fuel Rnidual HTS
ltsiou,l fuel OH
Tonne (4) 197 ,28 1tl3,59 185,55 123,41 196,90 18'},79 186,57 188,61 196,36 205,88 18'},99
+m
HSC(1) Pri• lts plus souvent pratiques et aTnsT rrpresentatifs, selon les •eilleures estiaations
an
uperts des Et1ts lletlbres, du ••rcht(2) (3)
(0
(5)
petrolier de chaque Etat Neabre.
Prices aost frequently charged and thus represe"tative of the oil aarket in ••ch l'le•ber State, according to the best estiaates of the national eaperts.
Prh • la poape/ Puap price
Prh pour livraison de 2,000 t 5.000 litres./ Prices for deliveries of 2,000 to 5,000 litres.
Prix pour livraison inferieure
a
2000 tonnes par ao\s ou inferieure • 24.000 tonnes par an. Prh franco consoaaateurs. Prices for ooftakes of less than 2,000 tons per aonth or less than 24,000 tons pe.r year. Delivued i;ons.au.9.P.rius.
La aoyenne rtsulte d'une ponderation des quantitts consoaaees ae ch•que produit concerne au cour1 de~...,,.. l'Gl
The result of 111ighting the prices of the products concerned by the quantities consumed during the period 19112,
TABLOU ] TABLE
,Cout CAf D'approvisionne•ent en brut de la
Coa11unautt'.
Prir. •u
Price as at
15.1?.78 ·
I/B
0
13,87
1/T
107, 74
Clf Cost of COftlmunity crude oil supplies.
Pril au aoh ·de j1&1n 19114 Price as at JWle 1984 Evolution (X)
1,10,84 /15.1?.78
-;;
TALSMANDENS GAUPPE - SPRECHEAGRUPPE - SPOKESMAN'S GROUP - GRQU)E DU PORTE-FMOLE OMA/J.A EKnPOI:ClllCl'Y' TYl10i' -GAI.PPO DEL PORTAi/OGE .:. BUREAU VAN DE WOOROVOERDER
••
.
..
• •
.
.
••
.
••
. .
••
...
•
• ••
.
• •
..
.
••
..
•
.
•
.
·-·.
••
•
•• •
•
• •
.
.
.
.
.
. .
. . . .
.
.
.
.
.
.
. . .
. .
.
.
.
.
.
.
.
.
.
. .
. . .
.
.
. .
.
.
.
. . .
. .
.
. ...
•
•
••
•
• •
•
•
•• ••
•••
•
•
•
•
•
•
•
••
••
•
•
•• ••••
•••••
•
•
•
••
••
•
•
•
•
•
•••
•
•
•
•
PRISSl;.MIDDHflSI • MITTHLUNG AN OIi PRISSI • PRISS.,:~Hl~qt • INfQRMATl~N A
ltlRISSI
ANAIDINDIH
na
!l~Jgq
i
dNf B,~w~~IHI}
IJA~f§ • Mifii'dUW
IAN l1°1iffre
r
4
•
---... ~----·
l/ '-I
I
7.
'f / /
The weekly oil bulletin, published by the Commission,
gives
the latest available data
relating· to price development in the
Member
States and for the Community as a whole.
The Commission considers that the bulletin contributes to improved transparency as
regards Community oil markets.
The figures given in each bulletin follow the development over time of certain prices.
They permit a comparison at any instant in time between Member States but such a
comparison may not be representative of international price relationships over a longer
period. Moreover, it is evident that such a comparison is limited even if fluctuations
in exchange rates are ignored; althoug~ valid for identical products sold to the same
categories of consumer no account is taken of market structures, (the product categories
reported are not in every case representative of the bulk of sales for each product in
each country), quality specifications and methods of distribution which are unique to
each Member State. In this context the essentially indicative nature of some elements.
of table 2 is emphasised.
A detailed methodology will be
appended
to the bulletin published at the beginning
of each quarter.
The Commission Oil Bulletin is freely available on demand (telephone 235.35.75).
/ Weekly summary
I
Evolution (in X) of Community indications for
•
1°) Weighted average pre-tax prices
for principal oi~ products at 8.10.1984
compared with 15.12~1978
compared with previous week
Weighted average CIF cost of
oil supplies for June ~984
compared with 15.12.1978
crude (1)
(Table 3)
(Table 2)
•
+61X
..
+0,95X
+112,50X
(1) The CIF supply cost is derived from monthly declarations by;Member States (see
Oil Bulletin 252 for methodology).
..
KOMMISSOIEN FOR DE EUROPJEISKE F.IELLESSKABER - KOMMISSION DER EUROPAISCHEN GEMEINSCHAFTEN .COMMSSIOf\l OF TIE EUROPEAN COMMUNITIES - COMt.tSSION DES COMMLtWJTES ElRJPEENNES -EnlTPOrlH TON EYPOflAfKON KOINOTHTON
....
,1v ••
ua lndte1tif1 ll1lldaald1lr .. ... prh ... ,. tlHI • ll COll-tilft enIn!'"
2fUS'Kr
lffflllr lndtcattve conwr price level• tn nptt-l currenctH • TIH Ind . . 111
l1Hnc• ,_.r 11-• noraal1
l'r . . tua 111oltne lefllllr 111oltne
1CICIO L 1CICIO L
CZ) CZ)
. . , . . . . (fl)• 16.3i!O 15.600
... r.
,.,
i!.915 2.aaoIINtHllln CM) 763 704
IUH CN> :S0.9U
21.,.
f r -
,,,,
2.201,20 2.076,00lrel.,.. c1,t11t r> 280,90 273,51
lt1U1 CLtre> · 457.540 415.1111
LuaNINlur1 C,L) 15.240 14.460
llltlerllllll CPU 126 719
Ullttetl •• , . . . cu 191,:SO 114,30
.l'rh au
l'rtc•• H et 1 1•10•1
*
lltol l aoteur IINll clleuft111
Aut-tlve IIIOH NHtlllf IIIOH 1CIIIO L 1CIIIO L
(Z) (3)
15.950 14.564
i!.780 2.550
7$9 101
20. 193 20.193
2.225,10 2.124,50
216,44 232,91
465.390 446.311
14.IOO 14.240
161
aaz
191~90 220,10
, ... , 1
,
•.
•wt
h1lul MTIle1tdlll.l ••l Otl IIIC TIMI
,,,
12.1n 2.•5'"
15.4ft 1.159 116,S:S M4.6St 11.617'1ft
1 .. ,10
(1) 1'rt1 le plu1 1ouvant pr1ttqu61 tt etn1t repr6Hnt1ttf1, "lon lea . . tlleure1 e1tt . . tton1 • • eapertt . . , ltltl llllltret,
du .. r,116 p6trolter de cheque ltat lletlllre.
l'rtcH aoat fr-..ntly clla"lfd and thUI reprHentattve, of tha oil •rllet tn Hell IINller ltate, INON1t111 to tlle lleet 1111 . . 111 of the n1tt0fllll 11pert1.
CZ> l'rh • la poape/l'ullp prt ce.
<3> l'rt1 pour ltvr1taon tie
2.aaa • ,.aaa
lttr11/1'rtc11 for dlltv,rt,, of1,aaa
to 5,CIIIO litre,.(4> l'rl1 pour ltvret11111 tnf6rteure1 t 2CICIO tOMH par aoil · ou tnf6rteurH t 14.000 , _ par OIi. l'rta frenco
._,our,.
l'rlcn for offtn11 of , . . , tun 2,aao ton• per alfttllor
lHI tllen 24..,iooton,
per ynr. taltvoreclc - ,
l'rtff1. ·•• Prh ...,...,.,111,1-
prtc11.Nivuux indic1Hh h•bda.1d1irH dH pril hors t11H 6 l• con101N11tion tn doll1rs courantl llnkly lndicuivt con1uaer price ltvtl1 In currtnt doll1r1. T11 and dutlt1 11cludtd (1)
hl9iqu, • ... r. huUchlend lllH Frenct lrtlend Itel le Luatllbour9 lhdtrlend Unitod ltlnldoa
c.1.1.11.1.c.
1> lloytnnt/Avtr1ge
m
b) Vert1tlon IIO)'enne I Aver111 v1rl1tlon I
1.10.14 /15.12.78
c) Vertetion 11111,nne sur
lH 5 produlu Avtr•ge v1rl1t Ion for all 5 products
1.10.14 /15,12.71
Entnce super l'reaiua 11soline
1000 L
m
264,14 264,14 251,6Z i!48,40 i!35,19 215,96 Z42,63 247,31 i!40,76 237,05 243,12 +26lll'rh au 1'rict1 H It Esstnct nora1lt lt9ul1r 911ollne
1000 L
m
253,15 254,40 232,17 232,37 222,47 211,51 220,54 234,65 229,91 221,JI 2:S0,56 +251I. 10. 1914
.. Soil IIOttur 61soll ch1uff111 1utoaotiv1 91soll Htttlng 911oil
1000 L 1000 L
m
(J)251,83 236,34
252,58 231,61
ZS0,31 231,11
161,17 161,17
i!31,51 227,67
i!91,60 237,11
246,79 236,61
240,17 231,0I
250,96 233,76
246,47 272,74
245,44 234,15
+411 +621
I
+611I
..
TAlj.lAU I
I
TMU .
futl ltsldual NTS
lt1icklll futl
,..-
lil NH(4) 191,11 113,91 1U,91 124,11 197,01
,.,,.,
1fl,37 119,11 196,4'aos,a
1'2,67 +102,'
(11 Pru lts plus sow,nt pr,Hquts tt 1,ns, reprtstnt1t1U, 1tlon lH •Hleures est1a1t1ons Cits tx,eru des 1t1u -r11, 1111 . . ,ci,t p6troller de cheque Et1t lltabr,.
l'ricts 1111st frequently cll1r91d ind thus represtntatlvt of tllt oil . . r.,t In e1clt lltabtr Stat,, 1ccordl"9 to tht btst 1111 .. tt• ef tltt nit ionel uperu.
(2) l'rla t l1 PNf)e/ Puap prlct
CJ> l'rla pour llvr1ison de Z.000 • 5,000 litres./ l'rlcts for dtllvtrltt of 2,000 to 5,000 lftrts.
(4) l'rla pour llvr1ison inftrieurt • i!OOO tonnn par 111111 ou lnftriturt t.24.000 tonnes pu en. Prix fr1nco cons-ttura. l'rlcts for ooft1k11 of less thin 2,000 tonl per aonth or ltss then 24,000 tons per 111r. ltllvtred Consuatr l'rlcti. CS) Le ao,,nne rhultt d'une pondtntion des qu1ntlth c011IOMte1 dt clt1que produit concernt eu coura de l'anntt 1912
TIit rtsult of wightin9 tht prlcts of tltt products conctrned by tht qu1nti_tit1 c"onsUHd durin9 tltt period 1"2
• l'rta 11alaeua/Neai111111 prlcts.
Clllit CAF D'1pp•ovl1ionn1•ent en brut dt l1 • C•uniutt,
Clf Cost of C01111unit1 crude oil supplltl,
Prh IU
Prlct as It
15.1?.71
l'rla 1u aoi1 dt juln 1914
Pri ~. 11 It Junt 1984
Evolution (I)
I. 10.14 /15, 1?.78
!!! .
!!!
13,11 107,74
TALSMANDENS GRUPPE - SPRECHERGRUPPE - SPOKESMAN'S GROUP - GROUPE DU PORTE-PAROLE OMAtlA EKnPOrnnov TYno'( - GRUPPO DEL PORTAi/OGE -8U'lEAlJ VAN DE WOORDVOERDER
••
.. . . .
•
•
•• ••
.
••
. ... .
•
•
••
•
..
•
.
••
.. .
•
.
•
·-·.
••
•
••
•
•
••
•
•
• • • •
• •
• •
•
• •
•
•
•
• • • • •
• • •
•
• • • •
•
•
•
•
•
•
• •
• •
• •
•
•
•
•
•
•
• • •
•
•••
•
•
••
•
•
• •
•
•• ••
•••
•
•
•
•
•
•
•
••
••
•
•
••
•••••
••••
•
•
•
••
••
•
• •
•
•
•••
•
• •
•
PRESSE·M{DDEULSE • MITTHLUNG AN DH PRESSE • PRESS·REUASE • INFORMATION A LA PRESSE
ANAKDINDIH rlA
m~iJ&l\s"t9}1~1RMt~~,,B~~\6PEDEBfHWhlR
ot,tift
0ber,
1984
•
l/ (,/
I
7,
'I I
I
The weekly oil bulletin, published by the Commission, gives the latest available data
relating·to price development in the M~mber States and for the Community as a whole.
The Commission considers that the bulletin contributes to improved transparency as
regards Community oil markets.
The figures given in each bulletin follow the development over time of certain prices.
They permit a comparison at any instant in time between
Member
States but such a
comparison
may
not be representative of international price relationships over a longer
period. Moreover, it is evident that such a comparison is limited even if fluctuations
in exchange rates are ignored; although valid for identical products sold to the same
categories of consumer no account is taken. of market structures, (the product categories
reported are not in every case representative of the bulk of sales for each product in
each country), quality specifications and methods of distribution which
are unique to
each Member State. In this context the essentially indicative nature of some elements
of table 2 is emphasised.
A detailed methodology will be appended to the bulletin published at the beginning
of each quarter.
The Commission Oil Bulletin is freely available on demand (telephone
235.35.75).
I
Weekly summary
I
Evolution (in X) of Community indications for
•
1°) Weighted average pre-tax prices
for principal oil products at
15.10.1984
compared with
15.12.1978
compared with previous
week
2°) Weighted average CIF cost of crude
<
1
>
oil supplies for : June
1984
(Table 3)
compared with
15.12.1978 ,
(Table 2)
...
+57X
-2,SOX
+112,SOX
(1) The CIF supply cost is derived from monthly
declarations
by:Member States (see
Oil Bulletin
252
for methodology).
KOMMISSIONEN FOR DE EUROPJEISKE FJELLESSKABER - KOt.MSSION DER EUROPAISCHEN ~MEINSCHAFTEN ..
· : : : . : ' U et I 15.10.19M
bNIICe . _ r ltNMe - . l e
...
,
...
...
u
clllldf ... , . , 1t1t411M 1111... ltM .... lertlNlfM Allee.ttve .... tl
... u ...
u
· ant . . , ••l til•c
um
L 1•1. 1 • L 1GII L,....
(l)
m
m
n1
IUlleltt ...
c .. ,.
16.320 15.600 1 S.950 13.?0t 11.1'3...
CIIO 2.735-2.620
2.615 2.6'0 2.105'Deuttclllllld (Ill) 762 703
761
-
,..
Illas CN)
:so.•
28.911 20.19320.1'3 1J.492
,,
...
(Ff) 2.259.,00 Z.117 ,00Z.310.CO Z.205.,20 1.'19,;
lf'9land <lrflll C> ZI0.,90 273.,51 216,44 HZ,'1 116,53
ltllta (Ltre) · 457.540 415.UO 465.390 446.311
364.m
l.llllNllourtOL> 15.240 14.460 · 14.aoo 14.240 11.657
llederllNI OU 134 797 161 I02 614
1111tt1t1111..-..
cu
191.,'30 114.,30 I 201:90 217,00 165,10•
.
CO l'rh le plus INIIIWfflt prattQUH et atnst reprflelltatffs , Hlon lH •Hleuree Htiuttons • • e_,.,.ts • • lt1t1 ..._r••• _ du urdlt pttrolter d e ~ Etat IINbre. .. ·
l'rfcn - t frlQUlfttlp
cllaftted
and thus repreNfttattve., of tu oH •rlllet fn ocll lll*er State, eccordt"I to ' "!teat
e1tfaete1 of tlle natillftlll eaperts.
CZ> l'rh I le,...., ... price.
:~SJ
l'rh pour lfvratson de 2.000 I 5.000 lttras/l'rfCH for dtlfverfff Of Z,OGO to 5,0GO l ttrH.\.
;<4) l'rh pour lfvl'liaons inftrfeures I Z008 tOMts par aofl ou h1ftrfeurH I 24.IIID tOMH por an. l'rb trance c..._t...,,. ' l'rlcH for offtelllH of le11 tllan 2,000 tons per - t l l or lHs tllan 24,0GO t -,er ,ear . . . lfverld con...., l'rfcH.
·•• l'rf• . . 1taau1/lla1iaua prices.
Nlv•au• indicat;f, hebdoaadaires des pr;, hors ta••s • la co,,s .... tion en dollars cour1nt1 llffklp Indicative cons.-r price levels in current dol l1r1. TH and duties Hcludeci
<h
(Tableau llebdoaaclaire)Essence super Pr . . iua psol ine
1000 L
(2>
Prh au
!'rices Hat Essence noroale bgular psol ine
1000 L
(2)
15.10.1914
linoil aoteur Glt0il ch1uff1 . . 1ut.0110tiv• 91soil Neat ing 9110il
1000 L 1000 L
(2)
m
fuel ••1ldu1l MTS lesidual fuel Oil MSC
TOftCle
(4)
' . . lgique. 257.,33 245.,97 211.,49 216.,16 192.,ZS 9 - r k 241.,21 231,14 230.,70 232,02 115,70
!Nutschlltld 242.,63 223,14 244,54 220,91 180,16
lllll 242.,35 226.,71 157.,93 157.,93 1Z1, 16
,r_e 234.,57 219.,13 139.,17 221," 19',27 Ireland 277,95 270.,71 213,43 2:S0.,46 1~.57
Italia 236.,60 215.,06 240,66 230,IO 111,64
~uaNbourg 240,30 221.,00 133,36 ZZ4,53
1p.,III
l'ederland 2S5.,59 225.,14 24',22 226,55 t9:S,UUnited Ki ... 2'1,0S 222.,51 24',14 262,07 '",3'
C.E.E./E.E.C.
,
1> IIO,enne/Average (5) 237.,37 223.,42 240,75 227,90 1U,59
_ It) variation ao,enne I
Average variation I
15.10. 14, '15.12.71 +131 +221 +JU +571
...
c>
V1ri1t Ionao,-
sur les 5 produitsI
Average variation tor
[
+571 'ell 5 products
15.10.14 115.12.71
CU
Prh [es plus 1ouvent pratlquh et 1lns1 reprtuntatifs, selon (es •Hleures estlNtions des ••,.rts des ltats IGiiiir'tts, du aerclit pttrolier de chaque £tat Neabre.Prices aost frequentlJ charged and thus representative of the oil .. rket in each Neaber Stet•, according to the best estiaates of
the nattonal eaperts.
a>
l'ria • la pofl{)e/ f'uap priceU> Prh pour livraison de l.000 • 5.000 litres./ Prices for deliveries of '2,000 to 5,000 Litres.
(4) Prh pour livrahon inftrieure • 2000 tonnes ~r aois ou inftrieure • 24.000 tonnes par 1n. l'rh franco con-teurs.
' Prices tor ooftakes of less than 2,000 tons per aonth or less than 24,000 tons per. ,ear. Delivered Consuaer Prices.
(5) LI ao,enne rtsuLte d'une pondtr•tlon du quantltt, cons-tes de ch1que prod"it c-ernt au cours de l'IIVIM 1tl2 _ _ _ _ ....,
j
The result of ueighting the prices of the, products concerned bJ the quantities consuaed during the period 1911r
fABI.EAU J. *
Prh N1ia1u1/IIHi•U!I prices. - - - . TAIUi'
''
i
J
Cout tAF D'approvisio,,neaent en brut de La Caaaunautt.
Clf Cost of
c ...
unitJ crude oil supplies.Prh IU
P,rice H at
15.1?.71
Prh 1u aoil de, juin 1914
Price H at June 1914
Evolution (I)
15.10.14 /15.12.71
!!!
13.,17
~
-1!!.
107.,74
TALSMANDENS GRUPPE - SPRECl;IE~RUPPE· - SPOKESMAN'S' GROUP - GROUPE DU PORTE-PAROLE OMAM EKnPOrnnoY TYllO'i' - GRUPPO DEL PORTAVOCE - BUREAU VAN DE WOORDVOERDER
••
.. . .
•
•
••
.
••
. .
••
...
•
• •• •
.
..
•
.
••
.. .
•
.
• ••
·-·.
•
••
•
•
• •
•
•
•
• • • •
•
•
• • •
• •
• •
•
• •
•
• •
•
•
•
•
•
•
•
•
•
•
•
• • • •
•
•
• •
• •
•
•
•
•
•
• •
•
••
•
•
••
•
•
•
•
•
•• ••
•••
•
• •
•
•
•
•
••
••
•
•
•• ••••
•••••
•
•
•
••
••
•
• • •
•
•••
•
• •
•
PRISSl·MEDDELELSI • MITTHLUNG AN DH PRISSI • PRISS·RIUASI • INfORMATIDN A LA PRISSI
ANAKDINlIH rlA TON
TYDD • INfDRMAZIONI ALLA STAMPA • MIDIDILING AAN DI PERS
9russefs,
30 October
1984.
COMMISSION OIL BULLETIN NO.
265
'-/'tJ7,'11/
The weekly oil bulletin, published by the Commission, gives the latest available data
relating to price development in the Member
States and
for the Community as a whole.
The Commission considers that the bulletin contributes to improved transparency as
regards Community oil markets.
The figures given in each bulletin follow the development over time of certain prices.
They permit a comparison at any instant in time between Member States but such a
comparison may not be representative of international price relationships over a longer
period. Moreover, it is evident that such
a
comparison is limited even if fluctuations
in exchange rates are ignored; although valid for identical products sold to the same
categories of consumer no account is taken of market structures, (the product categorie~
reported are not in every case representative of the bulk of sales for each product in
each country), quality specifications and methods of distribution which are unique to
each Member State. In this context the essentially indicative nature of some elements
of table 2 is emphasised.
A detailed methodology will be appended to the bulletin published at the beginning
of each quarter.
The Commission Oil Bulletin is freely available on demand (telephone
235.35.75).
I
Weekly
summary
Evolution Ci n
X)
of Comm-unity
i
n'c;l.i c.!lt.ic;>ns for
1°) Weighted average pre-tax prices
for principal otl products at
22.10.1984
compared with
15.12.1978
compared with previous week
Weighted average CIF. C(?St of
oil suppli.e.s .. Jor. Jwne
-4984
comi:,at~d}
~.:i"tJr
15
.·12 .•
1'978.
crude
<1
>
(Table 3)
(Table
2)
•
.+1;.
· +112,5ox
(1) The CIF supply cost is derived from monthly declarations by.Member States <see
Oil Bulletin
252
for methodology).
KOMMISSIONEN FOR DE EUROPJEISKE F.tELLESSKABER - KOMMISSION DER EUROPAISCI-EN GEMEINSCHAFTEN
;
.l'rh au
l'rtcH aa at I 22.10.1914
, ... .,, j
,
... .
E11anc1 11411,
11.-,
norula leaoil 110taur leaol l clleuff11t J111l le1lul NTIl'r•I . . . . IOl lM h.,lar IHOllM Aut-tiv• ....
n
11nt111111aou htt . . l fuel til•c
1CIDD L 1DDD L 1CIDD L 1DDD L
,_
(2) (2) (2) (J) U.l
lllll.,_ Cf9>• 16.640 1S,920 14,991 13,607 1Z,43t
._,,
(IIC)--
2.670 2.S55 2.615 2.630 2. 105Dautacllland (Ill> 760 701 767 614 567
Illas (N) 30.911 21.911 20.193 20.193 15.492
J , _ .
,,,,
2.259,00 2.117,00 2.310,DD 2.205,20 1.919Ireland
u,1 ..
I> 290,66 213,34 291,63 Z45,10 197,51ltalta <Lira>· 457 .540 41S.IID . 465,390 446,311 367.192
Lua ... CfL> 15.240 14-460
~.aoo
14.240 11.657. . . ,land OU 1126 719 127 769 691
Unltld Ith . . .
cu
191,30 114,30 201,~ Z16,90 165,DD(1) ,,11 la plue - a n t pratlQUh at alnsi rapr61antatifa , 11lon lH •tllaurH 11tlNtlon1 dt1 111111rt1 dtl Etata ...,. .. ,
du •rcll6 p6trol lar • cllaQua Etat IIHllra.
,,1c11 • • t frlQllffltlr clla"lld and tllua rapruant1ttv1, of 1'111 oil . . ,,,t In aacll lllllllar State, accardlnt to tlll Nit lltlNtH of tlla natl-I •
.,.,ta.
<2> Prla • la IIOlllllll'lap prlc1.
<3> Prla pour Uvratson • 2.DDD • S.DDD lltra1/l'rlc11 for claltvarl11 of Z,DDD to S,IIIO lttro1.
<6) Prla - Uvral- lnf6riaura1 • 2GDD t - • par • h OU l n f 6 r l - • 1!4.CIDD t - par an. l'rb f r - - - • · l'rlcn for offtn•• of laH tun
z.- ,_
par - I I or l11• t._.i..-
t - par ,.., . . . llvarollc -
PrlcH.·a,
l'rla - 1 - / l l a a l - prlcH.I • .
---N i - lndlcatlh . . . Ir . . • • pria hors tHH • la - t l o n • dDUan - • • llfflllr indicative - - prict lavah in current dDll1r1. , . . OIIII . . . 01cliiilii (1J
<T•loMI 11 . . . 1,.,
hMnCI i.ar , , . . . ,olina
1DDD"L
(2)
111,tqua • 266,95
...
,.
239,76llut sell land 246,40
EllH 246,05
Prla .., Prlcn aa at
-
·
..
E l ~ • - l •
1..,1,,
,.solina 1DDD L(2)
255,40 229,43 217,21 230,17
22.10.19'4.
S.1011 - - S.soll cllauff°" - - I v a . . IOil . . . ttne
..-n
.
1CIDD L 1DIIIL
,
m
(J)240,61 218,29
234,12 236, 17
241,67 221,76
160,33 160,33
Juel 1e1tduol 11'11
111tduol Juel
,_
Ott •(4)
199;55 119,02 113,13 123,01
i Franca Ireland 231,79 223,71 244, 11 213,10 ZD2,6S
291,97 214,62 299,91 246,20 191,40
Italia 239,73 217,90 243,15 233,15 192,39
L11aNbour1 244,49 231,91 237,43 221,45 117,01
Nederland , 237,49 2Z6,15 237,71 2Z1, 10 200,69 '
Unitld Ith ... 221,66 220,29 241,33 259,26 197,Z2
C.E.E./E.E.C.
•> llo,anne/Avar . . .
m
239,71 2Z5,92 243,0S 229,45 191,52b) variation IIO,etllll I
Avara,a variation I +Z4X +231 +40I +511 1011
22. 10,14 11S.1Z.71
c) Variation II01'fllll 111r
I
lH 5 produitl
I
Average variation for
+Sil
I
all 5 products22.10.14 115.12.71
( n l'rta lH plus 1owant prah.-. et a,n11 raprnentatt u, Hlon 111 Mtll111r1& HttNttons 1111 1apart1 - atetl
-re•, -
• r-(2)
(3)
. (4) (5)
pttroliar de ell•- Etat 11N11r1.
l'ric11 aost frequantlr clla,..cl and tllus rapra-ative of tlll oil Mrll1t In Hell llnlNr State, accni . . to tlll bait Hti•tN et
the nati-l HP1rt1. Pria t •• poape/ l'lap pri Cl
Pria poyr livrailOII • 2,DDD I 5.CIDD litres./ l'ricH for *llvariH of Z,CIDD to S,CIDD lttr11.
Prh pour llvrahon inftri111r1 t 2000 tonnes par aoi1 OU inf6rieura • 24.CIDD t - • par an. llrla f r - • c o n - t - a . !'rices for ooftakn of lus tllan 2,DDD t - per - t l l or les1 -than 24,DDD tons par ,ear. laliwnd C . . - r l'rtcff. La IIOJ'enn• rbulte
d'-
poncltraUon dts ciuantttts con•-*'• de ch•- procluit,_,,..,.Ml_..•
l ' _ . . 1912The rHult of wigllti,. tlie prices of the products concel'MCI bp tlle - t i t i H c . . - d durtne th po,111111 1912.
• l'rh NaiMua/11 .. i - ~icu.
- Cout CAF D'approvi sionnMent en brut de la
c-... c•.
CIF Cost of Coaaunity crude oil supplies.
Pr;a au Price •s •t
15.1?.71
Pri, au aoil de juln 1914
Price as at June 1914 Evolution (I) 22.10,14 /15.1Z .71
!l!
!!!
13,17 107,74
TALSMANDENS GRUPPE- SPRECHERGRUPPE - SPOKESMAN'S GROUP - GROUPE DU PORTE-PAROLE 0,/,AM EKnPOrnnoY TYnoY - GRUPPO DEL PORTAVOCE - BUREAU VAN DE W00RDVOERDER
••
..
•
.
•
.
••
.
••
.
••
.
...
•
• ••
. ..
•
•
.
••
..
•
.
.
•
·-·.
••
•
••
• •
• •
•
•
• • •
• •
• • •
•
• • • • • • •
•
• •
• •
•
• •
• •
• •
•
•
• •
•
•
• • • •
•
•
•
•
•
•
• •
•
•
• •••
• ••
•
•
• •
•
•
••
••
•••
•
•
• •
•
•
•
••
••
•
•
••
•••••
••••
•
•
•
••
••
• •
•
•
•
•••
•
• •
•
PRESSE·MEDDllllSE • MITTEllUNG AN DH PRESSE • PRESS·RHEASE • INFORMATION A lA PRESSE
ANAIDINDIH rlA TON TYDD • INFORMAZIDNE AllA STAMPA • MEDEDHING AAN DE PERS
..
Brussels, 8 November 1984 •
COMMISSION OIL BULLETIN NO. 266
The weekly oil bulletin, published by the Commission, gives the Latest available data
relating·to price development in the Member States and for the Community as
a
whole.
The Commission considers that the bulletin contributes to improved transparency as
regards Community oil markets.
The figures given in each bulletin follow the development over time of certain prices.
They permit
a
comparison at any instant in time between Member States but such
a
comparison may not be representative of international price relationships over a longer
period. Moreover, it is evident that such a comparison is limited even if fluctuation~
in exchange rates are ignored; although valid for identical products sold to the same
categories of consumer no account is taken of market structures, (the product categor,e~
reported are not in every case representative of the bulk of sales for each product in
each country), quality specifications and methods of distribution which are unique to
each Member State. In this context the essentially indicative nature of some elements
of table 2 is emphasised.
A detailed methodology will be appended to the bulletin published at the beginniny
of each quarter.
The Commission Oil Bulletin is freely available on demand (telephone 235.35.75).
Weekly summary
1
Evolution (in%) of Community indications for
•
1°) Weighted average pre-tax prices
for principal oil products at 29.10.1984
(Table 2)
compared with 15.12.1978
'
+59%
compared with previous
week
+0,40%
2°) Weighted average CIF cost of crude <1
>
oil supplies for June 1984
(Table 3)
compared with 15.12.1978
+112,50%
(1)
The CIF supply cost is derived from monthly declarations by. Member States <~ee
Oil Bulletin 252 for methodology).
KOMMISSIONEN FOR DE EUROM:ISKE FJELLESSKABER - KOMMISSION DER EUROPAISCHEN GEMEINSCHAFTEN
,
I I
Niveaua incUcatH1 hebdoudalrt1 cles prh hors tHH • la con-tion en - i t s natlonalt1 IIHkly incUcative con, . . . , price levels in national currencies • Tau and dutit1 ucluil.a (0
CTablHu hebdolladain>
Essence super Essence norule , , . . 1 . . gasol in• le911lar ga10Une
1000 L 1000 L
(2) (2)
Belgique <fl>• 16.080 15.440
Danaarll (DK) 2.915 2.800
Deutschland CDII> 758 698
EllH (DI) 30.988 28.988
franc. (ff) 2.259,00 2.117,00
Ireland Urhh Ill 290,66 283,34
Italia <Lire>· 457 .540 415.880
Lu1Nbour1 CFL> 15.240 14.460
Nederland Cfl) 813 777
United l<ingdoll CU 191 ,30 114,30
.,,1a
au Prices Hat&asol l 110teur Aut OIIOt he aasoH
1000 L (2)
15.390 2 .116() 765 20. 193 2.310,00 298,63 465.390 14.800 828 201,"90 29.10.1914
&asoil· chauffa . . lleatint gasoil
1000 L (3) 14.000 2.630 663 20.193 2.205,20 245, 10 437.615 14.240 769 216,90 TAILUU 1 T&I
f . . l lesidutl NTI lesi . . l fuel OH NSC
T -(4) 11.906 2.105 567 15.492 1.919 197,51 367 .381 11.657 687 165,00
(1) Prh le plus sowent pratiqu6s et ainsi repr•Hntatlfs , Hlon let •illeurH estlutions des • - t • ci.s Etate IINllres, du urch• p•trol ier de chaque Etat lleallre.
Prices aost frequently changed and thus representative, of the oil urket·. in each llealler State, acconlint to the belt
estiaates of the national e.perts. (2) ,rh 6 la poape/,.-P price.
(3) Prh Pour livrahon de 2.000 6 5.000 litres/Prices for deliveries of 2,000 to 5,000 Utres.
(4) Prh ,our livraisons inftrleures 6 2000 tonnes par aoi1 ou lnftrieures 6 24.000 tonnes·par an. Prh franco con-teurs. ,,ices for offtaku of less than 2,000 tons per - t h or less than 24,000 tons per yHr. hlivered con, . . . , ,,Ices. ·•• , , h auiuua/llaai- prices.
---·---·---....---Niveaux indicatih hebdolladalru des prh hors tnH 6 la cons-tlon en dollars cour-1
lleekly indicative c - - • price levels in curr•nt dollars. Tu and dutiH Hcluded (1)
(TablHu hebdoudaire) ,,;a au 29.10.1914
,,ices as at
..
EsHnce super EsHnce norule &asoil 110teur &asotl chauffage fuel leslMl IITI Pre•i . . gasoline le911lar gasoline autOIIOtive gasoil Heating gasotl
..
lesldutl fuel Oil NSC1000 L 1000 L 1000 L 1000 L
..
,_
'
(2) (2) (2) (3) (4)
Belgique• Danaark 260,27 249,91 249, 10 226,61 192;11
263,77 253,37 258,80 237 ,98 190,48
Deutsch land 247 ,59 227 ,99 249,87 216,56 115,lO
Illas 247 ,94 231 ,94 161,56 161 ,56 123,95
France 240,71 225,58 246, 15 234,98 20.,48
Ireland 293,53 286, 14 301 ,58 247 ,52 199,46
Italia
Luxembourg 240,71 246,68 218,79 234,05 244,84 239,55 230,23 230,49 193,211
111,68
Nederland 235,58 225, 15 239,93 222,83
199,07
UnHed Kingdom 231 ,57 223,09 244,40 262,55
199.73 C.E.E./E.E.C.
•> lloyenne/Av . . age (5) 241 ,45 227 ,55 245,68
228,59 192,39
b) variation aoyenne I
Average variation I +25X +241
29.10.1984 /15.12.78 +411 +581 +1021
c> Var;ation aoyenrw sur
I
les 5 produits
I
I
Av•rage variation for +59X
all S products 29.10.1984 /15.12.78
CH Pru lH plus souvfflt prat1qut1 et alnn representatns, Hlon lH N1lleurH nt1ut1on1 •• experts OH Etatl "-res, OU NrCII•
pttrol ier de cheque ltat lleabre.
Prices aost frequently charged and thus repreHntatlw of the oil urket in each lleaber Stat•, eccONling to the beat esttNtn of
the national experts. (2) Prh 6 la p - e / Piap price
Cl> Prh pour livraison de 2.000 ·• 5.000 litres./ Prices for deliveries of 2,000 to S,000 litrH.
C4) Prh pour Uvralson inftrieure • 2000 tomes par aois ou inftrieure • 24.000 tonnes par an. Prh fral\CO con-teura. PricH for ooftakes of less than 2,000 tons per aonth or less then 24,000 tons per yur. hlivered Cons . . . , PrlcH. (5) La IIOY,!'nne result• d'..,. ponderation des quantitts consoaates de ch•- produit concerne au court de L 'annH 1982.
The result of wighting the prices of the products concerned by the qu•ntlties cons . . ed during the period 1912
-• Pri1 aa1iaau1/llni- prices.
I
TA8LUU 3.cout
CAF D'approvisionne•ent en brut de l1Coaunaute.
Clf Cost of COMUnHy crude oil suppUes.
Prix 1u
Price IS I t
IS.1?. 78
Prh: 1u aois de juin 1984 Price 1s at June 1984
Evolution <X> 29.10.84 115.1?.711
TALSMANDENS GRUPPE - SPRECHERGRUPPE - SPOKESMAN'S GROUP-GROt.J'E OU PORTE-FV>.ROLE OMAM EKnPOHXlOY TYflO\' - GRlPPO DEL PORTAVOCE - ~ VAN DE VVOOROVOEROER
••
..
•
.
•
.
••
.
••
.
••
. ... .
•
•
••
•
..
•
.
••
..
•
.
.
•
· - ·
••
•
••
•
•
• •
.
•
.
• • •
.. .
•
• •
•
•
.
•
•
. ...
•
•
•
• • •
•
• • •
• • •
.
•
.
•
• •
•
• •
• •
.
•
• • •
..
•
•
.
•
•
• •
..
•
•
....
• •
• •
•
;···
•
• •
•
••
•• •
••
••
•
•
• • •
•
•
••
•
•
•••••
•
•••
•
•
•
•
PRISSl·MIDDHHSI • MITTIILUNG AN 011 PRISSI • PRISS·RIUASI • INFORMATION A LA PRISSI
ANAIOINDitrlA TON
TYDD • INF ORMAZIDNI ALLA STAM PA • MIDIDltlffl
tW
Dl=flfff
ember 1984.
COMMISSION OIL BULLETIN N0.267
l.ff17· 'fl/
The weekly oil bulletin, published by the Commission, gives the Latest available data
relating to price development in the Member States and for the Community as a whole.
The Commission considers that the bulletin contributes to improved transparenct as
regards Community oil markets.
The figures given in each bulletin follow the development over time of certain prices.
They permit a comparison at any instant in time between Member States but such a
comparison may not be representative of international price relationships over a longer
period. Moreover, it is evident that such a comparison is limited even if fluctuations
in exchange rates are ignored; although valid for identical products sold to the s~me
categories of consumer no account is taken of market structures, (the product categories
reported are not in every case representative of the bulk of sales for each product i~
each country), quality specifications and methods of distribution which are unique to
each Member State.
In this context the essentially indicative nature of some etem~nts
of table 2 is emphasised.
A
detailed methodology will be appended to the bulletin published at the beginniny
of each quarter.
The Commission Oil Bulletin is freely available on demand (telephone 235.35.75).
Weekly summary
l
Evolution (in%) of Community indications for
1°) Weighted average pre-tax prices
for principal oil products at 5.11.84
(Table
2)
compared with 15.12.1978
..
+66%
compared with previous week
+
4%
2°) Weighted average CIF cost of .crude
<
1
>
oil supplies for June
1984
<Table 3)
compared with 15.12.1978
+112,50%
(1)
The CIF supply cost is derived from monthly declarations by. Member States
Csee
OiL Bulletin 252 for methodology).
KOMMISSIONEN FOR DE EUROPIEISKE F.IELLESSKABER - KOMMISSION DER EUROPAISCHEN GEMEINSCHAFTEN
•ivHua lndicatlh hebdaaedalrH • • prh hon tHH • la con•-tion en - • H naHonalH 1Ne11l1 lndtcetlve conauaer prfce level, In national currencte•. Tase ..id dutiea escliiiiii
c
.,,ts
,,tee,
au : 5.11.1914 H etE1sence 11419r IHtnee norNle &asot l IIOteur Satotl cllauff• ·fuel ...
w.t..,.
,,eatua ga1oline llfUl•r gaaoltne Autoaottve .... tl lltatl"t t1NH .... Mt fuel 141., . ~
1000 L 11100 L 1000 L
I
I1000 L 1
-(2) (2) (2) (3)
w
. . l,t""' (Fl)• 16.080 15.440 15.390 14.000 11.906
•-rti
(H)·-· 2.915 2.800 2.860 2.630t.115
huuchland <NI> 756 697 76] 659
-lllH (ti) 30.988 28.988 20.19] 20.19]
1S.412
France (ff) 2.259,00 2.117,00 2 .]10,00 2.205,20 1.m
Ireland <lrhh IU 290,66 283,34 298,63 245, 10 191,51
Italia (Ltre> · 457.540 415.880 465.390 436.450 365.936
LuHllllour1 CfL> 15.240 14.460 14.IOO 14.240 11.6$1
. . . ,land <Fl) 797 764 1128 769 67'
untttd ICtntdoll
<It>
191,30 184,30 202,00 215,30 164,lO(1) ,,ta le plu1 1ouvent prettquf1 et atn1t repr•••ntatifs, selon Les .. tlleurei e1tt .. tton1 det eapertl de1 ltet1 ...,.,,
du .. rch• p•trolier de cheque Etat ... llbre. .
,rices aost frequentl1 chanted and thu1 repre1e11tative, of the oil Nrket in each lleebtr State, according tot•• best
euf .. tH of the national Hperts. <2>
,,h •
la pc111p1/l'ullp price.<]>
,,ts
pour ltvrahon de 2.000 • 5.000 litrH,..ricn for deltvtriH of 2,000 to 5,IJOO·Lttrn.<4> ,,ta pour ltvrei1on1 tnt•rteures • 2000 tonnes par aois ou ihf•rteures • 24.000 tonnes par an. ,,;. franco
,on ... ceur,.
,,tee, for otftake, of less than 2,000 tons per aonth or las, than 24,000 ton, per ,,ar. lellvertd Conauaer ,,tees.. ·,, f'rfa N•INua/lll1i .... prices.
Nlveaua indicatlfs hebdollad1lres des prta hart t1ae1 • l1 cons011111tton en dollar, couranta Weekl1 tndlc1ttv1 consuaer price levels In current dollar,. T•• end duties eacluiiia
<i>
(T 1b l uu hebclotiada fra
>
,,ta
au,,tees Hat 5.11.1984.
:
Essence super E111nce noraale Ga soil aouur &Hail chauff•I' fuel I f f t ~ fll
I
lelglqua * Oanno1rk c,uu,hland Etlu France
1 rt land lal.la li.1embourg Nederland u-,i ted Ki ngdo11 C.E.E.lf.E.C.
.,
Moyenne/Average (5) b) Variation eoyenne I Average variation I 5.1•.84 /15.12.78 c> Variation 11oyenneLu 5 produits Average variation all 5 products 5.11.84 /15.12.78
sur
for
Preaiua gasoline Regular gasoline
1000 l 1000 l
(2) (2)
271,07 260,21
274,48 263,65
257,80 237,68
255,90 239,39
250,93 235, 15
305,34 297,65
249,95 227,19
256,91 243,76
241,14 231,16
242,18 233,32
251,40 237,08
+31X +291
autOllotive gasotl HHtin9 plOH 1e,tMl fuel . . \
nc
1000 L 1000 L Tonne
(2) (3) (4)
259,44 236,00
zaa,10
269,30 247,64 1N,21
260, 18 224,72 191,11
166,76 166,76 127,'3
256,59 244,95
·"
]13, 71 257,41 2fl11'9254,24 2]8,43 1'99,91
249,49 240,05 196,51
250,52 2]2,67 204,55
255,72 272,56 281,00
255,84 237,52 1ft,12
+471 +641 +110I
+661
~ r i • Les plus souvent prat1ques et a1n11 reprisentat1f•, s,Lon Les •eiLleures estiaation1 des eaparts det !tat•
lliiiltrii,
iii eircltl
1 Pitrolier de r.haque Etat Me11bre.
I
Prices most frequently charged and thus representative of the oil 11arket in each Neaber Stat,1 accor~ftl to the !Iotte.&t ..
tet flft~e national e•oerts.
(2) ·Prix i la p,:impe/ P•J:np price
<~> Pri1 p?ur livraison de ?.000 • 5.000 litres.I Prices for deliveries of 2,000 to 5,000 litre,.
I
C4l Pri1 po~r livraison inferieure Prices for ooftakes of less than i 2000 tonnes par aois ou lnftrieure • 24.000 tonnes par an. Pria fr .. 2,000 tons per 110nth or less than 24,000 tons per year. Deliverllll ContUll9r co con,a...teuf'9. Prtoe,.<S> La moyenne resulte d'une ponderation.des quantitts conso11mtes de cheque produtt concerne au cours de l'.._... 1tlZ
T~e result of weighting the prices of the products concerned by the quantities consuaed during the period 1tlZ
T,...~~--iJ
...
TUl.1!AV
u
,
1
.
Prix 11axim1ua!f1111ieua prices. · · - - · - - - TMLE •I
. Cout CAF D'approvisionneaent en brut de la
,_unaute.
Clf Cost of Coeaunity crude oH supplies.
p,.11 au
Price as at
15.1?.78
Prix au eois de juin 1984 p,; ce as at June 1984 Evolution (%)
5.11.84 /15.1?.78
!!!
!!!
1],17 101,14
(Tableau
aensuel>
Taxes
Belgique (FB)
17.520
(
9rix de vente des produits pttroliers en 11<>n~ies nationales
Selling Prices of Petroleua Products in
National
currencies.
Essence super
PreJ1iU11
Gasoline
1000
L
(1)Hors taxes
Without Taxes
14.080
Prix
aoyens
pratiquts au
Average
of prices ruling as at
15.8.1984
.
· Essence Noraale
Regular Gasoline
1000
L
(1)Prix de vente
Taxes
Hors taxes
Pr,
x de
vente
Sellina Price
Without Taxes Sellina Price
31.600
17.360
13.440
30.800
I:::~- · I
· 6asoi l lloteur •
Aut0110tive 6asoil
1000
L
(1)
Taxes
Hors taxes
Prix de vent
Without taxes Sell ina Pri
c
9.956
13.574
23.530
Danurlt (KD)
3.395,66
2.874,34
6.270
3.370,46
2.759,54
6.130
1.027 ,21
2.672,79
3.700
Deutschland <Dfll>
675
666
1.341
667
608
1.275
595,20
651
1.246,20
El las
(DR)
26.011,72
30.988,28
57.000
24.011,43 28.988,57
53.000
"'.806,67 20.193,33
28.000
(FF)
12.910,80
France
3.085,70
2.254,30
5.340
2.099,20
5.010
Ireland
Cl.ll)
355,67
274,68
630,35
354,27
268,61
622,88
Italia
(Lire)*
'
Luxembourg (FL)
11. 780 .
14.820
26.600
11.700
14.200
25.900
Nederland (FL)
1.012
781
1.793
1.004
739
1.743
u.
Kingdoa
<ll>
224,80
182,50
407,30
223,60
174,80
398,40
.
p
fi~res not available
Belgique (FB)
Danaark
(KD)
Deutschland
(DM)kl las
(DR)
France
( f f )Ireland
(I.ll)
Ital i
a
<Li re>.
Luxellbourg
(FL)
Nederland
(FL)
U.
KingdOII
(ll)6asoil Chauffage
Fuel Lourd HTS
Heating
6asoil
Heavy Fuel HSC
1000 L (3)
Tonne
(3)
Taxes
Hors taxes
Prix de vente Taxes
Hors taxes.
Prix de vente
Without
Taxes
Sell ina Pric•
Iii thou.t Taxes Sellina Price
2.105
12.385
14.490
-
10.659
10.659
976,72
2.443,28
.3.420
410
1.975
2.385
104,70
624
728,70
15
524
539
7.806,67
20.193,33
28.000
3.508
15.492
19.000
647,40
2.123,60
2.771
59
1.682
1.741
29,39
220,31
249,70
10,14
184,87
195,01
810
13.420
14.230
100
10.986
11.086
180
732
912
11,20
617
628,20
7,70
.
197,50
205,20
7,93
154, 14
162,07
en
Prix
l
la
poape/Puap
price
<2> Livraisons
de
?000 i 5000 L./Deliveries of
2,000
to
5,000
L.
(3)
Livraisons de 110ins 2000 tonnes par
IIOh
et de aoins de 24.000 ~onnes par an
Offtaltes of less than
2,000 tons per aonth or less than 24,000 tons per year •.
I
1 .794,3
2.225,70
4.020
275,69
278,31
554
6.520
13.980
20.500
388
791
1.179
194,40
185,50
379 .. 90
Taux de change au
15.8.1984
1S
=
58,08 FB - 10,4785
CD
2,8750 DM - 114,50
DR
-8,8250
FF -
0,9328 IRL
-1.768
Lires -
3,2360
FL
-0,7566 UKlt'.
1
ecu=
45,2784 FB - 8,16890
CD
-2,24131 DM - 89,2627
DR
-6,87985 FF - 0,727227
IRL
-1.378,31
Ll°RES -
2,52274
FL
TALSMANDENS GRUPPE - SPRECHERGRUPPE - SPOKESMAN'S GROlP- GROUPE DU PORTE-PAROLE OMA/lA EKnPOrOllOY TYllOY - GRUPPO DEL PORTAVOCE -BlffAU VAN DE WOORDVOERDER
••
..
•
.
•
.
••
.
••
.
••
.
...
•
•
••
.
•
..
•
.
••
..
•
.
.
•
·-·.
•• •
••
•
•
••
. .
.
.
.
.
. .
. . . .
.
.
. .
.
.
. . .
.
.
.
.
.
.
.
.
. . .
.
. .
.
.
.
. . .
.
.
.
.
. .
.
.
...
•
•
••
•
• •
• •
••
••
•••
•
•
•
•
•
• •• •
•
••
•
••
•••••
••••
•
•
•
••
••
•
•
•
•
• •••
•
•
•
•
PRESSE·MEDDHHSE • MITTHlUNG AN DH PRESSE • PRESS·REUASE • INfDRMATIDN A LA PRESSE
ANHOINIIH
flA
TON TYDD •
INfDRMAZIDNE ALLA STAMPA • MElfliltNSsAAN21E
lffil&nbe r, 1984.
COMMISSION OIL BULLETIN NO. 268
'-I'll
7.
YI/