© 2019, IRJET | Impact Factor value: 7.211 | ISO 9001:2008 Certified Journal
| Page 3509
Data Dimension Reduction for Clustering Semantic Documents using
SVD Fuzzy C-Mean (SVD-FCM)
Hsu-Kuang Chang
Associative Professor,
Department of Information Engineering, I-Shou University, Kaohsiung, Taiwan
---***---Abstract - The rapid growth of XML adoption has urgedfor the need of a proper representation for semi-structured documents, where the document semantic structural information has to be taken into account so as to support more precise document analysis. In order to analyze the information represented in XML documents efficiently, researches on XML document clustering are actively in progress. The key issue is how to devise the similarity measure between XML documents to be used for clustering. In this paper, we introduce data dimension reduction (DDR) based on the SVD factorization (DDR/SVD) for the documents similarity calculating and DDR SVD Fuzzy C-Mean (DDR SVD-FCM) After projecting XML documents to the lower dimensional space obtained from DDR, our proposed method fuzzy c-mean to execute the document-analysis clustering algorithms (SVD-FCM). DDR can substantially reduce the computing time and/or memory requirement of a given document-analysis clustering algorithm, especially when we need to run the document-analysis algorithm many times for estimating parameters or searching for a better solution.
Key Words: SVD, DDR, XML, SVD-FCM
1. INTRODUCTION
An XML document, which is semi-structured data, has a hierarchical structure. Therefore, rather than using the similarity measure of the general document clustering techniques as it is, a new similarity measure which considers the semantic and structural information of an XML document must be investigated. However, some XML clustering methods used the similarity measure which only takes the structural information of XML documents into account. Hwang proposes a clustering method which extracts a typical structure of the maximum frequency pattern n using PrefixSpan algorithm [1] on XML documents [2, 3]. However, since such a typical structure extracted from XML documents is not the only structure which represents the XML document itself, it cannot be the representative of the whole document corpus, since there is an accuracy issue of similarity. Lian summarizes XML documents into an S-graph which is a structural graph, and proposes that the calculation method of the distance between S-graphs is used for clustering [4]. However, they do not consider semantic information on XML documents since they only focus on structural information. Since dimension reduction is one of the fundamental methods of data analysis, there have been a great many studies on
effective and efficient dimension reduction algorithms. There are linear dimension reduction algorithms including principal component analysis (PCA) [5] and multidimensional scaling (MDS) [6]. There are also nonlinear dimensional reduction algorithms (NLDR) including an Isomap [7], locally linear embedding (LLE) [8], [9], Hessian LLE [10], Laplacian eigenmaps [11], local tangent space alignment (LTSA) [12] and a distance preserving dimension reduction based on a singular value decomposition (DPDR/QR) [13]. These dimensions cover a variety of areas such as biomedical image recognition, biomedical text data mining, and biological data analysis.
The rest of this paper is organized as follows. In Section 2, we introduce the prepared XML documents on a vector space model. In Section 3, we show the DDR based on the SVD decomposition and the DDR SVD-FCM. Section 4 presents the experimental results illustrating properties of the proposed DDR methods. A summary is made in Section 5.
2. Preparation of Semantic-based XML Documents
In this section, we first introduce the pre-processing steps for the incorporation of hierarchical information in encoding the XML tree’s paths. This is based on the preorder tree representation (PTR) [14] and will be introduced after a brief review of how to generate an XML tree from an XML document.
Chart-1 illustrates an example of structural summary. By applying the phase of the nested reduction on tree T1, we
derived tree T2 where there are no nested nodes. By
applying the repetition reduction on tree T2, we derived
tree T3, which is the structural summary tree without
© 2019, IRJET | Impact Factor value: 7.211 | ISO 9001:2008 Certified Journal
| Page 3510
Chart -1: nested and repeated nodes extractionNow the XML document is modeled as a XML tree T=(V,E) where V={ v1, v2, ....} as a set of vertices and
1
V
,V
2
,(
v
1,
v
2)
E
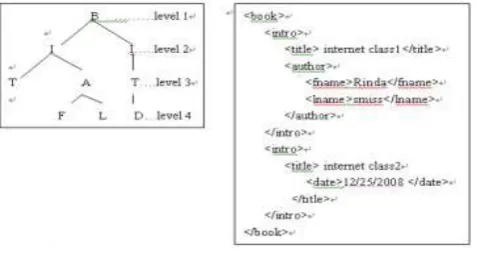
as a set of edges. As an example, Chart-2 depicts a sample XML tree containing some information about the collection of books. The book consists of intro tags, each comprising title, author and date tags. Each author contains fname and lname, each date includes year and month tags. Chart-2 left shows only the first letter of each tag for simplicity.Chart -2: Example of XML Document
The XML document has a hierarchical structure and this structure is organized with tag paths, to represent document characteristics which can predict the contents of the XML document. Strictly speaking, this shows the semantic structural characteristics of the XML document. In this paper, we propose a new method for calculating the similarity using all of the tag paths of the XML tree representing the semantic structural information of the XML document. From now on, a tag path is termed path element. Table-1 shows path elements obtained from the XML document in Chart-3. The PEL-i represents the
extracted path elements on the XML document tree from the ith tree level to the leaf node. For example, the PEL-1
means the path element from the root level (level 1) to the
leaf node, and PEL-2 means the path element from the level
2 to the leaf node respectively.
[image:2.595.38.277.425.554.2]Chart -3: XML Documents Example
Table -1: Path elements example
PEL-1 PEL-2 PEL-3 PEL-4
/B/I/T/D /I/T/D /T/D D /B/I/A/F /I/A/F /A/F F /B/I/A/L /I/A/L /A/L L /M/I/A/L /I/T /T /B/I/T/ /I/A /A /B/I/A /I
/B/I/ /B /M/I/T /M /M/I
3. Path Element of the Vector Space Model (PEVSM)
Vector model represents a document as a vector whose elements are the weights of the path elements within the document. To calculate the weight of each path element within the document, a Term Frequency and IDF (Inverse Document Frequency) method is used [15]. We define the PESSW (Path Element Structural Semantic Weight) which calculates the weight of the path element in an XML document. The PESSW is PEWF (Path Element Weighted Frequency) multiplied by the PEIDF (Path Element Inverse Document Frequency). The PESSWij of ith path element in
the jth document is shown in equation (1). In this paper,
we use the PESSW and DPESSW interchange.
ij ij
ij
PEWF
PEIDF
PESSW
(1)ij
PEWF
is shown in equation (2).n ij ij
x
freq
© 2019, IRJET | Impact Factor value: 7.211 | ISO 9001:2008 Certified Journal
| Page 3511
ij
freq
is a frequency of j-th path element in a i-thdocument and it is multiplied by level weight n
x
1
in order
to consider the semantic importance of a path element in a document. X refers to the level number of the highest tag of a tag path. The level number of the root tag is 1, and that of a tag under the root tag is 2, and so on. N is a real number larger than 1, and in this paper, 1 is chosen for the value of n. PEIDFij is shown in equation (3). PEIDFij is
shown in equation (3).
j ij
DF
N
PEIDF
log
(3)where N is the total number of documents and DFj is the
number of documents in which the jth path element
appears. The PESSW is prudently calculated to correctly reflect the structural semantic similarity. Table-2 shows the PEWF, PEIDF, and PESSW on sample trees in Chart-3.
Table-2: An example of PTWF, PTIDF and PESSW
Path
Eleme nt
PEWF PEIDF PESSW
do c1 do c2 do c3 do c1 do c2 do c3 do c1 do c2 do c3 /B/I/T
/D 1.0 0.0 0.0 1.1 0.0 0.0 1.1 0.0 0.0 /B/I/A
/F 1.0 1.0 0.0 0.41 0.41 0.0 0.41 0.41 0.0 /B/I/A
/L 1.0 1.0 0.0 0.41 0.41 0.0 0.41 0.41 0.0 /M/I/
A/L 0.0 0.0 1.0 0.0 0.0 1.1 0.0 0.0 1.1 /B/I/T
/ 2.0 1.0 0.0 0.41 0.41 0.0 0.81 0.41 0.0 /B/I/A 1.0 1.0 0.0 0.4
1 0.41 0.0 0.41 0.41 0.0 /B/I/ 2.0 1.0 0.0 0.4
1 0.41 0.0 0.81 0.41 0.0 /B 1.0 1.0 0.0 0.4
1 0.41 0.0 0.41 0.41 0.0 /M/I/
T 0.0 0.0 1.0 0.0 0.0 1.1 0.0 0.0 1.1 /M 0.0 0.0 1.0 0.0 0.0 1.1 0.0 0.0 1.1 /M/I 0.0 0.0 2.0 0.0 0.0 1.1 0.0 0.0 2.2 /I/T/D 0.5 0.0 0.0 1.1
0 0.0 0.0 0.5 0.0 0.0 /I/A/F 0.5 0.5 0.0 0.4
1 0.41 0.0 0.21 0.21 0.0 /I/A/L 0.5 0.5 0.5 0.0 0.0 0.0 0.0 0.0 0.0 /I/T 1.0 0.5 0.5 0.0 0.0 0.0 0.0 0.0 0.0 /I/A 0.5 0.5 0.5 0.0 0.0 0.0 0.0 0.0 0.0 /I 1.0 0.5 1.0 0.0 0.0 0.0 0.0 0.0 0.0 /T/D 0.3
3 0.0 0.0 1.1 0.0 0.0 0.33 0.0 0.0 /A/F 0.3
3 0.33 0.0 0.41 0.41 0.0 0.14 0.14 0.0 /A/L 0.3
3 0.33 0.33 0.0 0.0 0.0 0.0 0.0 0.0 /T 0.6
7 0.33 0.33 0.0 0.0 0.0 0.0 0.0 0.0 /A 0.3
3 0.33 0.33 0.0 0.0 0.0 0.0 0.0 0.0 D 0.2
5 0.0 0.0 1.1 0.0 0.0 0.27 0.0 0.0 F 0.2
5 0.25 0.0 0.41 0.41 0.0 0.1 0.1 0.0 L 0.2
5 0.25 0.25 0.0 0.0 0.0 0.0 0.0 0.0
Let dx and dy be two vectors which represent an XML
document docx and docy. Cosine similarity is defined as
being the angle between two vectors and is quantified by equation (4) and (5).
| | | | cos y x T y x d d d d
, that is (4)
t k ky t k kx t k ky kx y x T y x y xw
w
w
w
d
d
d
d
doc
doc
sim
1 2 1 2 1|
|
|
|
)
,
(
(5))
,...,
,
(
1x 2x txx
w
w
w
d
,d
y
(
w
1y,
w
2y,...,
w
ty)
and(
w
1x,
w
2x,...,
w
tx)
is weight of dx,(
w
1y,
w
2y,...,
w
ty)
is weight of document of dy, and t is the total number of
path elements in dx, dy respectively [16].
3.1 Singular Value Decomposition (SVD) and DDR SVD
Using SVDLSI, the original path element document
matrix
PESSW
mxnis first decomposes into three matrices:T nxn mxn mxm
mxn
U
S
V
PESSW
where U and V contain orthonormal columns and S is diagonal. By restricting the matrices U, V and S to their first k <min(m,n) columns, one obtains the matrix
T kxn kxk mxk mxn
mxn
PESSW
U
S
V
D
ˆ
(
)
ˆ
ˆ
ˆ
, where
D
ˆ
is the best square approximation of D by a matrix of rank k. To deal with novel documents not included in the path element-document matrix D, one can project the novel document vector onto the “semantic space” of dimension k and measure distance directly in the semantic space. Thus, an XML document will eventually be represented as a matrix, kxmx
d
, with each column being the projection of the element-specific feature vector on the semantic space. We call this version of PESSW as thin-SVD of the DPESSW in the subsequent sections. In thispaper, we focus on DDR based on the SVD (DDR/SVD) for the sake of simple presentation.
The thin SVD of D is
T
V
S
U
D
1 1 1 ,where mn
U
1
has only n basis vectors, n nS
1
is a diagonal matrix, and n n© 2019, IRJET | Impact Factor value: 7.211 | ISO 9001:2008 Certified Journal
| Page 3512
According to the cosine similarities are preserved in the t-dimensional space owing to
2 2 2 2 2 1 2 1 1 1
ˆ
ˆ
ˆ
ˆ
)
(
)
(
)
,
cos(
j i j T i j i j T i j T j T j T T i T j iy
y
y
y
y
y
y
y
d
U
d
U
d
U
d
U
d
d
.We refer this method to as DDR SVD is based on the SVD.
3.2 Our proposed DDR SVD-FCM Algorithm
As described in the previous section from the DDR SVD decomposition, we have the originated document vector PESSW, document vector
U
TD
(refer to economic SVD decomposition), document vectorQ
ˆ
TD
(refer to SVD decomposition of rank PESSW), and document vectorD
U
~
T (refer to efficient low rank PESSW on SVD decomposition) based on the XML documents, which is taken as the SVD-FCM input data and then goes through the clustering. d U Vctor d U Vctor d U Vector PESSW Vector input T T T e ~ ˆf
iF(I)=[f1,f2,…..,fc] , where
N j ij N j j ij iN
P
f
1 11
.This method developed by [17] and improved by [18] [19] is frequently used in pattern recognition. It is based on the minimization of the following objective function:
2 1 1 j i N i C j m ij
m
d
c
J
, 1 ≤ m ≤∞where m is any real number greater than 1, uij is the
degree of membership of di in the cluster j, di is the ith of
d-dimensional measured data, cj is the d-dimension center of
the cluster, and ||*|| is any norm expressing the dissimilarity between any measured data and the center.
The objective function shown above with the update of membership uij and the cluster centers cj by:
C k m k i j i ijc
d
c
d
1 1 21
,
N i m ij N i i m ij jd
c
1 1
This iteration will stop when
max
{
( 1)
ij(k)}
k ij
ij ,
where
is a termination criterion between 0 and 1, whereas k are the iteration steps.4. Experiment Result
In the Chart-4, we show the occupied space (k) on the variant document vectors DPESSW,
U
TD
,U
ˆ
TD
, andD
U
~
T from 400, 800, 1200, 1600, and 2000 XMLs separately. When comparing the DPESSW with theU
~
TD
on2000 XMLs, we could save a lot of space, and importantly unaffected the clustering result where we used the SVD-FCM would be unaffected. In the Chart-5, we show CPU executing time (ms) to run SVD-FCM on the variant document vectors DPESSW ,
U
TD
,U
ˆ
TD
, andU
~
TD
from400, 800, 1200, 1600, and 2000 XMLs separately. When comparing the DPESSW with the
U
~
TD
on 2000 XMLs, wecould save a great deal of time, and importantly the clustering result where we used the SVD-FCM still remains the right result.
Chart-4: Space on the variant vector from different # XMLs
Chart-5: CPU (ms) executing SVD-FCM on the variant vector
SVD-FCM
Clusterin
g
© 2019, IRJET | Impact Factor value: 7.211 | ISO 9001:2008 Certified Journal
| Page 3513
In the Table-3, we show the percentage of the space saved when comparing
U
TD
withD
U
ˆ
T ,U
TD
withD
U
~
T ,U
ˆ
TD
withU
~
TD
,on running SVD-FCM using 2000 XMLs and 1600 XMLs from 5 DTDs. We also show the percentage of the CPU executing time when comparingD
U
T withD
U
~
T ,D
U
T andD
U
ˆ
T ,U
ˆ
TD
withU
~
TD
, on running SVD-FCM using 2000 XMLs and 1600 XMLs from 5 DTDs. On comparingU
TD
withU
ˆ
TD
, we find that usingU
ˆ
TD
instead ofU
TD
on 2000 XMLs for the SVD-FCM saving 69% of space in k and 13% of CPU time in ms. In the Table-4, we show the percentage of the space saved and CPU time (ms) when comparing original document vector DPESSW withU
TD
,U
ˆ
TD
, andU
~
TD
onrunning SVD-FCM using 2000 XMLs and 1600 XMLs from 5 DTDs. When comparing DPESSW with
U
ˆ
TD
, we find thatusing
U
ˆ
TD
instead of DPESSW on 2000 XMLs for theSVD-FCM saving 94% of space in k and 36% of CPU running time in ms.
Table-3: Percentage of space and CPU saved in thin-SVD and low rank thin-SVD
Space(k)/CPU(ns)
Variant Vectors
2000 XMLs 1600 XMLs
% saved
Space CPU
% saved
Space CPU
D
U
T ~U
ˆ
TD
69% 13% 69% 14%D
U
T ~U
~
TD
84% 57 % 84% 58%D
U
ˆ
T ~U
~
TD
49% 50% 49% 51%Table-4: Percentage of space and CPU saved in DPESSW /
thin-SVD
Space(k)/CPU(ns)
Variant Vectors
2000 XMLs 1600 XMLs
% saved
Space CPU
% saved
Space CPU
DPESSW ~
U
TD
80% 26 % 80%26% DPESSW ~
U
ˆ
TD
94% 36 % 94%36%
DPESSW ~
U
~
TD
97% 68% 97% 68%
5. CONCLUSION
The original XML documents DN=[d1,d2,..,dN] are modeled
on the vector space model according to the path element of each document, that is DPESSW (PESSW), then a SVD was
conducted on the DPESSW. We derived the DPESSW =USVT,
and then took the low-rank on the T k k k
k
U
S
V
D
ˆ
upon the k low-rank from rank (DPESSW) to efficient low rank ofDPESSW. We passed the 4 resulting vectors (DPESSW,
U
TD
,D
U
ˆ
T andU
~
TD
) into the SVD-FCM clustering algorithm to attain the clustering result. In terms of the clustering results of the section experiment, we found the same clustering result as from the variant DPESSW,U
TD
,U
ˆ
TD
,and
U
~
TD
vectors. From the practical experiment results, we conclude that using the low-rank vectorU
~
TD
instead of the original document (PESSW), not only saved the space on the input vector but also took less time to cluster on the documents.REFERENCES
[1] J. Pei, J. Han, B. M. Asi, H. Pinto, “PrefixSpan : Mining
Sequential Pattern efficiently by Prefix-Projected Pattern Growth”, Int. Conf. Data Engineering(ICDE), 2001.
[2] J. H. Hwang, K. H. Ryu, XML A New XML clustering for
Structural Retrieval, International Conference on Conceptual Modeling, 2004.
[3] Jwong Hee Hwang, Keun ho Ryu, Clustering and Retrieval of XML documents by Structure, Computational Science and Its Applications-ICCSA 2005.
[4] Wang Lian, David Wai-lok, An Efficient and Scalable
Algorithm for Clustering XML Documents by Structure, IEEE Computer Society Technical Committee on Data Engineer-ing , 2004.
[5] W. F. Massay, Principal components regression in
exploratory statistical research, J. Amer Statist. Assoc., vol. 60, pp. 234-246, 1965.
[6] W. S. Torgerson, Theory & Methods of Scaling. New
York: Wiley,1958.
[7] J. B. Tenenbaum, V. de Silva, and J. C. Langford, "A
global geometric framework for nonlinear dimensionality reduction," Science, vol. 290, no. 5500, pp. 2319-2323, 2000.
[8] S. T. Roweis and L. K. Saul, Nonlinear dimensionality reduction by locally linear embedding Science, vol. 290, pp. 2323-2326, 2000.
[9] L. K. Saul and S. T. Roweis, "Think globally, fit locally:
Unsupervised learning of low dimensional manifolds," Journal of Machine Learning Research, vol. 4, pp. 119-155, 2003.
© 2019, IRJET | Impact Factor value: 7.211 | ISO 9001:2008 Certified Journal
| Page 3514
[11]M. Belkin and P. Niyogi, Laplacian eigenmaps fordimensionality reduction and data representation, Neural Computation, vol. 15, no. 6, pp. 1373-1396, 2003.
[12]Z. Zhang and H. Zha, "Principal manifolds and
nonlinear dimension reduction via tangent space alignment," SIAM Journal of Scientific Computing, vol. 26, no. 1, pp. 313-338, 2004.
[13] Hyunsoo Kim, Haesun Park, and Hongyuan Zha, Distance preserving dimension reduction using the QR factorization or the Cholesky factorization, Proceedings of the 2007 IEEE 7th International Symposium on Bioinformatics & Bioengineering (BIBE 2007), vol I, pages 263-269.
[14]Theodore Dalamagas, Tao Cheng, Klaas Jan Winkel,
Timos Sellis, A Methodology for Clustering XML Documents by Structure, Information Systems, 31(3): 187-228, 2006.
[15]Gao J. and Zhang J. (2005): Clustered SVD strategies in
latent semantic indexing.—Inf. Process. Manag., Vol.
41, No. 5, pp. 1051–1063.
[16]Berry M.W. and Shakhina A.P. (2005): Computing
sparse reduced-rank approximation to sparse matrices.
— ACM Trans. Math. Software, 2005, Vol. 31, No. 2, pp. 252–269.
[17]J. C. Dunn, Well Separated Clusters and Optimal Fuzzy Partitions, Journal Cybern., 4, 1974,. 95-104.
[18]J. C. Bezdek, Numerical Taxonomy with Fuzzy Sets, J.
Math. Biol., 1, 1974, 57-71.
[19]J. C. Bezdek, Fuzzy Mathematics in Pattern