warwick.ac.uk/lib-publications
Manuscript version: Author’s Accepted Manuscript
The version presented in WRAP is the author’s accepted manuscript and may differ from the published version or Version of Record.
Persistent WRAP URL:
http://wrap.warwick.ac.uk/96349 How to cite:
Please refer to published version for the most recent bibliographic citation information. If a published version is known of, the repository item page linked to above, will contain details on accessing it.
Copyright and reuse:
The Warwick Research Archive Portal (WRAP) makes this work by researchers of the University of Warwick available open access under the following conditions.
© 2015 Elsevier. Licensed under the Creative Commons Attribution-NonCommercial-NoDerivatives 4.0 International http://creativecommons.org/licenses/by-nc-nd/4.0/.
Publisher’s statement:
Please refer to the repository item page, publisher’s statement section, for further information.
Running Head: LANGUAGE AND SPATIAL ATTENTION
Words, objects, and locations:
Perceptual matching explains spatial interference and facilitation
Zachary Estes1, Michelle Verges2, & James S. Adelman3
In press, Journal of Memory and Language
1
Bocconi University; Milan, Italy; [email protected] 2
Blissfully unaffiliated; USA; [email protected] 3
Abstract
Many common words have spatial associations (e.g., “bird,” “jump”) that, counterintuitively, hinder identification of visual targets at their associated location. For example, “bird” hinders identification at the top of a display. This spatial interference has been attributed to
perceptual competition: “bird” shifts attention upward and evokes the perceptual
representation of a bird, which impairs identification of an unrelated target by preoccupying the visual system. We propose an alternative explanation based on perceptual matching: target objects and locations are coded independently for their congruence with the cue word, and codes that are inconsistent with one another hinder identification. Two experiments demonstrated that whereas semantically mismatching targets elicit spatial interference, semantically matching targets elicit spatial facilitation. Two further experiments
demonstrated that cue words of strong (e.g., “bird”) and weak (e.g., “arise”) visual strength and imageability elicited equivalent spatial interference. Results suggest that spatial
interference is attributable to perceptual matching rather than perceptual competition. Moreover, results supported a graded model of perceptual matching, whereby target identification times are proportional to the physical distance between the expected (i.e., associated) and observed (i.e., actual) target locations.
Introduction
Many common words have spatial associations. For instance, the words “bird” and “jump” have upward associations, whereas “snake” and “crawl” have downward associations
(Meteyard & Vigliocco, 2009; Zwaan & Yaxley, 2003). Moreover, words that have spatial associations guide visual attention toward the associated location and thus influence
perception. “Bird” and “jump” direct attention upward, whereas “snake” and “crawl” direct
attention downward (e.g., Dudschig et al., 2013; Estes, Verges, & Barsalou, 2008; Gozli, Chasteen, & Pratt, 2013; Quadflieg et al., 2011). However, the effect of such linguistic
orienting on visual perception may be counter-intuitive: Language often interferes with visual perception at an associated location. For instance, “bird” elicits slower identification of a
visual target presented at the top of a display than to that same visual target presented at the bottom of the display. We refer to this as the spatial interference effect. Although this effect has been demonstrated many times, its theoretical explanation remains relatively unexplored. The present study thus aims to test two contrasting explanations of the spatial interference effect. First we briefly review the evidence for this effect.
The Spatial Interference Effect
Language may interfere with visual perception at an implied location. In the initial demonstration of this effect, Richardson, Spivey, Barsalou, and McRae (2003) presented sentences with verbs that had either a vertical association (e.g., “The eagle flies to the river”) or a horizontal association (e.g., “The miner pushes the cart”), and then they presented a
did not report separate analyses of upward and downward stimuli. Bergen, Lindsay, Matlock, and Narayanan (2007) presented sentences with upward (e.g., “The mule climbed”) or
downward (e.g., “The chair toppled”) motion verbs, followed by a square or circle at the top or bottom of a display. Upward and downward verbs respectively elicited slower target identification at the top and bottom of the display, thereby demonstrating an interference effect that was specific to the location associated with the verb. This location-specific spatial interference was replicated in a second study using upward (e.g., “The ceiling cracked”) and downward association nouns (e.g., “The cellar flooded”). Estes et al. (2008) obtained the same effect with single word cues. They presented words denoting objects that typically occur upward (e.g., “hat”) or downward (e.g., “boot”) in the visual field, followed by a visual target (i.e., X or O) at the top or bottom of a display. Target identification was significantly slower in the denoted object’s typical location. For example, “hat” and “boot” elicited slower
responses at top and bottom locations, respectively. Verges and Duffy (2009) further replicated this spatial interference effect with both nouns and verbs. Thus, spatial
interference1 has been demonstrated many times by several research groups (see also Gozli et al., 2013).
Strikingly, the spatial interference effect occurs despite the utter irrelevance of the spatial cue for judgment of the target object. To begin with, participants could successfully complete the task of identifying the target object (e.g., ● or ■) without even reading the spatial cues. And indeed, in this paradigm, the cue word (e.g., “bird”) never matches the target object (e.g., ●) on a single trial of the experiment. So why does the cue word have any
1
effect at all on target identification? Presumably, the cue words are effective because in many circumstances such linguistic orienting facilitates perception and action (e.g., Barsalou, 2009; Hommel, 2004; Miller & Johnson-Laird, 1976): Words guide visual attention toward objects that might be the referent, thereby facilitating perception of the denoted object among an array of distracters (Altmann & Kamide, 2007; Dahan & Tanenhaus, 2005; Spivey, Tyler, Eberhard, & Tanenhaus, 2001). For instance, “snake” guides attention to curved objects (Dahan & Tanenhaus, 2005). The spatial interference effect presumably also arises from this linguistically mediated visual search. But whereas those prior studies revealed an object-based search (Altmann & Kamide, 2007; Dahan & Tanenhaus, 2005; Spivey et al., 2001), in which the cue word (e.g., “snake”) induces a search for the referent’s associated features (i.e.,
curved), the spatial interference effect instead reveals a location-based search, in which the cue induces a search in the referent’s associated location (i.e., downward). If snakes are seen
most often in the lower visual field, and if “snake” shifts one’s attention downward, then “snake” would guide one’s visual search toward the referent’s most likely location. The cue
word thus induces a search for its referent, even though the target object never matches the cue word in this paradigm, and even though the task could be completed successfully without reading the cue word. The spatial interference effect thus appears to be quite compelling. Location-Specific Perceptual Representation
Words denoting objects (e.g., “sun”) and events (e.g., “rise”) activate spatial representations that direct attention to their associated location (e.g., up). But why should they interfere with rather than facilitate perception at that associated location? Why does “sun” temporarily blind the perceptual system at the top of a display? In addition to activating
“lemon” activates the appearance, taste, smell, and feel of previously experienced lemons.
Many studies have shown that hearing a word activates the cortical networks involved in the actual perception or execution of the denoted object or action (Martin, 2007; Pulvermuller & Fadiga, 2010), and many others have demonstrated that words affect perception and action (Fischer & Zwaan, 2008; Pecher & Zwaan, 2005; Zwaan & Taylor, 2006). Such perceptual representations can be intentionally generated and consciously perceived, as with mental imagery, but perceptual representations activated during ordinary language processing appear to occur without conscious awareness (Pecher, van Dantzig, & Schifferstein, 2009).
Thus the standard explanation of the spatial interference effect is that words evoke location-specific perceptual representations, which entail both (1) attentional orienting and (2) activation of perceptual representations. To illustrate, the word “bird” evokes (1) a high spatial association that shifts attention upward, and (2) a visual representation of a bird in that location. Critically, because this visual representation of a bird is incompatible with the visual target (e.g., ■), the representation effectively masks target identification at the associated location (Estes et al., 2008; Verges & Duffy, 2009). A similar explanation supposes that the perceptual representation engages the neural systems necessary for judging the visual target, thus creating interference in the form of neural competition (Bergen et al., 2007; Richardson et al., 2003). Although they assume different levels of explanation – i.e., perceptual masking or neural competition – both of these descriptions attribute the spatial interference effect to the activation of visuospatial representations that compete with the visual target for
facilitate eye movements toward the denoted object’s typical location (Dudschig et al., 2013). For instance, “bird” and “snake” respectively facilitate upward and downward eye
movements. In fact, the distinct patterns of neural activation involved in judgments of “bird” and “snake” closely resemble actual perceptions in the upper and lower visual fields,
respectively (Quadflieg et al., 2011; see also Zhang et al., 2013). Although such attentional orienting is well documented, notice that it should facilitate perception at the implied location, not hinder it (Hommel, Pratt, Colzato, & Godijn, 2001).
The counterintuitive direction of the effect (i.e., interference) is instead thought to arise from the activation of perceptual representations, which are hypothesized to visually mask or neurally compete with the visual target. The general claim that language evokes perceptual representations is supported by an overwhelming body of evidence (for reviews see Barsalou, 2008; Fischer & Zwaan, 2008; Gallese & Lakoff, 2005; Martin, 2007; Pecher & Zwaan, 2005; Pulvermuller & Fadiga, 2010). However, the specific claim that perceptual representations cause the spatial interference effect has received little empirical investigation. Perceptual Matching
tasks where the cue’s referent is never present.2
The second critical assumption is that, in their attempt to determine whether the target is related to the cue, people judge the target’s congruence with both (1) the cued object and (2) its associated location. For instance, a “bird” cue induces one to check whether the perceptual target (1) appears at a bird-associated
location and (2) is related to the concept of a bird. Thus the target object and its location are both, independently, coded for their congruence with the cue word. Each object or location code indicates whether the visual target matches or mismatches the cue, which for simplicity we specify here with + and – respectively. For example, “bird” followed by an unrelated target (e.g., “X”) at the top of the display is coded as O- L+, because a mismatching object
(O-) appears at a matching location (L+). We further refer to two object and location codes as consistent when they both match or both mismatch the cue word (i.e., O+ L+ and O- L-) and as inconsistent when one code matches but the other code mismatches the cue (i.e., O+ L- and O- L+).
Our critical claim is that inconsistent codes predict slower target identification, because they represent a perceptual ambiguity about the target’s identity. Specifically, inconsistent object and location codes indicate conflicting evidence about whether the target object is the cue’s referent. In the spatial interference paradigm, the target object always
mismatches the cue word (O-). Consequently, when the target appears in the matching
location (O- L+), this provides ambiguous evidence of whether the cue’s referent is present or not. The participant thus seeks to disambiguate whether the target is related to the cue word, and only after the cue’s referent is determined to be absent does the participant then proceed
to identify the target object. Thus, the perceptual ambiguity introduced by inconsistent codes (O- L+) causes a brief delay before the actual target is identified. In contrast, when that same
2 Indeed, such an overgeneralization may be adaptive. Suppose someone says “snake” to you. If there is a snake
target appears in the mismatching location (O- L-), both codes indicate that the target is not the cue’s referent, and hence the participant immediately proceeds to determine what the
target object is after all.3
To illustrate, suppose the cue word “bird” precedes a square target at the top of a
display (cf. Bergen et al., 2007; Estes et al., 2008; Richardson et al., 2003; Verges & Duffy, 2009). Because the target is in the associated location, it is coded as a location match (L+). But because it is an unrelated object, it is coded as an object mismatch (O-). These
inconsistent codes (O- L+) evoke further perceptual processing to determine whether the visual target is a bird-related object, and this delays responding. Now suppose “bird”
precedes a square target at the bottom of the display. Although the object and location of the visual target both mismatch the cue word, crucially, those consistent O- and L- codes both indicate that the target is unrelated to the cue. And because no further processing is required to determine whether the target is bird-related, the task response proceeds without further delay. So counter-intuitively, given a visual target that is unrelated to the cue word (as in all prior demonstrations of the spatial interference effect), responding would be faster to targets that are not in the associated location than to targets that are in the associated location.
This matching account explains spatial interference not only from nouns such as “bird”, but also from verbs such as “jump” (Bergen et al., 2007; Richardson et al., 2003;
Verges & Duffy, 2009). Given that many events (and the verbs that denote them) have visuo-spatial representations (e.g., Meteyard & Vigliocco, 2009; for review see Hommel, 2004; Zacks et al., 2007), the matching account explains interference from verbs in the same way
3 This hypothesized coding of objects and locations as matches (+) or mismatches (-) is reminiscent of the
polarity correspondence principle, which states that stimulus and response dimensions are coded as +polarity or –polarity, and that responding is faster when those stimulus and response polarities correspond (see Proctor & Cho, 2006). For instance, positive words are +polar, and up is also +polar, so positive words elicit faster responses when presented at the top of a display (Lakens, 2012; Lynott & Coventry, 2014). Upon closer scrutiny, however, polarity correspondence cannot explain the spatial interference effect. Upward cues and top targets are both +polarity, so polarity correspondence predicts fast responding. In contrast, upward cues (+polarity) do not correspond with bottom targets (-polarity), so polarity correspondence predicts slow
that it explains interference from nouns: A square target at the top of the display does not visually represent jumping any more than it represents a bird. Thus regardless of whether the cue is “bird” or “jump”, a top visual target is an unrelated object in the associated location,
thereby evoking inconsistent codes (O- L+) that induce further processing and hence delay responding.
Both general tenets of this account – that objects and locations are coded
independently, and that inconsistent codes hinder responding – have received much empirical support in other related domains. Indeed, a wealth of evidence indicates that objects and locations are processed respectively in the ventral and dorsal pathways of the visual object recognition system in the human brain (for review see Ungerleider & Haxby, 1994), and many other studies have demonstrated that conflicting spatial codes between stimulus and response tend to hinder responding (for review see Lu & Proctor, 1995). This does not imply, of course, any support for the more specific claim that inconsistent object and location codes cause the spatial interference effect. The following experiments tested this account.
The Present Study
In sum, the competition account attributes spatial interference to visual
assumption of both accounts has not previously been tested. After obtaining evidence of both spatial interference and facilitation in Experiments 1 and 2, then Experiments 3 and 4
critically discriminated between these accounts, which make differential predictions
concerning effects of abstract cue words such as “love” and “lapse”. Simply stated, if spatial
interference were caused by visual representations (i.e., the competition account), then abstract cue words should elicit less interference than concrete cue words. In contrast, if spatial interference were due to spatial associations (i.e., the matching account), then any cue word with spatial associations could elicit strong interference. These predictions are
developed more fully after Experiments 1 and 2. Experiment 1
All prior demonstrations of the spatial interference effect used semantically unrelated visual targets such as “X” and “O” or ■ and ●. Somewhat surprisingly, the more naturalistic
case in which a cue word is followed by its denoted object has yet to be tested. Thus, in the present experiment we presented spatially associated cue words (e.g., “bird”) followed by a
visual target that was either semantically matching (i.e., an image of a bird) or semantically mismatching to the cue (e.g., an image of a wrench) and that appeared in either the associated location (i.e., top) or the opposite location (i.e., bottom). We also included some trials in which the visual target was not a real object (i.e., arbitrary shapes and lines), and participants’ task was to indicate whether the target was a real object.
This experiment provides a critical test of the competition and matching accounts, but it does not discriminate between them. As described above, both accounts explain the
interference effect with semantically mismatching targets (e.g., “bird” followed by an image of a wrench). In contrast, both accounts predict a facilitation effect with semantically
pre-activated visual target then appears in that location, perception is facilitated. By the matching account, when the object and location codes both indicate a cue-target match (O+ L+), the target is identified as the cue’s referent. But when that matching target appears in an unassociated location (O+ L-), those inconsistent codes briefly delay recognition of the cue’s referent as the target object. Thus, both accounts predict an interaction, with interference from semantically mismatching targets in the associated location but facilitation from matching targets in the associated location.
Methods Participants
Forty-one undergraduates at the University of Warwick participated for £3. Stimuli
Cues were twenty concrete nouns with spatial associations (10 upward, 10 downward) sampled from prior studies on language and spatial attention (Bergen et al., 2007; Estes et al., 2008; Richardson et al., 2003; Verges & Duffy, 2009). Upward cues were “bird”, “cloud”, “flag”, “forest”, “galaxy”, “hat”, “palace”, “plane”, “satellite”, and “star”; downward cues were “arrow”, “bottle”, “bowl”, “coin”, “fork”, “insect”, “lobster”, “shoes”, “slippers”, and “snake”. Targets were black-and-white line drawings. Twenty “semantically matching”
(Range = 2.50 to 3.14) and upward cues (Range = 4.45 to 6.64) had non-overlapping ranges of spatial associations. The semantically mismatching targets were clustered around the neutral midpoint of the scale and did not overlap with the upward and downward cues (Range = 3.18 to 4.14). An additional twenty targets consisted of novel shapes and lines that did not depict a recognizable object; these targets served as the non-objects.
Procedure
randomized individually within-participants. Participants completed twelve practice trials prior to the experimental trials.
Results
Analyses and Reporting. For each experiment reported in this paper, data were analysed via mixed effects regression modelling with participants and items as crossed random effects.4 Results are reported in terms of the unstandardized regression coefficient, B. For each experiment, all significant effects (p < .05) are described in the text, and any effect not described in the text was not significant. However, full results (including nonsignificant effects) are available online as Supplementary Materials.
Outliers. Outlying response times more than 2.5 SDs from the mean, calculated separately for each participant and each condition, were removed from analyses (2.50% of trials). Response times from trials that elicited an error were also excluded from analyses (3.68% of trials). Additionally, one outlying participant whose overall mean error rate was more than 2.5 SDs beyond the group mean was excluded from all analyses (2.44% of participants). The analyses reported below thus were calculated across 40 participants.
Error Rates. Errors were rare and random. A logistic mixed effects regression5 found no significant effects or interactions of spatial association (upward, downward), target object (semantically matching, mismatching), or target location (top, bottom), all p > .10.
4 Our strategy with respect to the random terms was to aim to use maximal structure: that is, include random
slopes with respect to subjects for within-subject manipulations and random slopes with respect to cue words for within-item manipulations (Barr, Levy, Scheepers, & Tily, 2013). All categorical variables were binary and were coded using centered variables so that the presence of interactions did not break the interpretation of main effects. We used models that did not estimate the correlations of the random effects, as these terms have negligible influence on results (Barr et al., Appendix) and hinder convergence. In several cases, particularly those involving error rates, it was not possible to use the desired structure due to failure to converge. We sought to drop random slopes to achieve convergence in those cases, and report these results; in no case was there a difference in conclusion between treating the unconverged estimates as accurate or using the model with random slopes dropped. In some more serious cases involving error rates, the only solution was to fit two models, one with subjects random and one with items random; these yielded consistent results with one another, and in any case, our conclusions are based on the patterns in RTs not those in errors. Where one of these fallback strategies was used, the relevant results are footnoted accordingly.
5 By-subject and by-items regressions had to be run separately. No random slopes could be fitted in either model
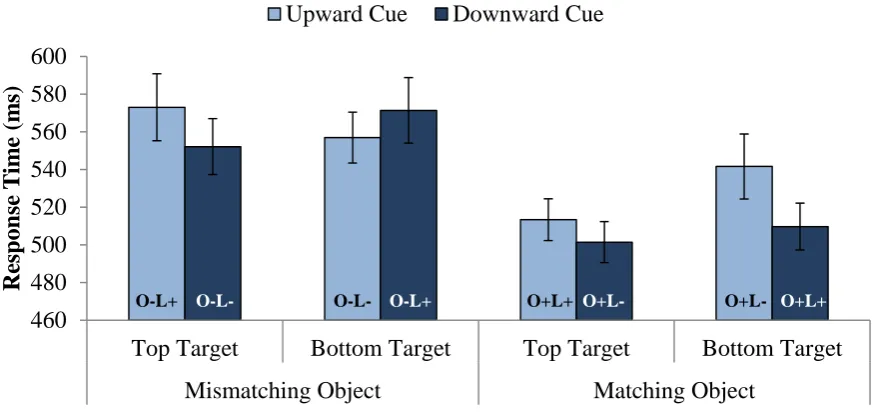
Response Times. Response times were analyzed via linear mixed effects regression with participants and items as crossed random effects, with spatial association, target object, target location, and all possible interactions as categorical predictors. The effect of target object was significant, B = -46.96, t = 3.22, p = .001, with faster responses to semantically matching targets than to mismatching targets. That is, responding was faster when the cue’s referent was present than it was absent. More importantly, the predicted 3-way interaction was also significant, B = -53.43, t = 2.56, p = .01. As illustrated in Figure 2, the semantically mismatching targets exhibited a spatial interference effect. Follow-up analyses examining only the semantically mismatching targets confirmed that this spatial interference effect was indeed significant, evident here as a spatial association × target location interaction, B = 34.52, t = 1.98, p = .05. Analyses examining only the semantically matching targets revealed only a significant effect of target location, B = -17.97, t = 2.51, p = .01, with faster responses at the top location than at the bottom. These semantically matching targets exhibited a nonsignificant trend (p = .19) toward spatial facilitation (see Figure 2). Specifically, the matching object targets following an upward cue (i.e., the two light bars at the right of Figure 2) exhibited spatial facilitation, but the downward cues elicited no effect.
Discussion. The predicted 3-way interaction was obtained, but whereas the spatial interference effect with semantically mismatching targets was significant, the spatial facilitation effect with semantically matching targets did not reach significance. As in prior studies (Bergen et al., 2007; Estes et al., 2008; Gozli et al., 2013; Verges & Duffy, 2009), cue words elicited slower responses (17 ms slower) to semantically mismatching targets
elicited faster recognition of a bird at the top of the display than at the bottom. However, the lack of a significant facilitation effect with matching targets obscured our theoretical
conclusions. Experiment 2
In attempt to clarify our theoretical conclusions, Experiment 2 provided a more powerful test of the predicted spatial facilitation effect with semantically matching targets. We increased statistical power by substantially increasing both the number of participants (from 41 in Experiment 1 to 100 in Experiment 2) and the number of items (from 20 in Experiment 1 to 60 in Experiment 2). In order to keep the experiment short enough to
maintain participants’ attention, we used only semantically matching targets in Experiment 2.
Thus the design was a 2 (spatial association: upward, downward) × 2 (target location: top, bottom) within-participants experiment, and the method was the object decision task used in Experiment 1. The competition account and the matching account both predict spatial facilitation (for explanation see Experiment 1), which would be evident here as an
interaction. The experiment was conducted online, with participants recruited from Amazon’s Mechanical Turk, and with stimuli presented and response times recorded with millisecond accuracy via JavaScript. The use of Mechanical Turk for participant recruitment in behavioral research has been extensively validated (for review see Paolacci & Chandler, 2014), as have the accuracy and reliability of response times collected online via JavaScript (Reimers & Stewart, in press).
Methods Participants
were paid $2.00 for participation. An additional 100 respondents were paid $0.50 for participating in a spatial rating pre-test.
Spatial Rating Pre-Test
From prior studies of language and spatial attention (Bergen et al., 2007; Estes et al., 2008; Richardson et al., 2003; Verges & Duffy, 2009) we selected nouns denoting common objects. We then supplemented this initial list with additional object nouns that, by our intuitions, fully spanned the range of spatial associations. The final list consisted of 180 concrete nouns, which were presented in individually randomized order to 100 participants. For each item participants indicated where on the vertical axis they would expect to see the object, on a scale from 1 (“extremely low”) to 5 (“extremely high”). However, participants could alternatively indicate that they would expect to see the object “nowhere in particular”;
this option was intended to exclude spatially indeterminate words from the experiment. Full instructions are provided in the online Supplementary Materials, and full results are reported in Appendix A.
Stimuli
Sixty cue words were selected from the Spatial Rating Pre-Test. First, any word that received 20% or more of the spatially indeterminate “nowhere” responses was excluded. We then selected the 30 words with the lowest mean ratings and the 30 words with the highest mean ratings, with the constraint that we were also able to obtain a suitable line drawing of the denoted object (to be used as visual targets). The downward (Range = 1.13 to 1.67) and upward cues (Range = 3.64 to 4.94) had non-overlapping ranges of spatial associations. Object targets were 60 black-and-white line drawings of the objects denoted by the cue words. Non-object targets were the same 20 nonsense images of pseudorandom shapes and lines used in Experiment 1.
The procedure was similar to Experiment 1, except that it was modified for web-based data collection. Instructions are provided online as Supplementary Materials. We strongly discouraged inattentive participants by clearly informing them of the demanding nature of the task. Moreover, only users with a successful task completion rate of greater than 99% and with at least 100 tasks completed were eligible to participate. Upon accepting the task in Mechanical Turk, respondents were re-directed to an external website that hosted the
experiment, which was presented as an HTML webpage with JavaScript code running locally in each participant’s browser. The procedure required use of a keyboard and a minimum
screen resolution, thereby excluding users on most mobile devices (e.g., tablets and phones). The trial procedure was identical to Experiment 1, except that the ITI was reduced to 500 ms in order to reduce the duration of the experiment. Each of the 60 cues appeared four times: object target at the top, object target at the bottom, non-object target at the top, and non-object target at the bottom. Thus there were 240 trials in total, randomized individually within-participants. At the conclusion of the experiment, participants received a password consisting of a string of digits generated randomly for each participant. They then returned to the Mechanical Turk website, where they copied this password into a textbox in order to validate their participation and receive payment. They also were asked if there was anything that they wanted to tell us about the task, and a textbox was provided for their responses.
progress across the task. Thus, for the second day of the experiment we amended the initiation of each trial so that it now indicated their progress (e.g., “Press space bar when ready (X/240)”, where X = trial number). The procedure was otherwise identical to the first
day of the experiment. Results
Outliers. Outlying response times more than 2.5 SDs from the mean, calculated separately for each participant and each condition, were removed from analyses (3.06% of trials). Response times from trials that elicited an error were also excluded from analyses (2.61% of trials). Additionally, one outlying participant whose overall mean error rate was more than 2.5 SDs beyond the group mean was excluded from all analyses (1.00% of participants). The analyses reported below thus were calculated across 99 participants.
Error Rates. Error rates were analyzed via logistic mixed effects regression with participants and items as crossed random effects, with spatial association, target location, and their interaction as categorical predictors.6 Only the effect of target location was significant, B = -.26, t = 2.09, p = .04, with more accurate responses when targets appeared at the bottom (M = 2.94%) than at the top of the display (M = 2.29%).
Response Times. Response times were analyzed via linear mixed effects regression with participants and items as crossed random effects, with spatial association, target
location, and their interaction as categorical predictors. A significant effect of target location indicated that responses were faster when targets appeared at the top (M = 612 ms) than at the bottom of the display (M = 638 ms), B = -25.96, t = 6.13, p < .001. Thus, top targets elicited faster but less accurate responses that bottom targets. This likely represents a speed-accuracy tradeoff, and indeed, target location did not reliably affect error rates or response times across experiments (see Online Supplemental Table). More importantly, the spatial association ×
6
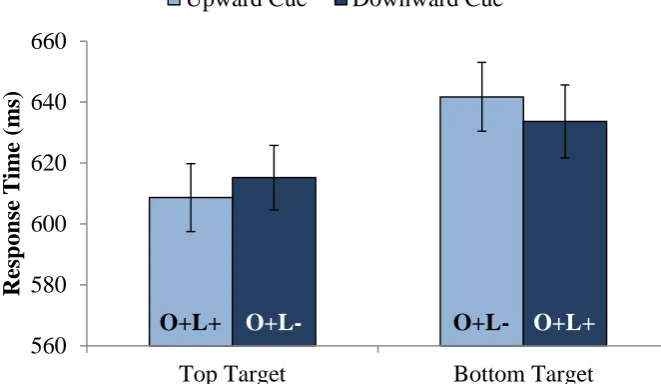
target location interaction was also significant, B = -15.26, t = 2.36, p = .02. As shown in Figure 3, top targets elicited faster responses after upward cues than downward cues, whereas bottom targets elicited faster responses after downward cues than upward cues. This spatial facilitation effect was small (7 ms) but significant.
Recall that the first half of participants received no feedback about their progress through the experiment, whereas the second half of participants were shown a progress bar indicating how many trials they had completed. Further analysis with this “half” variable
included as an additional predictor, along with all possible interactions, yielded nearly identical results: The spatial association × target location interaction remained significant, B = -15.27, t = 2.36, p = .02, whereas the half factor failed to exhibit any effects or interactions, all p > .29.
Discussion. Experiment 2 revealed significant spatial facilitation with semantically matching targets. That is, “bird” elicited faster recognition of a bird at the top of a display than at the bottom. This experiment not only demonstrates spatial facilitation in a visual discrimination task, it also provides one of the first demonstrations of the reliability of web-based response time measurements in an attentional task of this sort (see also Crump, McDonnell, & Gureckis, 2013). This spatial facilitation of semantically matching targets supports a critical assumption of both the competition and the matching accounts. Next we attempted to discriminate between these two accounts.
Differentiating the Accounts
The competition account and the matching account make differing predictions
Yuille, & Madigan, 1968; Reilly & Kean, 2007) and hence the two measures are often considered synonymous (Reilly & Kean, 2007; for review see Connell & Lynott, 2012; for a contrary view see Kousta, Vigliocco, Vinson, Andrews, & Del Campo, 2011).
If spatial interference is due to perceptual competition (Bergen et al., 2007; Estes et al., 2008; Richardson et al., 2003; Verges & Duffy, 2009), then highly imageable words should elicit more interference than words low in imageability, because highly imageable words by definition are more strongly perceptual than words low in imageability (Wiemer-Hastings & Xu, 2005). It must be noted, however, that this prediction may not emerge from all models of abstract concept representation. There is broad consensus that concrete, highly imageable concepts are represented primarily in terms of their sensorimotor features (e.g., Barsalou, 2008; Gallese & Lakoff, 2005; Kousta et al., 2011). Regarding the representation of abstract concepts, however, there currently is no consensus. The majority of researchers have proposed that abstract concepts are represented primarily in terms of the introspective and/or affective information acquired during prior experiences or situations of those abstract
In contrast, the matching account predicts that abstract, non-imageable cue words should elicit the same amount of interference as concrete, highly imageable words. This is because the target object and its location are both coded for their congruence with the cue word, even if that cue word’s meaning and its spatial association are purely metaphorical. For example, upon seeing a picture of a liberal or conservative politician, one’s attention
respectively shifts leftward or rightward (Mills, Smith, Hibbin, & Dodd, 2015), and past tense and future tense verbs also respectively shift attention leftward and rightward (Ouellet,
Santiago, Funez, & Lupianez, 2010). Thus, it is not necessary for the word to have a referent that actually physically occurs in the given location in order to elicit spatial effects. So long as the cue word has a spatial association, the to-be-identified visual target will be coded for its congruence with that cue. Consequently, even purely abstract words that lack a visual referent can induce spatial effects. Suppose “love”, which has an upward spatial association,
is followed by a square target at the top of the display. That visual target is unrelated to the cue word, so the codes are inconsistent (O- L+) and thus interference ensues. If that target instead appears at the bottom of the display, then the codes are consistent (O- L-) and hence responding should be faster. So unlike the competition account, the matching account predicts equivalent interference from cue words of high and low imageability.
Do Abstract Concepts Elicit Spatial Interference?
Prior evidence concerning whether imageability (or concreteness) moderates the spatial interference effect is sparse and inconclusive. In their original demonstration of the spatial interference effect, Richardson et al. (2003) included both abstract and concrete sentences as spatial cues. Surprisingly, they found significant spatial interference from abstract sentences but not from concrete sentences (see their footnote 1). As pointed out by Bergen et al. (2007), however, Richardson et al.’s abstract sentences consisted of an abstract
thus likely rendering the sentences concrete rather than abstract. Bergen et al. therefore examined spatial interference from sentences that were more clearly concrete (e.g., “The mule climbed”) or abstract (e.g., “The cost climbed”). In direct contrast to Richardson et al.,
Bergen et al. found spatial interference with concrete sentences, but no effect with abstract sentences. They concluded that abstract concepts do not evoke location-specific perceptual representations. More recently, both abstract and concrete words have been shown to elicit spatial interference at short delays between cue and target presentation, but instead elicit spatial facilitation at long delays (Goodhew, McGaw, & Kidd, 2014; Gozli et al., 2013).
However, the theoretical clarity and explanatory power of imageability and
concreteness have recently been challenged (Connell & Lynott, 2012; Kousta et al., 2011). Although imageability and concreteness ratings are supposed to take into account all five sensory modalities, it is unclear to what extent a single imageability or concreteness value reflects each of the various modalities (Connell & Lynott, 2012), and in fact neither imageability nor concreteness ratings adequately reflect the full range of people’s sensory experience of a concept (Connell & Lynott, 2012; Juhasz et al., 2011). Alternatively, several research groups have recently espoused the use of perceptual strength ratings collected separately for each modality (Amsell, Urbach, & Kutas, 2012; Lynott & Connell, 2009, 2012; van Dantzig, Cowell, Zeelenberg, & Pecher, 2011), and indeed a rapidly growing number of studies have shown that those perceptual strength ratings reliably predict a range of cognitive and linguistic behaviors such as word reading times, lexical decision times, property
word naming and lexical decision response times and error rates than do either imageability ratings or concreteness ratings, thus dramatically outperforming standard measures that were used in research for the prior 50 years.
To provide a stronger and more precise test of the competition account of spatial interference, we therefore examined the effect of visual strength (i.e., perceptual strength in the visual modality; Lynott & Connell, 2009, 2012) on target detection. The competition account concerns the visual modality in particular, so these visual strength ratings provide a more direct test of the hypothesis than any prior study. If spatial interference is due to visual competition, then words that elicit stronger visual representations (i.e., visually strong words) should elicit more spatial interference than visually weak words. Alternatively, if spatial interference were due to spatial coding (i.e., the matching account), then visually weak words should also induce spatial interference if they have strong spatial associations.
Experiments 3 and 4: Discriminating Between Accounts
We tested via the cueing paradigm whether visually strong and weak nouns
(Experiment 3) and verbs (Experiment 4) elicit spatial interference. Our sample of cue words (N = 256) was considerably larger than prior studies. Visually strong (e.g., “bird”) and visually weak (e.g., “love”) cue words appeared one at a time in the center of a display,
followed by an unrelated visual target (X or O) at the top or bottom of the display, and participants simply identified each target as X or O by keypress (as in Estes et al., 2008). For brevity, Experiments 3 and 4 are reported together as a between-participant manipulation of word class (nouns, verbs).
Undergraduates at Rutgers University-Camden participated in Experiments 3 (N = 53) and 4 (N = 40) for course credit. None participated in both experiments. An additional 52 participants from Mechanical Turk participated in a Visual Strength Pre-Test.
Stimuli
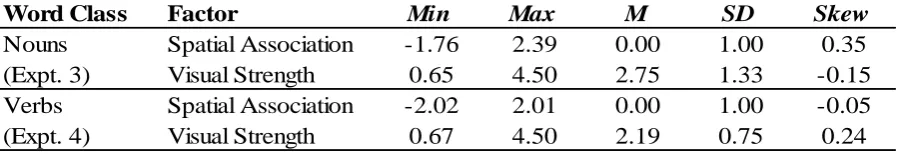
Stimuli were 256 cue words (see Appendixes B and C for a complete list of the 128 noun and verb cues, respectively). Many were sampled from prior studies on language and spatial attention (Bergen et al., 2007; Estes et al., 2008; Meteyard, Bahrami, & Vigliocco, 2007; Richardson et al., 2003; Verges & Duffy, 2009), and others were generated to vary in word class (nouns, verbs), spatial association (upward, downward), and visual strength (weak, strong). Stimulus properties are summarized in Table 1 and detailed below.
Spatial Association. Spatial association ratings of the nouns were obtained from norms by Verges and Duffy (2009), who had participants rate the extent to which each word referred to an object typically associated with upward or downward locations (cf. Spatial Rating Pre-Test of Experiment 2). Spatial association ratings of the verbs were obtained from Meteyard and Vigliocco (2009), who had participants judge whether each word matched various spatial arrangements. We calculated spatial association scores by subtracting each verb’s “down” score from its “up” score, so that higher scores indicated an upward
association. Because the ratings of the nouns and verbs were collected via different methods and with different samples, they were Z-transformed within each class (nouns, verbs) and then combined. Thus, the spatial association values reported in Table 1 and Appendixes B and C are Z-scores, with higher values indicating upward associations and lower values indicating downward associations. Nouns and verbs both exhibited a large range of spatial associations with minimal skew, thus validating this factor for use in regression analyses.
Following Lynott and Connell (2012), visual strength was measured as “the extent to which you experience [word] by seeing” on a scale from 0 (not at all) to 5 (greatly). Each participant rated all 254 words (“flower” and “tower” appeared once as a noun and once as a verb in the
experiment proper but appeared only once in the norming study) by clicking a radio button to the right of each word to indicate the selected rating. Word order was randomized within participants. The instructions emphasized that there were no right or wrong answers and encouraged participants to use the entire rating scale. To ensure that participants paid careful attention, we also included the six number words from “zero” to “five”, and we instructed
participants to select the response number indicated by the word (e.g., given “two”, respond “2”). These attention checks appeared randomly throughout the list. Thirteen participants
who failed this attention check (i.e., at least one incorrect response) were excluded from the study, leaving a valid sample of 39 participants.
As evident in Table 1, the visual strength scores exhibited good range with little skew, and so were appropriate for regression analyses. Thirty-eight of the words were also included in Lynott and Connell’s most recent set of extended norms (personal communication). Our visual strength ratings correlated significantly with their visual strength ratings, r = +.66, p < .001, thus cross-validating the present ratings. Our visual strength ratings also correlated significantly with the spatial association scores (r = -.28, p < .001), such that visually weaker (abstract) concepts tended to have upward spatial associations. However, the weakness of this correlation indicated no problem of collinearity between the two predictors (Field, 2009). This noncollinearity was further supported in the main analysis of response times reported below, tolerance = .91 and VIF = 1.10.
Procedure
bar, which evoked a blank inter-stimulus interval (250 ms), followed by a central fixation (250 ms), a central cue word (100 ms), and another blank inter-stimulus interval (50 ms). Finally, a target appeared at either the top or bottom of the display and remained onscreen until the participant identified it as X or O via key press. Targets subtended approximately 1° of visual angle and appeared approximately 8° above or below the central fixation. Each cue appeared only once, with a randomly assigned Target Location (top, bottom) and Target Letter (X, O), such that each participant received equal numbers of top and bottom targets and X and O targets in each experimental condition. Thus there were 128 trials per
participant. Trial order was randomized individually for each participant, and participants completed ten practice trials prior to the experimental trials.
Results
Outliers. Four items with mean response times more than 2.5 SDs beyond the overall mean were excluded (1.56% of items), thus leaving 252 items in total. Additionally, two outlying participants whose overall mean error rate was more than 2.5 SDs beyond the group mean were excluded from all analyses (2.15% of participants). The analyses reported below thus were calculated across 52 and 39 participants in Experiments 3 and 4 respectively. Response times from trials that elicited an error were excluded from analyses (5.62% of trials). Outlying response times more than 2.5 SDs from the mean, calculated separately for each participant and each condition, were also removed from analyses (0.79% of trials).
Error Rates. Errors were analyzed via logistic mixed effects regressions7 with participants and items as crossed random effects, with word class (nouns, verbs) and target location (top, bottom) as categorical predictors, with spatial association and visual strength as continuous predictors, and with all possible interactions included. Only the main effect of
7
spatial association was significant, B = -.11, t = 2.04, p = .04: As spatial associations increased (i.e., toward upward associations), error rates decreased.
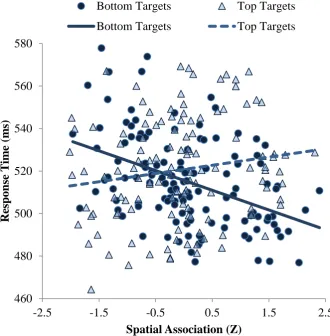
Response Times. Response times were analyzed via linear mixed effects regression with participants and items as crossed random effects, with word class (nouns, verbs) and target location (top, bottom) as categorical predictors, with spatial association and visual strength as continuous predictors, and with all possible interactions included. The main effect of spatial association was significant, B = -3.29, t = 2.08, p = .04, such that faster responses were elicited by words with an upward spatial association. More importantly, the critical interaction of spatial association and target location was significant, B = 15.20, t = 4.79, p < .001. As in prior studies (Bergen et al., 2007; Estes et al., 2008; Gozli et al., 2013; Verges & Duffy, 2009), words with upward spatial associations elicited slower responses to top targets and faster responses to bottom targets. This relationship is illustrated in Figure 4. For each unit increase in the cue word’s spatial association (i.e., 1 SD, because units are Z-scores here),
visual targets were identified 4 ms more slowly at the top and 14 ms more quickly at the bottom. In the extreme, words with spatial associations of -2 (e.g., “fall”) and +2 (e.g., “arise”) thus differed by about 50 ms in target identification at the bottom location. The
3-way spatial association × target location × visual strength interaction was not significant, p = .40, revealing no moderation of the spatial interference effect by visual strength. Indeed the identical pattern of results was also observed within both experiments separately, with a significant spatial association × target location interaction [Experiment 3:8B = 15.47, t = 3.26, p = .001; Experiment 4: B = 14.91, t = 3.65, p < .001] but no moderation by visual strength (both p > .34). Thus, spatial interference was obtained within and across the two experiments, and in neither case was it moderated by visual strength.
8 For the analysis of Experiment 3 only, to achieve convergence, several random slopes with respect to subjects
Visual Strength. Given that visual strength failed to predict target identification times, we sought to validate the visual strength ratings by testing whether they predict lexical decision times (Connell & Lynott, 2012, in press), which were retrieved from E-Lexicon (Balota et al., 2007). We conducted a stepwise regression with lexical control factors of word length (number of letters), word frequency (log transformed; Brysbaert & New, 2009), and contextual diversity (i.e., the number of contexts in which a word appears; log transformed; Adelman, Brown, & Quesada, 2006) in the first step, and then we added visual strength ratings in a second step, with lexical decision times (log transformed) as the criterion. The initial model with control factors was significant, R2 = .41, F(3, 248) = 56.45, MSE = .01, p < .001, with significant effects of length (β = .15, t = 2.82, p = .005) and contextual diversity (β = -.92, t = 3.12, p = .002) but not frequency (p = .23), as is typical of word recognition studies (e.g., Adelman et al., 2006). More importantly for our purposes, the addition of visual strength ratings in the second model explained a significant amount of unique variance beyond those control factors, ΔR2 = .01, F(1, 247) = 4.51, β = -.11, p = .04: As in prior
studies (Connell & Lynott, 2012, in press), strongly visual words elicited faster lexical decisions than weakly visual words. Thus, the failure of visual strength to predict target identification times was not attributable to an inadequacy of the visual strength ratings.
with spatial association (tolerance = .94 and VIF = 1.07), thus indicating its appropriateness for regression analysis. We therefore replicated the preceding linear mixed effects model, but with imageability replacing visual strength; the random slopes had to be excluded for both the two-way interactions involving imageability. Only the critical spatial association × target location interaction was significant, B = 13.91, t = 3.97, p < .001. No effect or interaction of imageability was significant, including the spatial association × target location × imageability interaction, p = .50. The spatial association × target location interaction indicating spatial interference was also significant within both experiments separately [Experiment 3: B = 13.78, t = 2.59, p = .01; Experiment 4:9B = 14.27, t = 3.37, p < .001], whereas the 3-way interaction indicating moderation by imageability did not approach significance within either experiment (Experiment 3: p = .77; Experiment 4: p = .31). The spatial interference effect thus was not moderated by imageability.
Testing Alternative Models of Spatial Coding
The observation of equivalently large spatial interference effects among visually strong and visually weak cue words in Experiments 3 and 4 fails to support the competition account, which has been the assumed explanation in prior studies of the spatial interference effect. Rather, the occurrence of a large spatial interference effect from visually weak cues supports instead the perceptual matching account. Below we consider two basic models of spatial coding, which we then test with the data from Experiments 3 and 4. For the remainder of this section of the paper, please keep in mind that we are referring to the interference paradigm in which the target was never related to the cue word (i.e., all targets were O-). A Categorical Model of Spatial Coding
The typical experimental design, which contrasts cue words with upward (e.g., “star”) or downward (e.g., “cellar”) spatial associations (e.g., Bergen et al., 2007; Chasteen, Burdzy,
9 For the Experiment 4 only analysis with imageability, from the random-items component, either the intercept
& Pratt, 2010; Duschig et al., 2012, 2013; Estes et al., 2008; Goodhew et al., 2014; Gozli et al., 2013; Quadflieg et al., 2011; Richardson et al., 2003; Verges & Duffy, 2009; Zhang et al., 2013), maps clearly onto the perceptual matching account described in the introduction: The visual target was described as appearing in either the “matching” location or a “mismatching” location. Thus, our theoretical conceptualization treated the congruence between the spatial association of the cue and the physical location of the target as a categorical factor. However, because our analyses of Experiments 3 and 4 used linear regression, those analyses did not provide a direct test of this categorical model of spatial coding.
If spatial coding were categorical, then we should observe the empirical hallmarks of a categorical effect: (1) within-category equivalence, and (2) between-category discontinuity. To illustrate, consider five cue words of vertically decreasing spatial associations: “star” = 6.23, “palace” = 5.05, “tree” = 4.00, “lawn” = 2.82, and “cellar” = 2.27 (where 1 = extremely
low and 7 = extremely high). If spatial coding were categorical, then extremely and moderately upward cues (e.g., “star” and “palace”) should both be coded as matching
locations for a top target (L+), and thus they should elicit approximately equivalent
interference effects for unrelated targets (O-), because both would elicit incongruent codes (O- L+). Likewise, moderately and extremely downward cues (e.g., “lawn” and “cellar”) should both be coded as mismatching locations (L-), and should thus elicit equivalently fast responding to unrelated targets (O-) due to their equivalently congruent codes (O- L-). This is within-category equivalence. Moreover, at some point along the spatial association scale, the spatial coding must switch from matching to mismatching. This transitional range, which presumably includes spatially neutral cues like “tree”, produces a between-category
A Graded Model of Spatial Coding
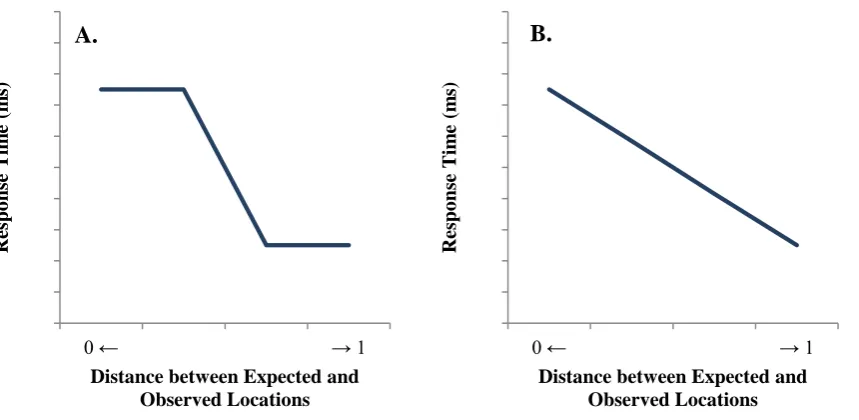
The cue-target spatial relationship can be conceptualized alternatively as a continuum that ranges from complete congruence to complete incongruence. In fact, if spatial coding is graded in this way, then we may observe differing degrees of interference across the range of cue-target spatial congruence, in an approximately linear fashion. This prediction of graded interference can be understood in terms of the physical distance between the expected
location (i.e., based on the cue’s spatial association) and the observed location (i.e., the actual
target location), with the magnitude of spatial interference being negatively proportional to the distance between expected and observed locations. Consider the example of “star”, which has an extreme upward association. When an unrelated object appears at the top of the
display, the object code is fully mismatching but the location code is fully matching, thereby producing fully inconsistent codes and hence a full interference effect. But now consider “tree”, which has a neutral spatial association. When an unrelated object appears at the top of
the display, the object code remains fully mismatching but now the location code is only semi-matching, so the object and location codes are only semi-consistent and hence the interference effect is attenuated. So as the distance between the actual location (e.g., at the top of the display) and the expected location gradually increases across intermediate spatial cues like “palace”, “tree”, and “lawn”, spatial interference should gradually diminish. And finally, with an extremely downward association (e.g., “cellar”), the distance between
Methods
Using the data from Experiments 3 and 4, we tested whether the spatial interference effect is categorical or graded. Our predictor variable was the distance between the expected and observed locations of the target object, and the criterion variable was response time. Distance scores were computed via the following procedures. First we re-scaled the spatial association ratings for the cue words, setting the lowest rating as 0 and the highest rating as 1. This value represents the expected location. Then we simply coded the target locations as 0 for bottom targets and 1 for top targets. This value represents the observed location. Finally we calculated the absolute value of the difference between those expected and observed locations, so that low values indicate that the target appeared at or near its expected location, and high values indicate that the target appeared far from its expected location. Taking the absolute value allowed us to collapse across top and bottom targets. For instance, “sky” elicited one of the highest spatial association ratings, so its expected location was near 1, at .95. When the target appeared at the top location (i.e., observed location = 1), the distance between expected and observed locations was minimal (i.e., │.95 - 1│ = .05). And conversely, “fail” elicited one of the lowest spatial association ratings (i.e., expected location = .01), so
when the target appeared at the top location (i.e., observed location = 1), the distance between expected and observed locations was large (i.e., │1 - .01│ = .99).
To test whether the spatial interference effect was categorical or graded, we compared linear and nonlinear models using restricted cubic splines. Restricted cubic splines are an alternative to the better-known polynomial regression. Both methods flexibly produce nonlinear functions of the predictor by introducing several transformations of that predictor into the linear regression (in the polynomial case, these are the original predictor, the square of the predictor, the cube of the predictor and so on), each with its own regression coefficient. Restricted cubic splines are often preferred to polynomial regression because their fits are considered more flexible and more plausible. With restricted cubic splines, the fitted function in one part of the predictor range is not strongly influenced by the fitted function in another part of the predictor range, as the function can be considered as a series of segments that are joined (smoothly) at pre-defined values (known as knots) of the predictor. The two end segments are linear, and all interior segments are cubic (hence the name). In contrast, with polynomial regression, a small change in the middle of the range can massively change the function at the end of the range (and the extrapolation beyond the range), producing visually bizarre fits. That is, unlike polynomial regression, restricted cubic splines can produce sigmoid functions that flatten at the ends of the range.
Restricted cubic splines with 5 knots in distance were fitted (at default locations: 5%, 27.5%, 50%, 72.5%, 95% quantiles10), with random slopes for the linear effect only,11
because (a) the model would not converge with random slopes for each component of the spline, and (b) this maintained consistency with the linear model, which was fitted with these random slopes. Unlike with polynomial regression, the nonlinear components of restricted cubic splines are not orthogonal to the linear component nor each other. We thus used model comparison to determine whether the nonlinear model fits better than the linear model, to test
10 With modified knot placement to permit steeper sigmoid functions (0.05, 0.45, 0.5, 0.55, 0.95 values of the
distance parameter), the qualitative conclusion did not change.
whether the nonlinear block is significant, rather than examining the regression coefficients (whose collinearity removes all power).
Results
When fitted alone, the linear effect of distance between expected and observed locations was significant, B = -25.87, t = -4.11, p < .001. Adding the nonlinear block did not significantly improve the fit of the model, χ2(3) = 1.08, p > .7. Thus, the spatial interference effect varied approximately linearly with the distance between the expected and observed target locations. That is, the smaller the distance between expected and observed target locations, the larger the magnitude of the spatial interference effect (see Figure 5A). The linearity of this effect suggests that spatial coding is graded rather than categorical. General Discussion
2013; Richardson et al., 2003; Verges & Duffy, 2009) and extending it to visually weak words. Spatial associations predicted target identification times in an approximately linear manner (Figure 4), whereas visual strength failed to predict identification times. Below we discuss the empirical contributions of this research and its theoretical implications for the competition and matching accounts of spatial interference.
This research provides several empirical contributions. To begin with, Experiments 1 and 2 provided the first evidence that the semantic relation of the cue and target strongly moderates the spatial effect, with interference from mismatching targets but facilitation from matching targets. Experiment 1 further indicated that object matches (O+) had a far larger impact on object recognition than location matches (L+). That is, responding was faster when the cue’s referent was present than it was absent. Experiments 3 and 4 also used many more
stimuli (N = 256) than prior studies, thereby demonstrating the generality of spatial interference. Moreover, the effect occurred with both noun and verb cue words (see also Verges & Duffy, 2009), and with both abstract and concrete cue words (see also Gozli et al., 2013). This latter contribution is theoretically informative (as described below), and contrasts with prior results of Bergen and colleagues (2007), who found spatial interference with concrete sentences (e.g., “The mule climbed”) but not with abstract sentences (e.g., “The cost climbed”). We cannot say with any certainty why our results differ from those of Bergen et
al., but it may be due to the fact that their stimuli were varied on concreteness, whereas ours were varied on visual strength (in addition to imageability). This difference in fact highlights another empirical contribution of this research: Our use of visual strength ratings is
associations, our results revealed that the spatial interference effect decreases gradually as the physical distance between the expected and observed target locations increases.
Perceptual Competition. Many researchers have attributed the spatial interference effect to location-specific perceptual representations: The word “bird” shifts attention upward and evokes the perceptual representation of a bird, which impairs identification of the visual target (e.g., “O”) either by visually masking the target or by preoccupying the neural systems
necessary for visual perception (Bergen et al., 2007; Estes et al., 2008; Richardson et al., 2003; Verges & Duffy, 2009). However, the present results failed to support this explanation. If spatial interference were due to visual competition, then words with strongly visual
representations (e.g., “bird”) should elicit greater interference than words with weak or nonvisual representations (e.g., “freedom”). But instead, words of strong and weak visual
strength and high and low imageability elicited equivalent interference. This
counter-evidence was observed in two experiments with a large number of noun and verb cue words, as well as across both experiments combined.
Yet another defence is that our prediction for the competition account is infelicitous. That is, one could argue that the competition account actually predicts equivalent interference from strongly visual and nonvisual words. For instance, the conceptual metaphor theory claims that abstract concepts are represented in terms of an analogous sensorimotor concept (e.g., “love is a journey”; Gallese & Lakoff, 2005; Lakoff & Johnson, 1980). So to the extent
that the source concept (e.g,. journey) is visual, the abstract concept (i.e., love) should elicit the same amount of spatial interference. More common, however, is the claim that abstract concepts are represented primarily in terms of introspection (Barsalou & Wiemer-Hastings, 2005; Pecher et al., 2011) or emotion (Kousta et al., 2011). Assuming that introspective information (e.g., recalling an experience of being in love) and affective information (e.g., the state of arousal evoked by being in love) are less visual than concrete objects such as birds and grass, these models predict that abstract concepts should elicit less spatial interference than concrete concepts. Notably, our cue words ranged from 0.65 to 4.50 on the 0-to-5 visual strength scale, so it is not the case that our stimulus set lacked cue words with sufficiently weak visual representations. If spatial interference were due to visual competition, then surely strong visual words like “sky” and “jump” should elicit more interference than nonvisual words like “heaven” and “flourish”, but they did not.
Thus, we found no evidence that perceptual competition explains the spatial
Perceptual Matching. The spatial interference effect is explicable instead by an account based on the perceptual match between the cue word and the visual target. This account assumes that linguistic cues elicit a visual search for the cue’s referent, even though the cue’s referent is often absent (Dahan & Tanenhaus, 2005; Richardson & Spivey, 2000;
Spivey & Geng, 2001). This account further assumes that target objects and locations are both coded for their match with the cue word in order to establish whether the target is related to the cue. Critically, consistent object and location codes unambiguously indicate whether the target is related to the cue, and therefore they elicit relatively fast responding. In contrast, inconsistent codes provide conflicting evidence about the target’s relation to the cue, and hence they elicit further processing and slower responding. To illustrate, after hearing or reading “bird”, an unrelated visual target (e.g., “O”) elicits inconsistent codes at a top
location (O- L+) but consistent codes at a bottom location (O- L-). So paradoxically, even though the bottom target is both an unrelated object and an unassociated location, the
consistency of those negative codes is unambiguous and thus allows the observer to proceed with the task of identifying what the target actually is. And despite the top target appearing in the associated location, this hinders responding because the object and location codes are inconsistent, thereby requiring additional processing to disambiguate the target’s relation to the cue before identifying what the target actually is. This account can explain not only the prior demonstrations of spatial interference from visually strong cue words, but also our novel demonstration of spatial interference from visually weak cue words such as “love”. Because the visual target was unrelated to “love”, it elicited inconsistent codes at its
independently in perception (Ungerleider & Haxby, 1994), and (3) the consistency between codes does indeed influence cognitive judgments (Lu & Proctor, 1995).
We also tested whether spatial coding is categorical or graded. By a categorical model, each target is coded as either spatially “matching” or “mismatching” (see Figure 5A).
The graded model instead posits that the degree of spatial interference is negatively proportional to the physical distance between the expected (i.e., associated) and observed (i.e., actual) target locations. Consequently, given a target appearing at the top location, identification times should be slowest following cues with extremely upward associations, and should decrease gradually across cues with neutral and downward spatial associations. The results supported this prediction of an approximately linear spatial interference effect. So to be clear, our descriptions of targets as being spatially “matching” or “mismatching” is a conceptual simplification of our actual results, which instead revealed that spatial congruence is a matter of degree. Our terminology of L+ and L- only represents the endpoints of this spatial congruence continuum, which also includes moderately congruent and incongruent cues as well as spatially neutral cues.
Accounting for Spatial Interference and Facilitation. The perceptual matching
account also explains spatial facilitation. When the target object semantically matches the cue word (e.g., “bird” followed by an image of a bird), its recognition is fast, as shown by the
large main effect of target object in Experiment 1. This simple observation follows naturally from the assumption that linguistic cues elicit a visual search for the cue’s referent. As soon as that object is located, target identification is complete. In contrast, if the cue’s referent is
absent, then the observer must begin the process of identifying what object the target actually is, and of course this second attempt at target identification delays responding. Moreover, when the cue’s referent is present, its location also affects its recognition time. “Bird” shifts