Accepted Manuscript
Title: Image Analysis of the Porous Yttria-Stabilized Zirconia (YSZ) Structure for a Lanthanum Ferrite-impregnated Solid Oxide Fuel Cell (SOFC) Electrode
Authors: Chengsheng Ni, Mark Cassidy, John T.S. Irvine
PII: S0955-2219(18)30522-3
DOI: https://doi.org/10.1016/j.jeurceramsoc.2018.08.026
Reference: JECS 12051
To appear in: Journal of the European Ceramic Society Received date: 4-7-2018
Revised date: 18-8-2018
Accepted date: 20-8-2018
Please cite this article as: Ni C, Cassidy M, Irvine JTS, Image Analysis of the Porous Yttria-Stabilized Zirconia (YSZ) Structure for a Lanthanum Ferrite-impregnated Solid Oxide Fuel Cell (SOFC) Electrode,Journal of the European Ceramic Society(2018), https://doi.org/10.1016/j.jeurceramsoc.2018.08.026
1
Image Analysis of the Porous Yttria-Stabilized Zirconia (YSZ)
Structure for a Lanthanum Ferrite-impregnated Solid Oxide Fuel
Cell (SOFC) Electrode
Chengsheng Ni1,2*, Mark Cassidy2, John T.S. Irvine2*
1. College of Resources and Environment, Southwest University, Beibei, Chongqing, 400716, China.
2. School of Chemistry, University of St Andrews, St Andrews, Fife KY16 9ST, UK. Corresponding author: [email protected] (CN); [email protected](JTSI)
Abstract
Image analysis and quantification were performed on porous scaffolds for building
SOFC cathodes using the two types of YSZ powders. The two powders (U1 and U2)
showed different particle size distribution and sinterability at 1300 oC. AC impedance
on symmetrical cells was used to evaluate the performance of the electrode impregnated
with 35-wt.% La0.8Sr0.2FeO3. For example, at 700 oC, the electrode from U2 powder
shows a polarization resistance (Rp) of 0.21 cm2, and series resistance (Rs) of 8.5
cm2 for an YSZ electrolyte of 2-mm thickness, lower than the electrode from U1
powder (0.25 cm2 for Rp and 10 cm2 for Rs) does. The quantitative study on image
of the sintered scaffold indicates that U2 powder is better at producing architecture of
high porosity or long triple phase boundary (TPB), which is attributed as the reason for
the higher performance of the LSF-impregnated electrode.
Keywords: SOFC; Cathode; Image analysis; Infiltration; YSZ
Introduction
For an SOFC utilizing an yttria-stabilised zirconia (YSZ) electrolyte, La-based
perovskites are widely used cathode materials, with strontium-doped LaMnO3 (LSM)
being the most common, due to its ability in the standard SOFC preparation processes
involving the sintering of mixed powders, usually with YSZ to form composite
2
electrode structures[1]. The high sintering temperatures (above 1300 oC) required of
densification of YSZ, preclude the use of many potential La-based perovskites because
of the reaction with YSZ forming insulating La2Zr2O7, or the lack of chemical/physical
stability at the process temperatures. To avoid exposure of these more reactive materials
to the high-temperature sintering process, one strategy is to apply a diffusion barrier
layer to avoid the reaction at high temperature, [2] but the impregnation of perovskites
materials into a porous well-sintered YSZ scaffold can also used to fabricate the
composite electrode at low temperatures [3, 4]. For example, strontium-doped LaFeO3
(LSF) or (La, Sr)(Co,Fe)O3 (LSCF) can be used to make a high-performance cathode
at intermediate temperatures between 600 oC to 800 oC with the mixed ionic and
electronic conductivity (MIEC) in this material leading to high electrochemical
performance [5-11]. Compared with the conventional mixed-powder method, the
structure of a separately formed YSZ scaffold can be engineered into specific
microstructures that will allow the percolation of subsequently infiltrated perovskite
materials at very low content, much lower than that of ~ 30 vol.% in mixed powders
[12]. Moreover, the low forming and sintering temperature of the perovskite materials
can produce nano-particles, increasing the length of triple phase boundary (TPB) of
electrolyte, electrocatalyst and gas phase, where charge-transfer reactions take place
[13]. LSF fired at 850 oC will form particles smaller than 100 nm on the surface of YSZ,
producing longer TPB sites for the adsorption and reduction of oxygen than the one
forming a dense film on the surface of YSZ at a sintering temperature of 1100 oC [7,
14].
The YSZ scaffold dictates the distribution of the solution and the resulting
perovskite particles. Previous work shows a porous YSZ scaffold formed using finer
pore former has small pores, larger surface area and thus lower polarization impedance
when strontium-doped LaFeO3 or LaCoO3 was impregnated into it as cathode materials
[15, 16]. In addition, the network of YSZ also controls the transport of oxygen ion from
the electrolyte and oxygen molecules in the porous electrode. When a nano-fiber YSZ
powder was used to prepare the scaffold for an LSM-impregnated cathode, the fast ionic
transport in the fiber was thought to be the reason for a high performance exhibited at
intermediate temperatures [17]. Further materials in addition to the perovskites phase
can also be added into the overall structure during the impregnation and can alter the
morphology of the perovskites by altering the location where they sit on the skeletal
3
support.[18] Various materials were added into the LSF-impregnated YSZ electrodes
to enhance the electrochemical performance of the electrode, and it was found that the
microstructural change of the electrode seems to be overruling the catalytic / ionic
conducting effect of the additions [19, 20]. The dual impregnation of SDC particles and
LSM into YSZ scaffold decreased the Rp resistance of the electrode, and the change of
microstructure was thought to be one of the factors inducing the enhancement of
electrode performance [21].
As can be seen, optimization of the microstructure of the YSZ scaffold will
enhance the performance of the infiltrated electrode, and the optimization of
microstructure, across length scales, is particularly useful in promoting and
understanding the performance of electrodes [22-27]. Through the quantification of
images of composite electrodes it is also possible to determine their properties in terms
of particle/pore size distribution, grain size, constituent shape factors, TPB, and
descriptive functions [28-32]. Recently, Barnett et al.[33] performed the image analysis
on the LSGM functional layer to analyze the effect of porosity and Ni loading for an Ni
impregnated LSGM anode. After quantifying a scanning electron microscopy (SEM)
image of a Ni-YSZ electrode, Lee[31] determined the anisotropic packing and
connectivity of conducting and pore phases, and found that anisotropy of the YSZ net
work lowered the conductivity of the electrode. Duong[32] studied the correlation
between the microstructure of LSM-YSZ composite cathode and performance by a 3D
modeling, and concluded that lower TPB and surface area due to the use of coarser
powders of LSM/YSZ caused a lower performance of the electrode. However, the
sintering of the YSZ network in the porous structure for impregnation differs from that
in composite electrode because of the addition of a fugitive pore former, such as
graphite or glassy carbon, without any persistent material, such as LSM or NiO as in
the conventional mixed-powder processing. Image analysis is also used in
characterizing highly porous scaffold materials [34, 35] and thus can easily be used in
quantifying the scaffold optimization since only one phase is involved and the
nano-particles are thought to be sitting on the surface of the scaffold.
In this study, high-resolution SEM images are analyzed and quantified to
understand the effect of particle size of YSZ on the microstructure of the porous
scaffold, and, in the end, the electrochemical performance of the impregnated LSF-YSZ
4
composite electrode was evaluated by ac impedance. The SEM image quantification is
found to be consistent with the sintering behavior of the YSZ powder as was the
performance of the impregnated electrode.
Experimental
Materials and ink making
Two types of 8 mol.% Y2O3-stabilised ZrO2 (8-YSZ) were used in the ink making
process, Unitec 13 wt.%- (8 mol.% ) YSZ 1-m and 2-m powder (denoted as U1 and
U2 powder) both from UCM Advanced Ceramics GmbH, Laufenburg, Germany.
Images of the as-received powders are shown in Figure 1. The particle size analysis
(PSA) of the two 8-YSZ powders was performed on a Mastersizer 2000 particle size
analyser (Malvern Instruments LTD) after ball milling to simulate the ink-making
deagglomeration process. Fifteen gram of 8-YSZ powders was put into a plastic bottle
containing 36 1-cm diameter zirconia balls, and then isopropanol with 0.5 wt.% triton
as dispersant was added to cover the surface of zirconia balls and powders. The bottle
was sealed and put on a roller at 160 rpm for 24 h. The size distributions are consistent
with the SEM images, showing that the U1 powder contains finer particles. The PSA
data of U2 powder is unimodal with only one peak at ~1 m, while those bimodal U1
powder exhibit two peaks at 0.1 m and 0.8 m.[36] A pellet 13 mm in diameter and 1
mm in thickness was obtained by pressing the powder under a uniaxial pressure of 149
MP and then its sinterability was measured via a dilatometer (Netzsch, DIL 402C) with
a heating rate of 3 oC/min up to 1350 oC. Results (Figure 1c) show that the U1 powder
started to sinter at 1000 oC and the other would not sinter until the temperature reaches
1100 oC. The shrinkage of the pellets from U1 powder is twice that from U2 powder
after dwelling for 3 h.
In the ink-making process, Hypermer KD-1 (Croda Inc. UK) was used as
dispersant, and terpineol containing 5 wt. % PVB (butvar) as a vehicle. The pore
formers is graphite (325 mesh, Alfa Aesar) or glassy carbon (Alfa Aesar). The graphite
is composed of aggregated plates with varied dimensions while the glassy-carbon
particles are 10-20 m spheres. A mixed powder containing 10.0 g YSZ, 2.4 g graphite,
0.6 g glassy carbon and 0.26 g KD-1 was put into a plastic bottle containing 36 1-cm
diameter zirconia balls, and then acetone was added to cover the surface of zirconia
5
balls and powders. The bottle was sealed and put on a roller at 160 rpm for 24 h. When
the milling time was complete, the contents, except zirconia balls, were transferred to a
beaker, into which contained 7.8 ml vehicle. The acetone was allowed to evaporate
while stirring on a magnetic plate, resulting in a well-dispersed viscous ink.
Screen printing and sintering
3.7 g 8-YSZ (HSY-8, DKKK, Japan) powder was uniaxially pressed at a static
pressure and sintered at 1500 oC for 10 h to result in a dense pellet of 2-mm thickness
and 2 cm in diameter. Four screen printed layers were used to build up a 30-40 m thick
sintered film and they were dried in an oven at 120 oC after each screen printing cycle.
The screen-printed pellets were then sintered at 1300 oC for three hours using a heating
ramp of 1 oC/min before 1000 oC and 3 oC/min afterwards with a cooling ramp of 3
oC/min. The porosity of the samples was measured by measuring the weight change of
the scaffold before and after the infiltration with water. Samples were also vacuum
mounted in an epoxy, cut with a diamond saw and polished to 1-m using diamond
polishing paste. The backscattered electron images were taken on a Joel 6700F to give
a highly contrasting image showing the location of YSZ particles. The
high-magnification images of the focused-ion-beam (FIB) etched sample and fractured
sample are used to observe the impregnated LSF on the scaffold.
Image Processing and analysis
The software ImageJ (National Institute of Health, Bethesda, MD) was used to
process and analyse the images. The porous layer was cropped from the whole image
and the SEM image was converted into a binary image by adjusting the threshold
intensity. Because a large quantity of YSZ grains is in contact owing to the sintering
process, watershed segmentation is used to separate them [37]. The size distribution of
grain size is measured using the watershed segmentation image.
Impregnation and electrochemical tests
Circular symmetrical cells with a round area of 1.13 cm2 on each side of the dense
YSZ pellet were fabricated by impregnating the porous structure with the aqueous
solution using La(NO3)3•6H2O (Aldrich Chemistry, 99.99% ), Sr(NO3)2 (Aldrich, 99 +
6
%), Fe(NO3)3•9H2O (Fisher Scientific, Analytical agent grade) and citric acid (Fisher
Scientific, 1:1 mole ratio to the metallic ions). The stoichiometry of the resultant LSF
is La0.8Sr0.2FeO3 after the firing at 850 oC to form the perovskite phase. The loading of
LSF was controlled at 35 wt. % on both sides. To facilitate current collection samples
were coated with gold paste plus firing at 800 oC for 1 h, impedance from symmetrical
cells were measured in static air over a temperature range of 550 oC to 700 oC using a
Solartron 1260 frequency response analyser (FRA) generating a sine wave ac signal
with a magnitude of 5 mV in the range of 10000 Hz to 0.05 Hz. Results were analysed
using Scribner Associates Zview.
Results and discussion
Image analysis can provide access to the morphological parameters of the
microstructure achieved during the sintering of ceramics and some functions in the
image software would assist the procurement of property of the ceramics after sintering
process.[38] The typical microstructures of porous scaffolds for the U1 and U2 powders
are shown in Figure 2. and Figure 3, respectively. The scaffold thickness is 27 m for
the U1 powder and 40 m for the U2 powder. In both figures, (a), (b) and (c) show the
low magnification backscattered electron image (a) of the porous skeleton from U1 or
U2powder, and the corresponding binary image without (b) and with (c) watershed
segmentation. (d) is the high-magnification image for the region 1 in (a). (e) and (f) are
the zoomed-in image of (b) and (c) in the corresponding region 1 respectively without
new processing of image (d). The porosities and the area specific perimeters of the
particles in Figure 2 (b) and Figure 3 (b) are listed in Table 1. For comparison, the
porosities of the samples were also measured via the weight gain of the porous structure
after infiltration with deionised water, as listed in table 1. The coherence between the
porosity obtained from the above methods verified that the choice of threshold in the
image is appropriate since it would affect the image analysis.[39] It is evident that the
film from U2 is more porous than the one from U1 powder; the result of image analysis
is consistent with the porosity measurement via water infiltration. The perimeters of the
particles are the boundary of YSZ scaffold and resin, indicating longer YSZ /air
boundaries in an unmounted sample.
7
After the comparison between (d) and (f) in both figures, it can be easily seen, that the
watershed segmentation created an image similar to higher magnification image and
separated the YSZ grains for quantification, compensating the drawback of the low
magnification image, whose resolution is not high enough to separate the grain
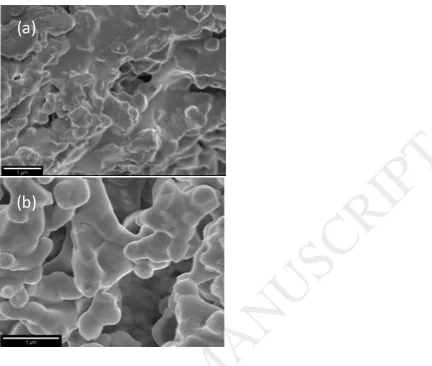
boundary. Figure 4 reveals the fracture surfaces for the porous structures from the two
inks. In Figure 4 (a), the fractured surface of film from U1 powder, small round nodules
are attached to large dense large particles and only some of them are discernible. On
the other hand, the spherical grains of U2 powder are attached to each other but they
can be easily distinguished. It is well known that YSZ particles will blunt during a high
temperature sintering process, and can also be seen from the microscopy comparison
between Figure 1 and Figure 4. The consistency between the high-magnification image
in (e) and (f) in Figure 2 or Figure 3 is due to the fact that spherical objects in contact
can be separated by the watershed segmentation very precisely[37]. The cumulative
percentage of the area of grains in Figure 5 (a) indicates that 80 % the YSZ grains from
the U2 powder are smaller than 1 m, but about only 50 % of the grains from U1 powder
are smaller than 1 m. This trend is in contrast to the PSA data (Figure 5 (b)), where
U1 powder contains finer powder below 0.3 m.[36] The particles of U2 powder
sharing an identical size maxima with U1 (Figure 5(b)) actually showed a much smaller
grain maxima than the latter (Figure 5(a)). The possible explanation to the larger grain
growth is that the wide particle size distribution of the U1 powder increases the area of
contact, leading to an enhanced particle rearrangement [40]. In addition, the fine
particles around 0.1 to 0.3 m in PSA of U1 can easily lose their shapes by joining with
other particles at 1300 oC via a coarsening mechanism. The presence of these fine
particles initiates a sintering at 1000 oC as shown in the dilatometry results. It has also
been shown that a YSZ powder with a particle size of 0.2 m will be 99.5 % dense at a
sintering temperature of 1100 oC if no pore former is added [41].
Since the quantification has been done on the scaffold, the TPB density is easy to
calculate because the nano-particles will sit on the scaffold, as shown in the FIB etched
sample (Figure 6 (a, b)). The fractured micrographs, Figure 6 (c, d), indicates that the
particle size of LSF is in the range between 30 nm and 80 nm, which is much smaller
than the grain size of the skeleton. As the oxide-ion conduction of the grain boundary
is one order of magnitude higher than the bulk, the TPB was calculated assuming that
LSF grains were perfect hemispheres and the interference of junction between the
8
grains was not considered. The TPB is calculated If the median particle size of LSF,
55 nm is used, the number of particles on area-specific boundary will be 17.5±1.5) m
-2 and, 25.5±1 m-2 and the TPB density will be 35±3 m-2 and 51±2 m-2 for the
scaffolds from the U1 and U2 powder, respectively, since each LSF particle will
produce 2 TPBs[42, 43]. These values are very similar to the reported result of Zhan
[44] for Ni-impregnated strontium- and magnesium-doped lanthanum gallate (LSGM)
scaffold at a Ni loading of 2.51 vol. %. For the conventional LSM-YSZ composite
electrode, the highest value would be 20.68 m-2, depending on the particle size of the
starting powders.[32]
Figure 7 shows the impedance data of the impregnated scaffolds at different
temperatures. The series resistance has been subtracted from each spectrum to allow for
comparison of the arcs. The impedance data for scaffolds from U1 and U2 powder are
composed of two arcs at 550 oC and 600 oC, but at 700 oC, the arc at the high-frequency
part is indistinguishable. The Rp values were obtained by subtracting the series
resistance (high-frequency intercept) from the Zr value at the low-frequency intercept.
The Rs and Rp values are plotted vs. 1000/T as shown in Figure 7 (c) and (d)
respectively. The Rs value for a 2-mm YSZ pellet is different if different YSZ powder
were used to fabricate the scaffold. At 700 oC the Rs values for U2 and U1 powder are
8.5 cm2 and 10.0 cm2 respectively. The R
s is in a reasonable range for pressed
pellet sintered at 1500 oC having an ionic conductivity of ~0.0205 S cm-1 at 700 oC [45].
The activation energy, Ea, of the Rs values are very close to each other and slightly
lower than that of pure 8YSZ, 1.0 eV, implying the existence of the lateral resistance
from the electrode. The resistance measurement of electrolyte resistance associated
with cathode can be attributed to the resistance on the interface of cathode/electrolyte
resistance and electrolyte materials because the resistance of cathode materials is
negligible [46]. The coarse grain size of the scaffold from U1 powder maybe diminishes
the contact area between LSF and YSZ, causing ineffective current collection area and
poor connectivity on the interface between the LSF/YSZ cathode and the dense YSZ
electrolyte.
At 700 oC, the respective Rp value of U1 and U2 based scaffold is 0.25 and 0.21
cm2, higher than the reported value of LSF-impregnated YSZ, 0.13 cm2,[7] but this
difference can be explained by the ionic conductivity of scaffold materials because of
9
the difference in sintering temperature of the scaffold, thermal history of the sample or
the difference in current collection paste. Nonetheless, this value is lower than the
reported Rp for LSM-impregnated cathode at 700 oC, above 0.25 cm2 [17, 47]. In a
modeling study on the length of TPB produced by impregnation[48], the smaller
particle size of the scaffold and/or impregnated materials promotes longer TPB, so it is
reasonable to conclude that the smaller grain size can increase the sites for reaction with
O2. Although the difference in interfacial connectivity caused by the microstructure of
the scaffold would affect the Rs and Rp simultaneously, the electrode using U2 powder
shows lower Rp and slightly higher Ea than the one using U1 powder, indicating that the
reaction sites on the YSZ/LSF could also play an important role. Actually, the long
area-specific boundary of the YSZ phase of the scaffold from U2 powder also
corroborates the assumption of longer TPB by providing a large area for LSF particles
to sit on, since the impregnation is the same.
Conclusion
In this work, two types of powders showing different sintering behaviors are
utilized to prepare porous YSZ scaffolds for impregnation. The powder with 9 vol. %
particles smaller than 0.3 m and bimodal distribution in the powder (U1 powder)
induces the faster YSZ grain growth and decrease in surface area when compared to
powders (U2 powder) with unimodal size distribution peaked at 1.0 m in between
0.2-2.9 m. These results were confirmed using image analysis, and the TPB length was
further quantified further to be 50 m-2, which is more than twice for the electrodes
from conventional mixed powder processing owing to the nano-scale particles of the
impregnated materials. The electrode using scaffolds made from U2 powder with
narrow particle size distribution shows the respective polarization and series resistance
of 0.21 and 8.5 cm2, comparing to the respective values of 0.25 and 10 cm2 for the
U1 powder. This is in agreement with the prediction of the image analysis, but the effect
of sintering profile of the scaffold could be an important parameter that could be
explored for better performance.
Acknowledgements
10
This research was also supported by the National Natural Science Foundation of
China (NSFC, grant number51702264; 41371275). C.N. also would like to thank the
support from Fundamental Research Funds for the Central Universities
(XDJK2017B033) and Research Funding of Southwest University (SWU117019). We
would like to thank Engineering and Physical Sciences Research Council (EPSRC, UK,
EP/P007821/1).
References:
[1] I. EG&G Technical Services, Fuel Cell Handbook (Seventh edition) West Virgina, 2004. [2] S.-I. Lee, M. Park, J. Hong, H. Kim, J.-W. Son, J.-H. Lee, B.-K. Kim, H.-W. Lee, K.J. Yoon, Fabrication of dense and defect-free diffusion barrier layer via constrained sintering for solid oxide fuel cells, J. Eur. Ceram. Soc. 37(9) (2017) 3219-3223.
[3] T.Z. Sholklapper, C.P. Jacobson, S.J. Visco, L.C. De Jonghe, Synthesis of Dispersed and Contiguous Nanoparticles in Solid Oxide Fuel Cell Electrodes, Fuel Cells 8(5) (2008) 303-312. [4] S.P. Jiang, Nanoscale and nano-structured electrodes of solid oxide fuel cells by infiltration: Advances and challenges, Int. J. Hydrogen Energy 37(1) (2012) 449-470.
[5] F. Bidrawn, S. Lee, J.M. Vohs, R.J. Gorte, The Effect of Ca, Sr, and Ba Doping on the Ionic Conductivity and Cathode Performance of LaFeO3, J. Electrochem. Soc. 155(7) (2008)
B660-B665.
[6] M. Søgaard, P. Vang Hendriksen, M. Mogensen, Oxygen nonstoichiometry and transport properties of strontium substituted lanthanum ferrite, J. Solid State Chem. 180(4) (2007) 1489-1503.
[7] W. Wang, M.D. Gross, J.M. Vohs, R.J. Gorte, The Stability of LSF-YSZ Electrodes Prepared by Infiltration, J. Electrochem. Soc. 154(5) (2007) B439-B445.
[8] J. Chen, F. Liang, D. Yan, J. Pu, B. Chi, S.P. Jiang, L. Jian, Performance of large-scale anode-supported solid oxide fuel cells with impregnated La0.6Sr0.4Co0.2Fe0.8O3-+Y2O3 stabilized ZrO2
composite cathodes, J. Power Sources 195(16) (2010) 5201-5205.
[9] J.M. Ralph, C. Rossignol, R. Kumar, Cathode Materials for Reduced-Temperature SOFCs, J. Electrochem. Soc. 150(11) (2003) A1518-A1522.
[10] L. Adijanto, R. Küngas, F. Bidrawn, R.J. Gorte, J.M. Vohs, Stability and performance of infiltrated La0.8Sr0.2CoxFe1-xO3 electrodes with and without Sm0.2Ce0.8O1.9 interlayers, J.
Power Sources 196(14) (2011) 5797-5802.
[11] A. Chrzan, J. Karczewski, M. Gazda, D. Szymczewska, P. Jasinski, La0.6Sr0.4Co0.2Fe0.8O3-δ oxygen electrodes for solid oxide cells prepared by polymer precursor and nitrates solution infiltration into gadolinium doped ceria backbone, J. Eur. Ceram. Soc. 37(11) (2017) 3559-3564.
[12] H. He, Y. Huang, J. Regal, M. Boaro, J.M. Vohs, R.J. Gorte, Low-Temperature Fabrication of Oxide Composites for Solid-Oxide Fuel Cells, J. Am. Ceram. Soc. 87(3) (2004) 331-336. [13] S.B. Adler, Factors Governing Oxygen Reduction in Solid Oxide Fuel Cell Cathodes†, Chem. Rev. (Washington, DC, U. S.) 104(10) (2004) 4791-4844.
[14] R. Kungas, J.M. Vohs, R.J. Gorte, Effect of the Ionic Conductivity of the Electrolyte in Composite SOFC Cathodes, J. Electrochem. Soc. 158(6) (2011) B743-B748.
[15] Y.Y. Huang, K. Ahn, J.M. Vohs, R.J. Gorte, Characterization of Sr-doped LaCoO3-YSZ
composites prepared by impregnation methods, J. Electrochem. Soc. 151(10) (2004) A1592-A1597.
[16] R. Küngas, J.-S. Kim, J.M. Vohs, R.J. Gorte, Restructuring Porous YSZ by Treatment in Hydrofluoric Acid for Use in SOFC Cathodes, J. Am. Ceram. Soc. 94(7) (2011) 2220-2224.
11
[17] M.J. Zhi, N. Mariani, R. Gemmen, K. Gerdes, N.Q. Wu, Nanofiber scaffold for cathode of solid oxide fuel cell, Energy Environ. Sci. 4(2) (2011) 417-420.
[18] J.T. Irvine, D. Neagu, M.C. Verbraeken, C. Chatzichristodoulou, C. Graves, M.B. Mogensen, Evolution of the electrochemical interface in high-temperature fuel cells and electrolysers, Nature Energy 1 (2016) 15014.
[19] F. Bidrawn, G. Kim, N. Aramrueang, J.M. Vohs, R.J. Gorte, Dopants to enhance SOFC cathodes based on Sr-doped LaFeO3 and LaMnO3, J. Power Sources 195(3) (2010) 720-728.
[20] C.S. Ni, J. Vohs, R.J. Gorte, J.T.S. Irvine, Fabrication and Characterisation of a Large-Area Solid Oxide Fuel Cell Based on Dual Tape Cast YSZ Electrode Skeleton Supported YSZ Electrolyte with Vanadate and Ferrite Perovskite- Impregnated Anode and Cathode, J. Mater. Chem. A 2 (2014) 19150-19155.
[21] J. Hojberg, M. Sogaard, Impregnation of LSM Based Cathodes for Solid Oxide Fuel Cells, Electrochem. Solid-State Lett. 14(7) (2011) B77-B79.
[22] G. Corre, G. Kim, M. Cassidy, J.M. Vohs, R.J. Gorte, J.T.S. Irvine, Activation and Ripening of Impregnated Manganese Containing Perovskite SOFC Electrodes under Redox Cycling, Chem. Mater. 21(6) (2009) 1077-1084.
[23] J.C. Ruiz-Morales, D. Marrero-Lopez, M. Galvez-Sanchez, J. Canales-Vazquez, C. Savaniu, S.N. Savvin, Engineering of materials for solid oxide fuel cells and other energy and environmental applications, Energy Environ. Sci. 3(11) (2010) 1670-1681.
[24] J.C. Ruiz-Morales, J. Canales-Vazquez, J. Pena-Martinez, D. Marrero-Lopez, J.T.S. Irvine, P. Nunez, Microstructural optimisation of materials for SOFC applications using PMMA microspheres, J. Mater. Chem. 16(6) (2006) 540-542.
[25] J.R. Smith, A. Chen, D. Gostovic, D. Hickey, D. Kundinger, K.L. Duncan, R.T. DeHoff, K.S. Jones, E.D. Wachsman, Evaluation of the relationship between cathode microstructure and electrochemical behavior for SOFCs, Solid State Ionics 180(1) (2009) 90-98.
[26] A. Torabi, A.R. Hanifi, T.H. Etsell, P. Sarkar, Effects of Porous Support Microstructure on Performance of Infiltrated Electrodes in Solid Oxide Fuel Cells, J. Electrochem. Soc. 159(2) (2012) B201-B210.
[27] Y. Shi, N. Cai, C. Li, C. Bao, E. Croiset, J. Qian, Q. Hu, S. Wang, Modeling of an anode-supported Ni–YSZ|Ni–ScSZ|ScSZ|LSM–ScSZ multiple layers SOFC cell: Part I. Experiments, model development and validation, J. Power Sources 172(1) (2007) 235-245.
[28] A. Lanzini, P. Leone, P. Asinari, Microstructural characterization of solid oxide fuel cell electrodes by image analysis technique, J. Power Sources 194(1) (2009) 408-422.
[29] J.R. Wilson, W. Kobsiriphat, R. Mendoza, H.-Y. Chen, J.M. Hiller, D.J. Miller, K. Thornton, P.W. Voorhees, S.B. Adler, S.A. Barnett, Three-dimensional reconstruction of a solid-oxide fuel-cell anode, Nat. Mater. 5(7) (2006) 541-544.
[30] J.S. Cronin, J.R. Wilson, S.A. Barnett, Impact of pore microstructure evolution on polarization resistance of Ni-Yttria-stabilized zirconia fuel cell anodes, J. Power Sources 196(5) (2011) 2640-2643.
[31] J.H. Lee, J.W. Heo, D.S. Lee, J. Kim, G.H. Kim, H.W. Lee, H.S. Song, J.H. Moon, The impact of anode microstructure on the power generating characteristics of SOFC, Solid State Ionics 158(3-4) (2003) 225-232.
[32] A.T. Duong, D.R. Mumm, Microstructural Optimization by Tailoring Particle Sizes for LSM-YSZ Solid Oxide Fuel Cell Composite Cathodes, J. Electrochem. Soc. 159(1) (2012) B40-B53. [33] Z. Gao, H. Wang, E. Miller, Q. Liu, D. Senn, S. Barnett, Tape Casting of High-Performance Low-Temperature Solid Oxide Cells with Thin La0.8Sr0.2Ga0.8Mg0.2O3−δ Electrolytes and
Impregnated Nano Anodes, ACS Appl. Mater. Interfaces 9(8) (2017) 7115-7124.
[34] S. Chung, M.W. King, Design concepts and strategies for tissue engineering scaffolds, Biotechnol. Appl. Biochem. 58(6) (2011) 423-438.
12
[35] M.Y.M. Chiang, X. Wang, F.A. Landis, J. Dunkers, C.R. Snyder, Quantifying the Directional Parameter of Structural Anisotropy in Porous Media, Tissue Engineering 12(6) (2006) 1597-1606.
[36] C. Ni, J.T.S. Irvine, Image Analysis and Modeling of the Orientation of Pores in a Constrained Film on a Rigid Substrate, J. Am. Ceram. Soc. 98(8) (2015) 2403-2410.
[37] V. Baecker, Workshop: image processing and analysis with ImageJ Image Analyzer, www.mri.cnrs.fr/datas/fichiers/articles/60/183.pdf 2010, pp. 69-70.
[38] M. Coster, X. Arnould, J.L. Chermant, L. Chermant, T. Chartier, The use of image analysis for sintering investigations: The example of CeO2 doped with TiO2, J. Eur. Ceram. Soc. 25(15) (2005) 3427-3435.
[39] A.L. Horovistiz, E.N.S. Muccillo, Quantification of microstructural features in gadolinia-doped ceria containing co-additives by digital image analysis, J. Eur. Ceram. Soc. 31(8) (2011) 1431-1438.
[40] A. Wonisch, O. Guillon, T. Kraft, M. Moseler, H. Riedel, J. Rödel, Stress-induced anisotropy of sintering alumina: Discrete element modelling and experiments, Acta Mater. 55(15) (2007) 5187-5199.
[41] W.H. Rhodes, Agglomerate and Particle Size Effects on Sintering Yttria-Stabilized Zirconia, J. Am. Ceram. Soc. 64(1) (1981) 19-22.
[42] F. Bidrawn, R. Kungas, J.M. Vohs, R.J. Gorte, Modeling Impedance Response of SOFC Cathodes Prepared by Infiltration, J. Electrochem. Soc. 158(5) (2011) B514-B525.
[43] C. Nicollet, A. Flura, V. Vibhu, A. Rougier, J.M. Bassat, J.C. Grenier, La2NiO4+δ infiltrated
into gadolinium doped ceria as novel solid oxide fuel cell cathodes: Electrochemical performance and impedance modelling, J. Power Sources 294(Supplement C) (2015) 473-482. [44] Z. Zhan, D.M. Bierschenk, J.S. Cronin, S.A. Barnett, A reduced temperature solid oxide fuel cell with nanostructured anodes, Energy Environ. Sci. 4(10) (2011) 3951-3954.
[45] K. Yamahara, C.P. Jacobson, S.J. Visco, L.C. De Jonghe, Influence of powders on ionic conductivity of polycrystalline zirconias, in: S.C. Singhal, M. Dokiya (Eds.), Solid Oxide Fuel Cells Viii2003, pp. 187-195.
[46] S.P. Jiang, Resistance Measurement in Solid Oxide Fuel Cells, J. Electrochem. Soc. 148(8) (2001) A887-A897.
[47] F. Bidrawn, J.M. Vohs, R.J. Gorte, Fabrication of LSM-YSZ Composite Electrodes by Electrodeposition, J. Electrochem. Soc. 157(11) (2010) B1629-B1633.
[48] W. Zhu, D. Ding, C. Xia, Enhancement in three-phase boundary of SOFC electrodes by an ion impregnation method: A modeling comparison, Electrochemical and Solid State Letters 11(6) (2008) B83-B86.
13
Figure 1. SEM images of the as-received YSZ powders: (a) U1 powder and (b) U2
powder. (b) Dilatometry of the pellets from two powders pressed under 149 MP
(b)
(a)
0 200 400 600 800 1000 1200
0 200 400 600 800 1000 1200
1400 U1 powder
U2 powder
time / min
T
e
mp
.
/
o C
-0.25 -0.20 -0.15 -0.10 -0.05 0.00
d
L
/L
o
(c)
14
Figure 2. (a) is the backscattered image for porous film from U1 powder; (b) is the
binary image separating YSZ and resin and used to calculate the perimeter of YSZ
particles and porosity; (c) is the image using watershed segmentation to separate the
YSZ grain in order for the grain distribution. (d), (e) and (f) are the zoom-in images in
(a),(b) and (c) respectively corresponding to the region 1 indicated in the rectangle.
1
(a)
(d)
(e)
(f)
(c)
(b)
15
Figure 3. (a) is the backscattered image for porous film from U2 powder; (b) is the
binary image separating YSZ and resin and used to calculate the perimeter of YSZ
particles and porosity; (c) is the image using watershed segmentation to separate the
YSZ grain in order for the grain distribution. (d), (e) and (f) are the zoom-in images in
(a),(b) and (c) respectively corresponding to the region 1 indicated in the rectangle.
(c)
(d)
(b)
(d)
(e)
(f)
116
Figure 4. Fractured surface images of the porous structure after firing at 1300 oC for
three hours from the two types of powders: (a) U1 powder and (b) U2 powder.
Figure 5. (a) the YSZ grain distribution obtained through separating the particles by
watershed segmentation. The corresponding images are Figure 2 (c) and Figure 3(c) for
(b)
(a)
(a)
(b)
0.01 0.1 1
0 20 40 60 80 100
U1 U2
Cu
mul
ative
perce
ntag
e /
%
Particle size / m
0.01 0.1 1
0 20 40 60 80 100
U1 U2
Cu
mul
ative
perce
ntag
e /
%
Grain size / m
[image:17.595.90.523.67.433.2]17
the cross-sectional image of the film from the two powders. (b) The particle size
distribution obtained from the light-scattering particle size analyser.
Figure 6. Morphology of nano-particles of LSF on YSZ: (a) and (b) are focused ion
beam etched sample; (c, d) fractured surface indicating the particle size of LSF is about
30 nm to 80 nm. (b) is the enlargement of the rectangular in (a)
(a)
(c)
(b)
(d)
18
Figure 7. Nyquist plots of the impedance measurement on symmetrical LSF-YSZ
electrodes using scaffold from(a) U1 and (b) U2 powder, respectively. The electrolyte
resistance is subtracted to make the high frequency point of Zr at 0. Inserts are the
enlarged impedance plots at 700 oC. (c) the electrolyte resistance R
s and (d) the
polarization resistance Rp as a function of the temperature measured on symmetrical
cells with LSF-YSZ electrodes.
Table 1 Parameters of the image analysis for the porous structures from U1 and U2
powder. The numbers in the parentheses indicate the error window by analysing five
images.
(b)
(a)
5 Hz
550 o
C 600 o
C 650 o
C 700 o
C 156 Hz -Z j cm 2
0 1 2 3 4 5 6 7 8
1 cm2
Zr cm2
0.00 0.05 0.10 0.15 0.20 0.25 0.00 0.02 0.04 0.06 0.08 0.10 0.12 0.14
550 o
C 600 o
C 650 o
C 700 o
C 100 Hz
5 Hz
cm2
-Z
j
cm
2
0 2 4 6 8 10
Zr cm2
0.00 0.05 0.10 0.15 0.20 0.25 0.30 0.00 0.05 0.10 0.15
(c)
(d)
1.00 1.05 1.10 1.15 1.20 1.25 10
100
Ea = 0.85 eV
Rs / o h m cm 2
1000/T / K-1
U1 U2
Ea = 0.89 eV
1.00 1.05 1.10 1.15 1.20 1.25 0.1
1 10
Ea = 1.62 eV
Rp / o h m cm 2
1000/T / K-1 U1
U2
Ea = 1.58 eV
19
Porosity
measured
with water
infiltration
Porosity
measured
with
imageJ
Area-specific
boundary
length /m-1
Estimated
LSF
diameter
/m
TPB length
m-2
U1 54(3)% 57(2)% 0.97(0.09) 0.055 35(3)
U2 62(4)% 62(2)% 1.41(0.06) 0.055 51(2)