. . . .
. . . .
. . . .
The potential impact of climate change
on heating and cooling loads for office
buildings in the Yangtze River Delta
David H.C. Chow
*Centre for Sustainable Energy Technologies (CSET), University of Nottingham Ningbo
China, 199 Taikang East Road, Ningbo 315100, China
*Corresponding author: david.chow@nottingham. edu.cn
Abstract
Located in the ‘Hot Summer Cold Winter’ climatic zone of China, the Yangtze River Delta area is one of the most challenging regions for providing occupant comfort in buildings, and effects of climate change in the next 100 years will make further increase in energy consumption. This article uses climate change data from HadCM3 to generate test reference years (TRYs) compiled for 2020s, 2050s and 2080s under various future scenarios for the cities of Ningbo, Shanghai and Hangzhou. Simulations were then conducted to see if effects of climate change can be contained or even reversed with improvements in building standards, and it was shown that energy consumption can be significantly reduced with building improvements, even in the face of climate change.
Keywords:climate change; Yangtze River Delta; heating and cooling loads; office buildings; low carbon built environment
Received 25 November 2011; revised 29 February 2012; accepted 29 March 2012
1
INTRODUCTION
As one of the most economically advanced regions in China, the Yangtze River Delta includes cities such as Shanghai, Nanjing, Hangzhou and Ningbo. Under the Nation Plan of China, these four cities in the region were included in the 35 key cities designated as the most important for driving
eco-nomic growth and development [1]. These cities represent
,20% of the population of China, yet consume 40% of the
total energy and emit the same ratio of CO2 [1]. The main
reason for this level of energy consumption is due to the rapid expansion of urbanization, entailing high intensity of building construction activities and energy usage for heating and cooling. The Yangtze River Delta area is located in the ‘Hot Summer
Cold Winter’ zone of China [2–4] (Figure 1); therefore, in
order to maintain occupant comfort in buildings, heating is required in winter and cooling in summer. High humidity levels mean that cooling with simple natural ventilation is almost impossible; so, mechanical means are required. Effects of climate change will exacerbate the situation, with increasing cooling load in the summer, as well as more occurrences of ex-tremely cold and hot spells. The cities of Shanghai and Ningbo have also been identified in the Top 20 most vulnerable port cities in the world in the 2070s in terms of population expos-ure and economic assets [5].
Occupant comfort inside buildings is easily affected by a changing climate, and in the case of office buildings, product-ivity rates may also be affected, if the indoor environment and conditions are not in the optimum range for the occupants working inside. This article looks closely at the heating and cooling energy loads for a typical office room in the cities of Ningbo, Shanghai and Hangzhou, and how this changes in the 2020s, 2050s and 2080s (using climate change data from the
HadCM3 global climate change model [6] imposed on existing
test reference years, TRYs). The office room’s building specifi-cation, weight and orientation are also examined to explore how the modifications of these aspects can affect the perform-ance as a result of climate change in the Yangtze River Delta region, and how the effects caused by possible climate change can be minimized.
2
CLIMATE CHANGE FOR THE YANGTZE
RIVER DELTA IN THE TWENTY-FIRST
CENTURY
Constant demolition and re-construction uses energy unneces-sarily and is highly unsustainable. In order for building designers to design sustainable buildings for the Yangtze River
Delta region, and to incorporate suitable low carbon technolo-gies for such buildings, it is important that buildings that are designed now have to last well into the latter part of the century. With the climate expected to change in the next 100 years as a result of climate change, it is essential to test build-ing designs usbuild-ing simulation, with predicted weather years for future periods. This is also required for retro-fitting existing buildings, to make them perform under a changing climate.
2.1
Current climate data of the Yangtze River
Delta region
Current typical weather years for the cities of Hangzhou and Shanghai are available from three different sources: (1) Chinese
Standard Weather Data (CSWD) [7], developed by Professor
Jiang Yi and the China Meteorological Bureau. This typical year used data from the period 1971 – 2003. (2) Chinese
Typical Year Weather (CTYW) [8]. This is developed by
Professor Joe Huang of the Lawrence Berkeley National Laboratory, from an original data set created by Professor Zhang Qingyuan of the Tsukuba University in Japan, and is based on 1982 – 97 period. (3) Solar and Wind Energy Resource Assessment (SWERA). This is funded by the United Nations Environment Program and is developing high-quality information on solar and wind energy resources in 14
develop-ing countries, includdevelop-ing China [9]. These data sets contain
hourly values for weather parameters such as dry-bulb tem-perature (DBT), dew-point temtem-perature, global solar radiation and relative humidity.
The above data sets do not have typical weather years for
Ningbo; however, the Ningbo Meteorological Bureau [10]
developed a typical meteorological year for the use in building performance simulation programmes. This data set contains
hourly values for the same parameters as the data sets for Hangzhou and Shanghai, and is also included in the studies conducted in this article.
2.2
Future climate data from HadCM3
The Hadley Centre model (HadCM3) [6] is used to provide
future climate data for this study. HadCM3 is a global climate model developed at the Hadley Centre of the Met Office in the UK. It is a Coupled Atmosphere-Ocean General Circulation Model (AOGCM), in which the globe is divided into grid
boxes, each measuring 2.5083.758. The gridbox used in this
article is gridbox number 2337. It encloses the area of latitude
from 28.758N to 31.258N and longitude from 118.1258E to
121.8758E and includes the cities of Shanghai, Hangzhou and
Ningbo (Figure2).
Unlike weather data from typical weather years, HadCM3 only provide daily values for parameters such as maximum, minimum and average temperatures, humidity, wind speed and downward short-wave flux (solar radiation), based on four main future scenarios on carbon emissions, A1F, A2, B2 and
B1 [11]. The A1F scenario describes a future world of very
rapid economic growth, global population that peaks in mid-century and declines thereafter, with technologies that are still very much fossil fuel intensive; the A2 scenario describes a very heterogeneous world where slow and fragmented econom-ic growth is assumed, together with a continuation of
popula-tion growth and a continuous increase in CO2 emission into
[image:2.612.127.469.60.284.2]the twenty-first century; the B2 scenario has emphasis on local solutions to economic, social and environmental sustainability and the B1 scenario has a similar population outlook as A1F, but with a rapid change in economic structures towards a service and information economy, with reductions in material
Figure 1. Climatic zones of China and location of the Yangtze River Delta area [4].
intensity and the introduction of clean and resource-efficient technologies [12].
2.3
Comparison of various weather years
Before future climate data from HadCM3 can be used for the Yangtze River Delta region, validation was conducted against
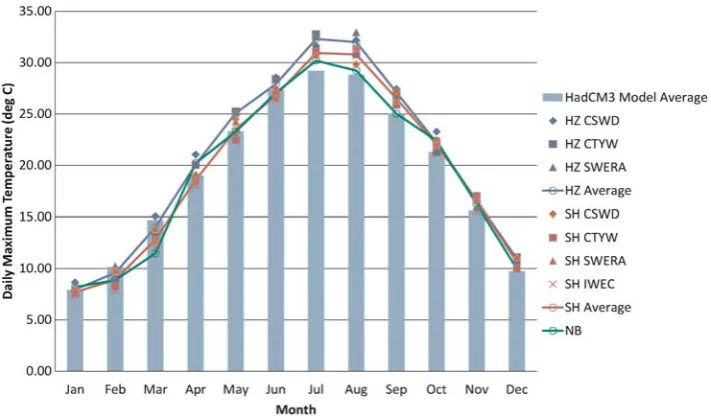
real observed data. Figures 3–5 show the monthly averaged
[image:3.612.124.486.60.342.2]values for daily maximum, daily mean and daily minimum temperatures for Hangzhou, Shanghai and Ningbo, comparing them with the values from HadCM3 for the period 1990 – 2009. Data from the individual data sets are presented, with the average values for each city shown in solid lines. For tem-perature, values from the three data sets agree well, with very little difference between them. All three data sets also agree that Hangzhou is slightly warmer than Shanghai, which in
Figure 2. Area covered by gridbox 2337 of HadCM3.
[image:3.612.128.484.384.592.2]turn is warmer than Ningbo, particularly for maximum tem-peratures during the summer period, which is generally accepted as the case in reality. Similar to other studies compar-ing HadCM3 data with real observed data, such as that for the UK [13], but to a lesser degree, there is a slight but observable cold-bias from the HadCM3 data, especially for daily minimum temperatures and for the summer months.
For solar radiation (Figure 6), the typical data sets do not
agree as well, with data from SWERA having notably high values and CTYW having notably low values. This difference is particularly striking in the summer period. HadCM3 correlates rather well with the average values for both Hangzhou and Shanghai, but there is a significant dip in July and August which does not occur in the real observed data sets. The data
from Ningbo are also significantly lower than the other two cities, and show uncharacteristic dips in May, June, August and October. This may be a result of the restricted number of years used in the selection of the TRY for Ningbo and would need to be investigated in detail in future revisions of the city’s TRY. For this study, this may produce a lower cooling demand for buildings in Ningbo for these 4 months.
2.4
Compilation of future TRYs for Ningbo,
Hangzhou and Shanghai
[image:4.612.128.486.59.266.2]Since long-running series of real observed data from weather stations in the three cities are not available for this study, an in-depth study of the characteristics of different weather
Figure 4. Comparisons of daily minimum temperatures of weather years in Hangzhou, Shanghai and Ningbo with equivalent HadCM3 data.
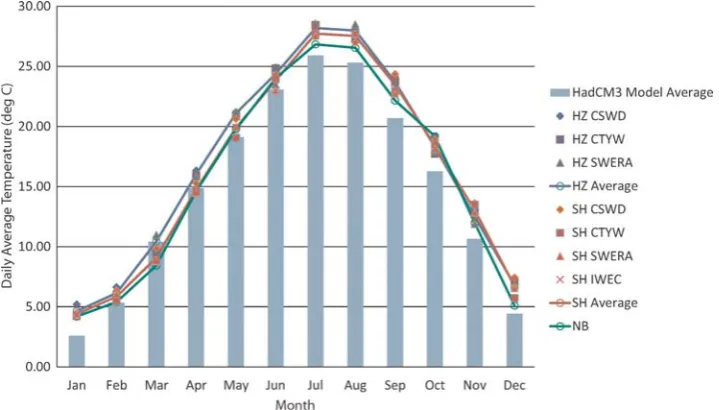
Figure 5. Comparisons of daily average temperatures of weather years in Hangzhou, Shanghai and Ningbo with equivalent HadCM3 data.
[image:4.612.127.487.307.512.2]parameters could not be conducted; thus, methods such as the
‘Q-Sin method’ [14] for downscaling daily HadCM3 model
data to hourly data are not possible; thus, the most suitable method for generating future TRYs for Ningbo, Hangzhou and
Shanghai is the ‘morphing method’ [15], which uses
differ-ences between monthly averages from ‘historical periods’ and ‘future periods’, and impose these onto existing TRYs. Since this method only impose differences from within the HadCM3 model, as long as these differences in future periods are
accepted, the cold-bias of the HadCM3 model compared with real observed data becomes less significant to the values of future TRYs. The problem of the Ningbo solar radiation values also becomes insignificant for the same reason.
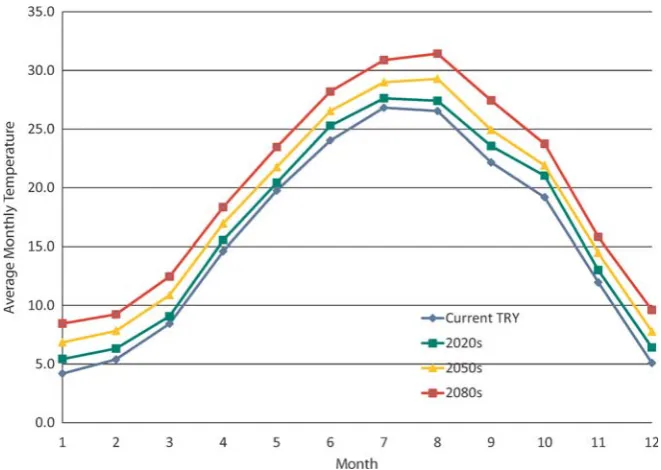
[image:5.612.125.488.62.271.2]For this study, data from HadCM3 are separated into four periods: 2000s (which includes all data from 1990 to 2009); 2020s (which includes data from 2010 to 2039); 2050s (which includes data from 2040 to 2069) and 2080s (which includes data from 2070 to 2099), and the average monthly temperatures
Figure 6. Comparisons of daily average global solar radiation of weather years in Hangzhou, Shanghai and Ningbo with equivalent HadCM3 data.
[image:5.612.140.471.316.551.2]from resulting TRYs for Ningbo, Shanghai and Hangzhou, under the A2 scenario, are shown in Figures7–9, respectively.
3
OFFICE TYPES
The construction of a building has a big impact on its interior climate, and how it responds to outside conditions. The studies conducted in this article use a ‘control’ office room, typical of office rooms constructed in the Yangtze River Delta
region. Aspects such as building specifications (U-values and
glazing type), construction ‘weights’ relating to thermal storage, orientation and air-change rates are changed to test the effects of making such alterations.
3.1
The control office room
The geometry of the office room used in the analyses in this
article is as illustrated in Figure 10, measuring 3 m high by
[image:6.612.142.469.59.281.2]4 m wide and 5 m deep. There is only one external facade with 60% glazing. Energy consumption for office rooms with more than one external facade will be higher, but these are not
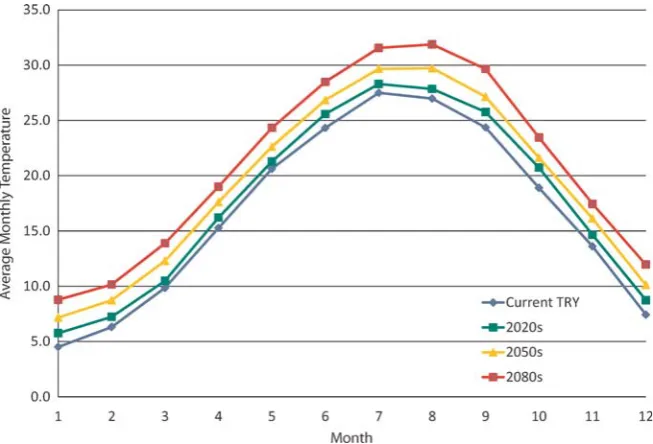
Figure 8. Monthly average temperatures of the current TRY and compiled TRYs for 2020s, 2050s and 2080s for Shanghai (A2 scenario).
Figure 9. Monthly average temperatures of the current TRY and compiled TRYs for 2020s, 2050s and 2080s for Hangzhou (A2 scenario).
[image:6.612.142.471.323.546.2]studied in this article, which aims to compare changes in building specifications and how this may help reduce energy consumption with future climate change.
3.2
Modifications for testing
The ‘control’ office room can be considered ‘light-weight’ con-struction, typical of most current construction in the Yangtze River Delta region. Windows are single-glazed (south-facing),
andU-values follow those set by the National Standard for the
region [16] for type B (,20 000 m2 of the total floor area).
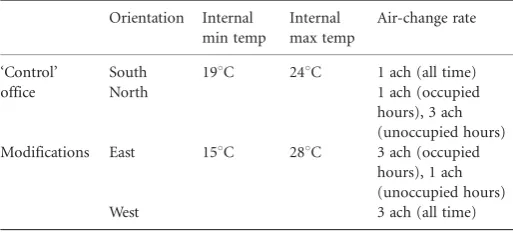
Overall, in this study, there are five main areas for testing:
† standard of building specification (including U-values and
quality of glazing) (Table1),
† ‘weight’ of construction (from ‘light weight’ to ‘heavy
weight’) (Table2),
† orientation of glazed area (from ‘South’ to ‘East’, ‘West’ and
‘North’) (Table3),
† changes in the air-change rate (from 1 to 3 ach, with
varia-tions depending on occupation hours) (Table3),
† ranges in internal temperature range (from 19 – 248C to
15 – 288C) (Table3).
Each change in the criteria was tested individually, for example, when testing the orientation of glazed area, the glazing orientation was set at ‘East’, ‘West’ and ‘North’ to compare against the ‘control’ office setting of ‘South’.
The values were chosen according to practicality and the possibility of implementation and acceptance by users of the building.
4
SECOND-ORDER MODEL FOR
SIMULATION
A second-order model developed by Chow and Levermore [17]
was used for the analyses conducted in this article. Despite the availability of many mainstream commercial building simula-tion programmes which produce reliable results, a simple, open model was used in this study, as the algorithms are more transparent, and it would be quicker and easier to run through a large number of simulations. Verifications with one of the
leading commercial software simulation packages, IES VE [18],
show comparable results with or without direct solar gains.
4.1
Second-order room model in theory
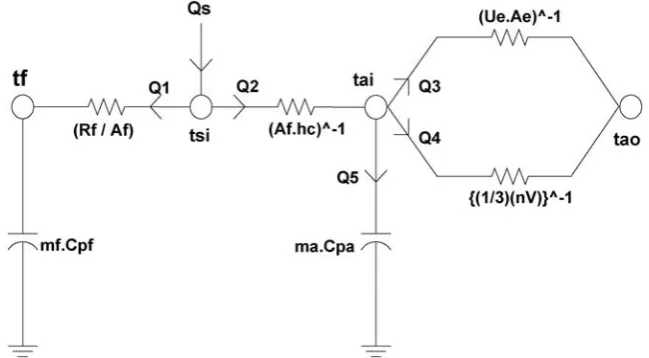
The model used is a second-order model, so-called as it assumes the building has two capacitances, one for the build-ing fabric and the other for the air inside the room. It was developed to use hourly data of the outside air temperature,
[image:7.612.52.290.60.236.2]tao, and solar irradiance (a combination of beam and diffused
Figure 10. Office room (shaded) to be simulated in the second-order model.
Table 1.Physical properties for the ‘control’ office and ‘high specification’ office in analyses.
U-values (W/m2K) Glazing used Wall Window Floor Roof Door
‘Control’ office 1.0 5.6 1.0 0.7 2.5 Single-glazing
[image:7.612.313.571.86.221.2]‘High spec’ office 0.35 2.2 0.25 0.20 2.2 Double-glazing (K-coating)
Table 2.Physical properties for the ‘control’ office and the ‘heavy-weight’ office in analyses.
Exterior wall Exterior glazing Internal walls Ceiling Floor ‘Control’ office
Width (m) 0.3 0.01 0.2 0.2 0.2
Conductivity (W/m/K) 0.19 1.05 0.47 0.2 0.2 Density (kg/m3) 470 2500 260 620 620 Cp (J/kg/K) 840 840 1260 840 840 ‘Heavy-weight’ Office
Width (m) 0.3 0.01 0.2 0.2 0.2
Conductivity (W/m/K) 0.9 1.05 0.47 1.3 1.3 Density (kg/m3) 1850 2500 260 2000 2000 Cp (J/kg/K) 840 840 1260 840 840
Table 3.Changes in orientation, internal temperature range and air-change rates applied to for the ‘control’ office in analyses.
Orientation Internal min temp Internal max temp Air-change rate ‘Control’ office
South 198C 248C 1 ach (all time)
North 1 ach (occupied
hours), 3 ach (unoccupied hours) Modifications East 158C 288C 3 ach (occupied
hours), 1 ach (unoccupied hours)
[image:7.612.312.569.279.395.2] [image:7.612.42.302.300.362.2]solar irradiance) in the form of heat flux. Other weather para-meters such as wind speed and humidity were not used as the wind data from Hadley models were found to be unreliably
high [19], and humidity levels were omitted to keep the model
relatively simple. Figure 11 shows the second-order room
model.
4.2
Internal gains
The second-order room model described above considers an empty room. In an occupied office, there will be lighting, equipment and occupants that will increase the heat inside the room. Assuming that there are two occupants using the room, each having a personal computer: each person emits 100 W of
sensible heat to the room, lighting 100 W and from CIBSE
Guide A, Section 6.4.8 [20], the nameplate rating of personal computers is 200 W, with a nameplate ratio of 0.7, each machine will emit 140 W. In total, there will be an internal gain of 580 W added to the simulations in each case.
5
DETERMINING ENERGY PERFORMANCE
OF OFFICES
The heating and cooling loads for the office room are studied by running various TRYs in the second-order model. For this analysis, the comfort band determines whether heating or cooling is required. During the occupied hours (08:00 – 18:00),
if the inside air temperature,tai, gets above the upper band of
the comfort zone (248C or 288C for a wider comfort band),
then cooling is applied instantly, to bring it back to the middle of the comfort band (21.58C in all cases). Similarly, if tai gets
below the lower band (19 or 158C for the wider comfort
band), heating is applied. The heat input or heat removal (the energy loads) for this is determined from (1).
QreqðforTdesÞ¼
Tdes ðUeAeÞþ
1
3nVþ
maCpa
timestep
ðUeAeÞþ
1 3nV
taoðNÞ
maCpataiðNÞ
timestep
Afhc
þtaiðNÞ 8 > > > > > > > > > > > > > > > > > > > > > > > < > > > > > > > > > > > > > > > > > > > > > > > : 9 > > > > > > > > > > > > > > > > > > > > > > > = > > > > > > > > > > > > > > > > > > > > > > > ; Af Rf þAfhc
Af
Rf tfðNÞ
AfhctaiðNÞ
ð1Þ
Tdes will be set as 21.58C for both the cooling and heating,
and removing the heat input from solar and internal gains from this value gives the heating requirement ( positive differ-ence) or cooling requirement (negative differdiffer-ence) for the
room to have an inside air temperature of 21.58C. These are
[image:8.612.145.470.62.241.2]summed, giving annual heating and cooling energy loads. As for the actual HVAC systems, in this analysis, a natural gas boiler is assumed for heating and a chiller for cooling. For
Figure 11. Second-order electrical circuit analogy for building.tf, temperature of the fabric (8C);Rf, resistance of the fabric (K m2/W);Af, area of the fabric
(m2);t
si, temperature of the interior surface (8C);QS, amount of solar energy (heat flux) coming into the room (W);hc, weighted surface to air heat transfer
rate (W/m/K);tai, inside air temperature (8C);Ue,U-value of the external fac¸ade (W/m/K);Ae, area of the external fac¸ade (window) (m2);tao, outside air
temperature (8C);n, number of air-changes (h-1);V, volume of the room (m3);m
f, mass of the fabric (kg); Cpf, specific heat capacity of air (J/kg/K);ma, mass
of air (kg); Cpa, specific heat capacity of air (J/kg/K).
the calculation of primary energy consumption, a ratio of 2.579 is applied to electricity for cooling.
6
RESULTS AND DISCUSSION
6.1
Heating and cooling loads during occupied
hours for the ‘control’ office room
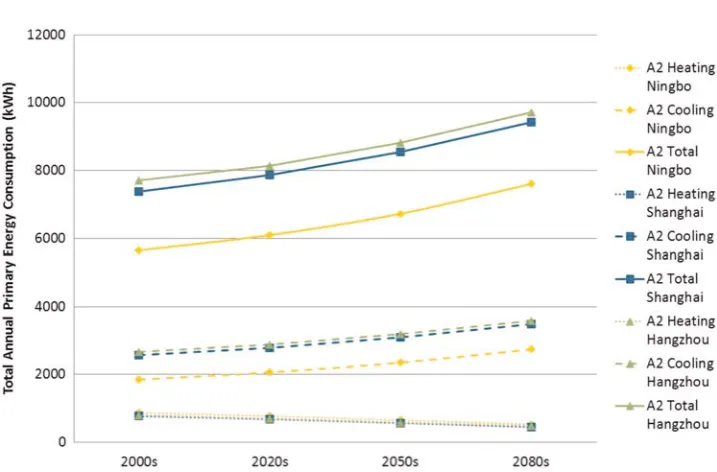
Figure 12 shows the heating and cooling demands for the
‘control’ office room located in Ningbo, under the four differ-ent scenarios. It can be seen that depending on the scenario, the heating demand will be reduced by 25 – 50% from current levels in 2080s. The percentage rise in the cooling demand is slightly higher than the percentage reductions in the heating
demand (between 27 and 57%); however, current levels of actual cooling demands are already approximately twice that of heating demands, so the actual rise is steeper. This results in an overall increase in energy demand under all four scenarios. As cooling is assumed to be more energy intensive in this ana-lysis, the rise in the total primary energy consumed is even more severe (although there is a small initial drop in the total energy demand under the most severe A1F scenario). Results for Shanghai and Hangzhou are similar, but with significantly higher cooling and total demands due to the warmer weather in these two cities. Heating, cooling and total demands for all
three cities are compared in Figure 13. It can be seen that
[image:9.612.126.483.60.269.2]al-though heating demands are similar for all three cities, the cooling demands in Shanghai and Hangzhou are significantly
Figure 12. Heating and cooling demands for the ‘control’ office room in Ningbo.
[image:9.612.125.484.282.518.2]higher than that for Ningbo. With the control office room under the A2 scenario, the cooling demand in Ningbo in 2050s is still lower than the current levels for Shanghai and Hangzhou.
6.2
Heating and cooling loads with changes
in glazing orientation
Using Ningbo under the A2 scenario to show the changes to
energy loads with modifications, Figure 14 shows the effects
with changes in the orientation of glazing. The heating demand decreases steadily with a warming climate, but the levels of heating requirement for each period are very similar for all four orientations of glazing.
[image:10.612.125.487.61.265.2]Increases in cooling loads are comparable with all four orientations, with north-facing having a less cooling demand as a result of virtually no direct solar gain. West-facing office configuration has significantly higher cooling (and thus total) demand than other orientations, as direct solar gains coincide with hours of high DBTs outside. South-facing and east-facing offices have similar cooling loads. Comparing the north-facing office (lowest cooling demand) with the west-facing office (highest cooling demand), it can be seen that the former reaches the current level of the latter as early as 2020s, and the differences between various future scenarios are more signifi-cant than differences between the different orientations from 2050s onwards.
Figure 14. Comparison of heating and cooling demands for the ‘control’ office room in Ningbo with varying glazing orientations.
Figure 15. Comparison of heating and cooling demands for the ‘control’ office room in Ningbo with varying air-change rates.
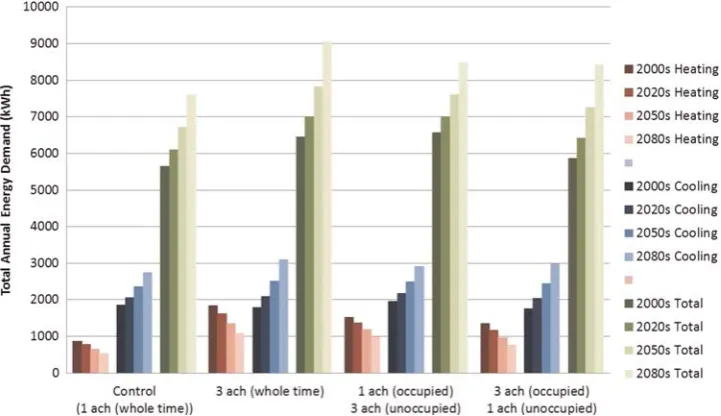
[image:10.612.125.486.301.509.2]6.3
Heating and cooling loads with changes
in air-change rates
Figure15 shows changes in energy demand due to changes in
air-change rates. Initially, it was assumed that by increasing the air-change rate of the office room, it could remove some of the heat stored in the building fabric, and help reduce cooling loads. This turns out to be true to a certain extent, with higher air-change rate settings providing lower cooling demands in the 2000s and 2020s when the air-change rate increased from 1 ach all the time to 3 ach all the time, and also to when it was set to 3 ach for occupied hours and 1 ach for unoccupied hours. However, the inherent increase in the heating demand counteracts against this approach, with resulting energy loads significantly higher in all cases of higher air-change rates. Although out of scope in the analyses conducted in this article, another approach could be to increase air-change rates in summer and reduce it to a minimum in winter and see if this is a useful strategy to employ for energy reduction.
6.4
Heating and cooling loads with changes
in building specification, building ‘weight’
and internal comfort temperature range
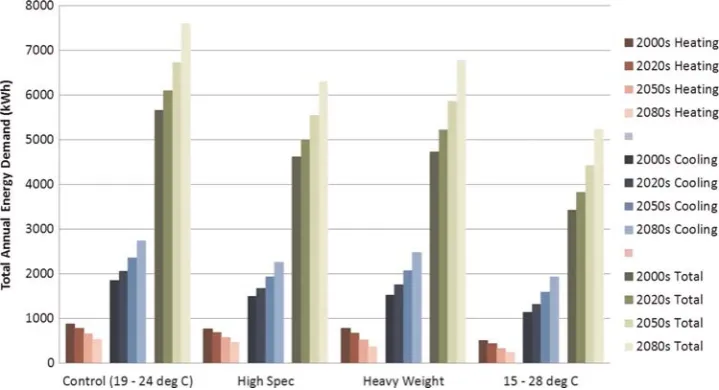
Figure16shows changes in energy demand by having a higher
building specification (lower U-values, double-glazing instead
of single-glazing), heavier construction and a wider internal temperature comfort band, compared with the ‘control’ office room. It appears that all three approaches have significant effects in reducing heating and cooling demands. Comparing an office with higher building specification to the one with heavier construction, the heavier building tend to have more effect on the reduction in heating load, especially when the climate is warmer (only for Ningbo at the current climate, and B1 scenario in 2020s when it is cooler, did the office with higher specification required lower heating load than the
‘heavy’ office). With higher specification, the reduction in the cooling demand was much more significant, and since cooling requires more primary energy, this approach is also more effective than having ‘heavy’ construction.
Compared with the two aforementioned strategies, widening
the internal comfort band from 19 – 248C to 15 – 288C has a
more significant effect, with even the primary energy demand in 2080s being lower than that with the current climate. However, there will be a compromise to occupant comfort and possibly reduction in productivity. The optimum solution appears to be having higher building specifications (similar to standard required to 2002 Building Regulations in England
and Wales [21] and is what was used in the ‘high specification’
office in this analysis) and also to increase the temperature band to the limit where effects to comfort and productivity are acceptable. The extent of the optimum comfort range will require further research.
6.5
Combining various modifications to produce
‘optimum’ office configuration
Having analysed the effects of various modifications to the ‘control’ office room, it is possible to combine the most effect-ive ones to produce an ‘optimum’ office configuration. This includes having a higher building specification, a ‘heavy’ con-struction, keeping air-change rates to 1 ach all the time and
in-creasing the internal comfort band from 19 – 24 to 15 – 288C.
All four orientations are tested as although north-facing glazing produces most of the reductions in the total energy demand, this is not always the case, with east-facing and south-facing glazing also contributing to some of the lower energy
demand configurations. Figure 17 shows the changes in
heating and cooling demands from the ‘control’ office room with the ‘optimized’ configuration under all four orientations
[image:11.612.125.485.61.256.2]for Ningbo. Figure 18 shows the same comparison for
Shanghai. Although the actual energy demand figures are dif-ferent for the two cities, it can be seen that the possible reduc-tion in the total energy demand is between 35 and 50% in all cases of optimized configurations. The effects of such ‘opti-mized’ office configurations are slightly greater in Shanghai and Hangzhou due to the warmer weather.
The important result is that even with the effects of climate change in the 2080s, the total primary energy consumption is still 54 – 73% (depending on future scenario) of the current levels with ‘control’ offices. Again, with Shanghai and Hangzhou, the effects are even better due to the difference in climate (48 – 64% of current levels with ‘control’ offices).
From these two figures, although the differences between the primary energy consumption of optimized configuration
with different orientations are small, it can be seen that north-facing glazing still produces the least primary energy demand.
Figure 19 shows the comparison between north-facing
‘optimum’ configurations for Ningbo, Shanghai and
Hangzhou, with Ningbo requiring significantly less energy than Shanghai and Hangzhou.
Figure 20 shows the results for ‘optimized rooms’
[image:12.612.125.487.59.269.2](north-facing glazing) in Ningbo under the four different IPCC future scenarios. It can be seen that as with the ‘control’ office, differ-ences in the reduction in the heating demand are very small between the different scenarios compared with the differences in the increases in the cooling demand. Percentage increases in the cooling demand from the current climate to 2080s climate could be between 55 and 117% depending on the future
[image:12.612.125.486.312.524.2]Figure 17. Comparison of heating and cooling demands for the ‘control’ office room in Ningbo with optimized configurations.
Figure 18. Comparison of heating and cooling demands for the ‘control’ office room in Shanghai with optimized configurations.
scenario. This is primarily due to the lower level of the initial cooling demand with optimized rooms. Comparing actual figures, with optimized rooms, from 2000s to 2080s, the total primary energy consumption for heating and cooling increased by 850 kWh (3060 MJ) with the least severe B1 scenario and 1850 kWh (6660 MJ) with the most severe A1F scenario. With ‘control’ configurations, the increases are 1100 kWh (3960 MJ) and 2300 kWh (8280 MJ), respectively.
It should still be noted that, in terms of percentages changes, with improvements in building quality and optimization of configurations, the effects of future scenarios become more dominant.
7
CONCLUSION
From the results in the previous section, it is evident that in the face of future climate change, the rise in the cooling demand will outweigh the decrease in the heating demand, thus resulting in an overall rise in energy demand for the whole year for office buildings in the Yangtze River delta region. The high primary energy intensity for providing cooling would mean an even steeper rise in primary energy consumption for heating and cooling.
[image:13.612.125.487.60.272.2]Results for Ningbo were significantly lower than that for Shanghai and Hangzhou, mainly due to lower external
[image:13.612.125.484.318.522.2]Figure 19. Comparison of heating and cooling demands for optimized configurations with north-facing glazing for Ningbo, Shanghai and Hangzhou.
temperatures, but also lower solar radiation levels of the current existing TRY. As for Shanghai and Hangzhou, the values of diffused solar radiation are also unusually close to the global solar radiation. All these should be checked against real observed data to see if the existing TRYs are reliable.
Results from changing the orientation of glazing show that there is little difference with the heating demand, but north-facing facades have the least cooling demand, as there are virtu-ally no direct solar gain. However, by as early as 2020s, it will already reach the current levels for the worst-performing west-facing facades. Being located in a relatively low-latitude region, the angle of mid-day sun during summer is high, and this bene-fits south-facing orientations, which have similar cooling demands to east-facing offices. The situation can be improved further with the installation of external shading devices. The situation is more problematic for east-facing, and even more so for west-facing facades, due to low angles of direct solar penetra-tion, which cannot be easily overcome with external shading.
Results also show that having heavy-weight construction in this region only has some effects to the overall energy demand of the building, particularly in reducing the heating demand. However, it is more effective to have higher
build-ing specifications (lower U-values and higher quality of
glazing), as this will have a greater impact on the reduction
in cooling loads. Expanding the internal temperature
comfort range produces the most significant results, but oc-cupant comfort and productivity may be compromised. Perhaps, a more flexible regime to office clothing would make this possible. A more thorough study on acceptable comfort range in office buildings in this region is therefore required to further investigate this.
Increasing air-change rates had a detrimental effect to the overall energy demand, but showed signs that it could reduce cooling demands in summer. As with the comfort range, further investigation is required to see if and how this strategy could be employed to reduce energy demand.
By incorporating most of the effective changes to the ‘control’ office room, the total primary energy consumption can be lowered to 35–50% of existing levels, which is much lower than the rise predicted for climate change. For offices with optimized configurations, primary energy consumption in 2080s for heating and cooling will still only be 48–73% of current levels (depend-ing on site and future scenario) than standard build(depend-ings now, al-though this is somewhat optimistic since the comfort range used in the optimized configurations was very large, which may have detrimental effects on comfort and productivity.
In summary, for office buildings in the Yangtze River delta region, it is very much possible to produce office buildings with lower energy consumption, even in the face of climate change. The main reason being there is so much more scope for improvements that can be made to the existing building stock. However, with similar types of buildings, the effects of future climate change are significant.
REFERENCES
[1] Dhakal S. Urban energy use and carbon emissions from cities in China and policy implications.Energy Policy2009;37:4208 – 19.
[2] Thermal Design Code for Civil Building. GB50176-93. China Architecture and Building Press,1993 (in Chinese).
[3] Wan KKW, Cheung KL, Yang L,et al. A new variable for climate change study and implications for the built environment. Renew Energy
2009;34:916 – 9.
[4] Yu J, Yang C, Tian L,et al. Evaluation on energy and thermal performance for residential envelopes in hot summer and cold winter zone of China.
Appl Energy2009;86:1970 – 85.
[5] Nicholls R.J., Hanson S., Herweijer C.,et al.Ranking Port Cities with High Exposure and Vulnerability to Climate Extremes: Exposure Estimates, OECD Environment Working Papers, No. 1. OECD Publishing, 2008. doi: 10.1787/011766488208.
[6] Gordon C, Cooper C, Senior CA, et al. A simulation of SST, sea ice extents ocean heat transports in a version of the Hadley centre coupled model without flux adjustments.Climate Dyn2000;16:147 – 68.
[7] China Meteorological Administration Weather Information Centre, Department of Building Science, Tsinghua University
( ).
China Construction Weather Dataset for Thermal Analysis Work
( ). China Construction Industry Publishing ( ), 2005. ISBN: 7112072743 (in Chinese).
[8] Zhang Q, Huang J.Chinese Typical Year Weather Data for Architectural Use
(in Chinese), 2004. ISBN: 7-111-14810-X. China Machine Press. [9] http://swera.unep.net/ (accessed on 29 February 2012). [10] http://www.nbqx.gov.cn/ (accessed on 29 February 2012).
[11] Nakicenovic N.‘Emissions Scenarios’ Intergovernmental Panel on Climate Change. Cambridge University Press, 2000. ISBN 0521 80493 0.
[12] WMO and UNEP. IPCC climate change 2001, summary for policy makers and technical summary of the Working Group I report, 2001, 63 – 5.
[13] Chow DHC, Levermore G, Jones P, et al. Extreme and near-extreme climate change data in relation to building and plant design. Build Serv Eng Res Technol2002;23:233 – 42.
[14] Chow DHC, Levermore G. New algorithm for generating hourly tempera-ture values using daily maximum, minimum and average values from climate models.Build Serv Eng Res Technol2007;28:237 –48.
[15] Belcher S, Hacker J, Powell D. Constructing design weather data for future climates.Build Serv Eng Res Technol2005;26:49 –61.
[16] Design standard for energy efficiency of public buildings in the Zhejiang Province, 2007. DB33/1038-2007.
[17] Chow DHC, Levermore G. The effects of future climate change on heating and cooling demands in office buildings in the UK.Build Serv Eng Res Technol2007;31:307 – 23. doi:10.1177/0143624410371284.
[18] IES VE. Virtual Environment (VE) by Integrated Environment Solutions (IES), 2009. http://www.iesve.com.
[19] Chow DHC, Levermore G, Jones P, et al. Extreme and near-extreme climate change data in relation to building and plant design. Build Serv Eng Res Technol2002;23:233 – 42.
[20] CIBSE. Environmental Design CIBBE Guide A, 7th edn. The Chartered Institution of Building Services Engineers, 2006, 6-1 – 12.
[21] NBS/RIBA.Guide to Part L of Building Regulations—Conservation of Fuel and Power. NBS/RIBA Enterprises, 2006. ISBN-10: 1859461999.
![Figure 1. Climatic zones of China and location of the Yangtze River Delta area [4].](https://thumb-us.123doks.com/thumbv2/123dok_us/8709317.382789/2.612.127.469.60.284/figure-climatic-zones-china-location-yangtze-river-delta.webp)