Dynamics of ITCZ Width: Ekman Processes, Non-Ekman Processes,
and Links to Sea Surface Temperature
MICHAELP. BYRNE
University of St. Andrews, Fife, and University of Oxford, Oxford, United Kingdom
RHIDIANTHOMAS
Imperial College, London, United Kingdom
(Manuscript received 28 January 2019, in final form 8 May 2019)
ABSTRACT
The dynamical processes controlling the width of the intertropical convergence zone (ITCZ) are investi-gated using idealized and CMIP5 simulations. ITCZ width is defined in terms of boundary layer vertical velocity. The tropical boundary layer is approximately in Ekman balance, suggesting that wind stress places a strong constraint on ITCZ width. A scaling based on Ekman balance predicts that ITCZ width is proportional to the wind stress and inversely proportional to its meridional gradient. A toy model of an Ekman boundary layer illustrates the effects of wind stress perturbations on ITCZ width. A westerly wind perturbation widens the ITCZ whereas an easterly perturbation narrows the ITCZ. Multiplying the wind stress by a constant factor does not shift the ITCZ edge, but ITCZ width is sensitive to the latitude of maximum wind stress. Scalings based on Ekman balance cannot fully capture the behavior of ITCZ width across simulations, suggesting that non-Ekman dynamical processes need to be accounted for. An alternative scaling based on the full mo-mentum budget explains variations in ITCZ width and highlights the importance of horizontal and vertical momentum advection. Scalings are also introduced linking ITCZ width to surface temperature. An extension to Lindzen–Nigam theory predicts that ITCZ width scales with the latitude where the Laplacian of SST is zero. The supercriticality theory of Emanuel is also invoked to show that ITCZ width is dynamically linked to boundary layer moist entropy gradients. The results establish a dynamical understanding of ITCZ width that can be applied to interpret persistent ITCZ biases in climate models and the response of tropical precipitation to climate change.
1. Introduction
The intertropical convergence zone (ITCZ) is a planetary-scale band of low-level mass convergence and intense rainfall (Waliser and Gautier 1993). The ITCZ migrates north and south across the equator in response to seasonal changes in insolation. Given its dominant influence on tropical hydroclimate and im-portance for societies at low latitudes, the physical mechanisms controlling the ITCZ have received con-siderable attention (e.g.,Philander et al. 1996;Broccoli et al. 2006; Kang et al. 2008; Frierson et al. 2013;
Donohoe et al. 2013;Bischoff and Schneider 2014;Byrne
and Schneider 2016a). The bulk of ITCZ research has focused on the mechanisms controlling its mean posi-tion or latitude, and these mechanisms are now well understood at least in the zonal-mean context [see re-views byChiang and Friedman (2012),Schneider et al. (2014), Donohoe and Voigt (2017), and Kang et al. (2018)].
By comparison, the processes determining the width of the ITCZ are understudied despite its importance for regional and global climate. Recent work has shown that ITCZ width influences global precipitation and top-of-the-atmosphere energy balance (Su et al. 2017;
Byrne and Schneider 2018) and is dynamically linked to the poleward extent of the Hadley cells and the
Denotes content that is immediately available upon publica-tion as open access.
Corresponding author: Michael P. Byrne, [email protected]
This article is licensed under aCreative Commons Attribution 4.0 license(http://creativecommons.org/ licenses/by/4.0/).
DOI: 10.1175/JAS-D-19-0013.1
latitudes of the storm tracks (Watt-Meyer and Frierson 2019). Furthermore, changes in ITCZ width in re-sponse to radiative forcing are strongly anticorrelated with changes in ITCZ strength (Byrne et al. 2018), suggesting that a better understanding of the processes controlling ITCZ width could help constrain ITCZ strength and tropical rainfall intensity.
We currently lack a closed theory for ITCZ width and its response to climate perturbations. In recent years, however, progress has been made in under-standing how different processes affect ITCZ width. A theory derived from atmospheric mass and moist static energy budgets quantifies how the ITCZ nar-rows or widens in response to changes in gross moist stability, cloud radiative effects, energy/moisture ad-vection, and moisture transport by transient eddies (Byrne and Schneider 2016a); other studies have also identified that these processes can affect ITCZ width (Bretherton and Sobel 2002; Sobel 2003; Chou and Neelin 2004;Sobel and Neelin 2006;Chou et al. 2009;
Harrop and Hartmann 2016;Popp and Silvers 2017;
Dixit et al. 2018; Emanuel 2019). This energetic theory has been used to investigate the processes contrib-uting to projected narrowing of the ITCZ in coupled climate models (Byrne and Schneider 2016b) and could potentially be applied to understand observed ITCZ narrowing over recent decades (Wodzicki and Rapp 2016).
Despite these recent advances in our mechanistic understanding of ITCZ width, there are opportunities for further progress by considering the dynamics of the atmospheric boundary layer. The boundary layer mo-mentum budget has been successfully invoked to ex-plain the spatial distribution of tropical low-level convergence and precipitation (Lindzen and Nigam 1987;Waliser and Somerville 1994;Tomas et al. 1999;
Stevens et al. 2002;Sobel 2007;Schneider and Bordoni 2008; Gonzalez et al. 2016) but has not been applied specifically to the problem of ITCZ width. There has been a long-standing debate in the atmospheric dy-namics community regarding whether tropical conver-gence is driven by boundary layer dynamics or by thermodynamic processes higher in the atmosphere such as latent heat release [see section 2 of Sobel and Neelin (2006)for a summary of these competing argu-ments]. Several influential studies argue that low-level convergence—and hence ITCZ width—is primarily controlled by surface pressure gradients and bound-ary layer dynamics (Lindzen and Nigam 1987;Sobel and Neelin 2006; Back and Bretherton 2009). It is therefore important to develop an understanding of ITCZ width from a dynamics perspective to comple-ment the recent studies based on energetics and
thermodynamics (Chou et al. 2009;Byrne and Schneider 2016a; Harrop and Hartmann 2016; Popp and Silvers 2017;Dixit et al. 2018).
Here we use the boundary layer zonal momentum budget together with idealized simulations to investigate the dynamics of ITCZ width. In particular, we examine the momentum budget near the ITCZ edge, assess the dominant terms, and quantify the processes controlling low-level convergence and vertical velocity in that re-gion. We also derive a range of scalings for ITCZ width and assess the importance of Ekman versus non-Ekman processes. Finally, we link ITCZ width to sea surface temperature (SST) and boundary layer moist entropy using simple extensions to the theories ofLindzen and Nigam (1987)andEmanuel (1995).
2. Simulations
a. Idealized GCM
We perform simulations using the idealized, gray-radiation GCM of O’Gorman and Schneider (2008b)
based on the model developed byFrierson et al. (2006)
andFrierson (2007). Insolation is set to an annual-mean profile and the longwave optical thickness is specified as a function of latitude and pressure. All the idealized simulations discussed here are run in an aquaplanet configuration with a mixed layer depth of 1 m and no horizontal energy transports (zeroqfluxes). Surface fluxes of momentum, moisture and sensible heat are calculated using bulk aerodynamic formulas, with a gustiness factor of 1 m s21 added to the surface ve-locities. Monin–Obukhov similarity theory is used to calculate the drag coefficients and the roughness lengths are 531023m for momentum and 131025m for moisture and sensible heat. The boundary layer height is calculated dynamically and a k-profile scheme is used to parameterize boundary layer con-vection. The aquaplanet configuration has no inter-hemispheric asymmetries in statistical steady state and consequently the ITCZ is centered on the equa-tor. The model has a horizontal spectral resolution of T127, 20 verticalslevels, and an integration time step of 150 s. Simulations are spun up for 700 days with averages taken over the subsequent 1000 days. See
Byrne and Schneider (2016a) for an extended de-scription of the model setup. As the model is sym-metric about the equator, the ITCZ-edge latitudes discussed later have been averaged between the Northern and Southern Hemispheres.
simulation is based on a reference profile that has been rescaled by different factorsa.1
b. CMIP5 models
We also examine ITCZ width in three fixed-SST aquaplanet simulations from phase 5 of the Coupled Model Intercomparison Project (CMIP5) (Taylor et al. 2012): aquaControl, aqua4K, and aqua4xCO2. Simulations from the CNRM-CM5, FGOALS-g2, HadGEM2-A, IPSL-CM5A-LR, IPSL-CM5B-LR, MIROC5, MPI-ESM-LR, MPI-ESM-MR, and MRI-CGCM3 models are analyzed.
3. Boundary layer dynamics near the ITCZ edge
a. Definition of ITCZ width
We define ITCZ width as the distance in degrees of latitude between the northern and southern ITCZ edges. For the majority of the analyses in this paper the edges of the ITCZ are defined as the latitudes closest to the equator (north and south) at which the time-mean vertical velocity at the boundary layer top is zero. For analysis purposes we specify the boundary layer top as the s 5 0.8 level in the idealized GCM simulations, though note that the model determines the boundary layer height dynamically. This is similar to the definition ofByrne and Schneider (2016a)but in their analysis the midtropospheric mass streamfunction is used to define the ITCZ edges. We choose to focus on the boundary layer ITCZ width because it is more directly connected to the boundary layer momentum budget, which is the tool used here to investigate the ITCZ. Although we will mostly focus on the boundary layer definition of ITCZ width, below we compare how different measures of ITCZ width scale with global-mean surface temperature.
b. ITCZ width versus global-mean SST in idealized GCM simulations
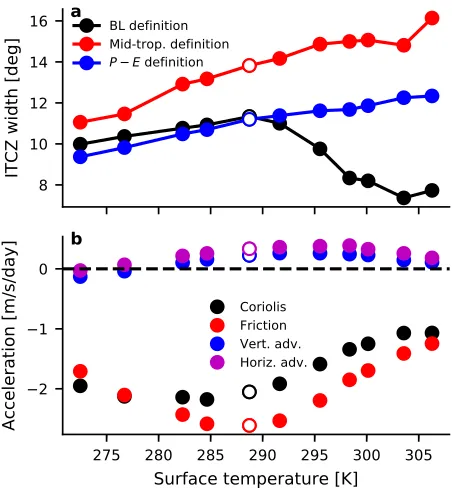
The average ITCZ width (defined using boundary layer vertical velocity) across the set of simulations over which longwave optical thickness is varied is 9.68 latitude; the width varies by 48as global-mean SST is increased from 272 to 306 K (Fig. 1a). As discussed by
Byrne and Schneider (2016a), vertical velocity–based definitions of ITCZ width are considerably wider than definitions based on brightness temperature or heavy precipitation (e.g., Dias and Pauluis 2011; Wodzicki and Rapp 2016). Differences between definitions of
ITCZ width based on vertical velocity versus precipita-tion are likely to be explained in part by convergence at the top of the boundary layer sometimes driving shallow, nonprecipitating convection rather than deep, precipitating convection—see section 4.4.1 of Sobel (2007)for a discussion of this issue.
Different measures of ITCZ width scale differently with global-mean SST (Fig. 1a). Boundary layer ITCZ width does not change monotonically with global warm-ing, rather the ITCZ widens with warming in cooler cli-mate and narrows with warming in hotter clicli-mates. This nonmonotonic dependence of ITCZ width on tempera-ture in the idealized GCM is reminiscent of the behavior of other quantities including mean available potential energy (O’Gorman and Schneider 2008a), strength of the Hadley cell (O’Gorman and Schneider 2008b), tropical meridional wind (Byrne and Schneider 2016a), and the
FIG. 1. (a) ITCZ width and (b) the various terms in the boundary layer zonal momentum budget,(2), evaluated at the ITCZ edge vs global-mean SST for the idealized GCM simulations with different longwave optical thicknesses. Included in (a) are three measures of ITCZ width that differ due to their definitions of the ITCZ edges: 1) edges defined as the latitudes closest to the equator (north and south) where the vertical velocity at the top of the boundary layer is zero (black dots and line), 2) edges defined as the latitudes at which the slope of the mass streamfunction in the midtroposphere is zero (red dots and line), and 3) edges defined as the latitudes closest to the equator at which zonal-meanP2E50 (blue dots and line). In (b), the acceleration terms are evaluated at the ITCZ edge as de-fined using vertical velocity at the top of the boundary layer. Here and in subsequent figures the unfilled circles denote the reference simulation with a scaling factor ofa51.0 for the longwave optical thickness.
1For the idealized GCM simulations we rescale the longwave
optical thickness of a reference simulation by the following factors:
[image:3.567.292.518.60.304.2]land–ocean warming contrast (Byrne and O’Gorman 2013a). In contrast, ITCZs defined in terms of the midtropospheric streamfunction and precipitation mi-nus evaporation (P2E) generally widen with warming across the simulations (Fig. 1a). The differing mag-nitudes and scaling behaviors of mass-based versus moisture-based definitions of ITCZ width have been discussed previously and linked to moisture transport by transient eddies (Byrne and Schneider 2016a). We will now use boundary layer dynamics to analyze variations in ITCZ width, defined using the boundary layer vertical velocity, over a wide range of climates.
c. Zonal momentum budget
We start with the steady-state zonally averaged zonal momentum equation (seePeixóto and Oort 1984):
fy5 2Fx2tanf a uy1
y
a
›u
›f1v ›u
›p, (1)
where f 5 2Vsinf is the Coriolis parameter, Fx is the zonal component of the frictional force,ais Earth’s radius, f is latitude (rad),v is the vertical (pressure) velocity, and the other symbols have their usual mean-ings. Taking the mass-weighted vertical average over the boundary layer,(1)becomes
f[y]
|{z} Coriolis
5 2zfflfflfflfflfflfflfflfflffl}|fflfflfflfflfflfflfflfflffl{(g/Dp)tx,sfc
frictional
2tanf
[image:4.567.288.511.64.301.2]a [uy] |fflfflfflfflfflffl{zfflfflfflfflfflffl}
metric
1
y
a
›u
›f
zfflfflffl}|fflfflffl{horiz:adv:
1
v›u ›p
|fflfflffl{zfflfflffl} vert. adv.
,
(2)
where [] denotes a mass-weighted vertical average over the boundary layer,gis the acceleration due to gravity, Dp5ps2pBLis the pressure difference between the
surface and the boundary layer top, andtx,sfcis the zonal
component of the vertical turbulent stress (which we will call the zonal wind stress). The various forces have been labeled: Coriolis, frictional, metric, and the horizontal and vertical advection of relative momentum. In de-riving (2), we have assumed that the turbulent stress vanishes at the boundary layer top.
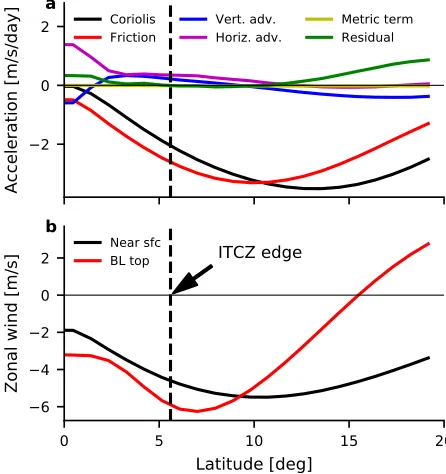
In the reference idealized GCM simulation (a51.0), the Coriolis and frictional terms dominate the zonal momentum budget in the vicinity of the ITCZ edge (Figs. 1band2a). The vertical and horizontal momen-tum advection terms have similar magnitudes but are substantially smaller than the Coriolis and frictional terms; the metric term is negligible (Fig. 2a) and will not be discussed further. It is common to assume Ekman balance in the tropical atmospheric boundary layer, that is, a balance between Coriolis and frictional forces
(e.g., Lindzen and Nigam 1987; Emanuel 1995; Held 2001). This force balance holds approximately at the ITCZ edge across the wide range of climates simulated by the idealized GCM (Fig. 1b), suggesting that Ekman balance is a natural starting point for understanding the dynamics of ITCZ width. A recent study found that Ekman balance breaks down near the ITCZ, at least in a dry equatorialb-plane model of the tropical boundary layer, because the horizontal advection term becomes large (Gonzalez et al. 2016). In our idealized GCM simulations we note that the vertical and horizontal advection terms become relatively more important at the ITCZ edge in warmer climates as the magnitudes of the Coriolis and frictional terms decrease (Fig. 1b). However, the zeroth-order balance is between Coriolis and frictional forces across all simulations.
In the boundary layer momentum budget the fric-tional force provides an eastward acceleration to the zonal wind at the ITCZ edge because the tropical sur-face winds are easterly (Fig. 2b); there is a transfer of zonal momentum from the surface to the overlying at-mosphere. This eastward acceleration is largely balanced by westward acceleration associated with equatorward advection of air with relatively low planetary angular
FIG. 2. (a) Terms in the boundary layer zonal momentum budget,
momentum by the surface branch of the Hadley cell (the Coriolis term). For all except the coldest two simulations (Fig. 1b), both the vertical and horizontal advection terms provide a westward acceleration to the boundary layer zonal wind at the ITCZ edge by advecting low–angular momentum air. The horizontal advection term acceler-ates the easterly zonal wind at the ITCZ edge provided the maximum in tropical surface easterlies is poleward of the ITCZ edge, as is the case in the reference simulation (Fig. 2b). Equivalently, if the latitude of zero surface relative vorticity (where›usfc/›f50) lies poleward of the ITCZ edge, the horizontal advection term will accelerate the easterly zonal flow there. For the vertical advection term, if the latitude at which the flow is nondivergent (i.e., where›v/›p50) did not vary with height, the vertical advection term in(2) would be identically zero at the ITCZ edge. However, the latitude of nondivergence generally tilts poleward with height in the idealized GCM simulations, which is consistent with a midtropospheric definition of the ITCZ being wider than a definition based on vertical velocity at the top of the boundary layer (see
Fig. 3 and discussion in section 4). Consequently, the vertical advection term in the zonal momentum budget is nonzero at the ITCZ edge and accelerates the east-erly zonal wind for the majority of simulations (Fig. 1b).
4. Scalings for ITCZ width based on Ekman balance
We have demonstrated that the boundary layer at the ITCZ edge is approximately in Ekman balance in the idealized GCM (Fig. 1b). We now use Ekman balance to derive simple dynamical scalings for ITCZ width and apply these scalings to the idealized GCM and CMIP5 simulations.
a. Relationship between ITCZ width, wind stress, and vorticity
Perhaps the simplest estimate for the latitude of the ITCZ edge (and ITCZ width) is obtained by assuming Ekman balance in the atmospheric boundary layer and taking the wind stress to be linearly proportional to the surface wind (e.g.,Held and Hou 1980):
f[y]5Cusfc, (3)
whereCis a constant drag coefficient. Combining(3)
with the zonally averaged mass continuity equation in pressure coordinates,2assuming zero vertical velocity at
the surface, and for now neglecting meridional varia-tions in the Coriolis parameter and cosf, it is straight-forward to show that vertical velocity at the top of the boundary layervBLis proportional to the surface
rela-tive vorticity:vBL}›usfc/›f. This relationship suggests
that the ITCZ-edge latitudefITCZ, wherevBL50 by
definition, scales with the latitude where ›usfc/›f 50
and the surface flow transitions from cyclonic to anti-cyclonic relative vorticity.
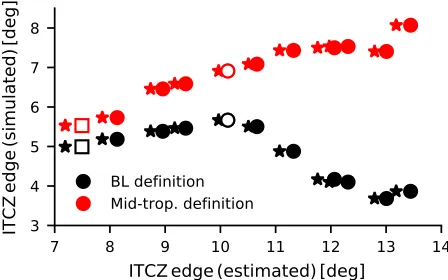
[image:5.567.292.516.63.203.2]Testing this simple prediction in the idealized GCM, we find that the latitude of zero relative vor-ticity does not scale monotonically with the ITCZ edge defined in terms of boundary layer vertical ve-locity (black circles inFig. 3). This implies, perhaps not surprisingly, that frictional Ekman convergence alone—where we have also neglected the component due to meridional gradients in the reciprocal of the Coriolis parameter—cannot capture the behavior of ITCZ width over the full range of idealized GCM simulations. Interestingly, there is a strong correla-tion between the latitude of zero relative vorticity and the ITCZ edge defined in terms of the mid-tropospheric streamfunction (red circles in Fig. 3) though the latitude of zero relative vorticity tends to overestimate the ITCZ width. The variation of the ITCZ edge with height and the contrasting scaling relationships between different ITCZ-width defini-tions (Figs. 1aand3) are due to the momentum ad-vection terms becoming increasingly important for
FIG. 3. Latitudes of the ITCZ edges in the idealized GCM simulations vs the ITCZ edges estimated as the latitudes where
›usfc/›f50 (circles) and the latitudes where›tx,sfc/›f50 (stars).
For the simulated ITCZ edges (yaxis), black markers show the edges defined in terms of vertical velocity at the top of the boundary layer and red markers show the edges defined using an alternative definition based on the midtropospheric stream-function. Specifically, the streamfunction definition calculates the ITCZ edges as the latitudes north and south of the equator at which the slope of the streamfunction is zero. Here and in sub-sequent figures unfilled squares denote the coldest simulation (a50.4).
2The steady-state continuity equation written in pressure
driving ascent higher in the atmosphere versus at the top of the boundary layer (not shown). In summary, surface relative vorticity is closely tied to ITCZ width in the midtroposphere but the connection to ITCZ width at the top of the boundary layer is more complex.
Related to this simple estimate for the ITCZ-edge latitude, Tomas and Webster (1997) argue that the barrier between boundary layer convergence and di-vergence in the tropics (which is the ITCZ edge by our definition) coincides with the zero contour of the verti-cal component of absolute vorticity, where absolute vorticity in the zonal mean ish5f2(1/a)(›usfc/›f). If the product of the Coriolis parameter and absolute vorticity is negative (fh,0) this implies that the flow is inertially unstable;Tomas and Webster (1997)find evidence of such unstable regions close to the equa-tor and argue that they are associated with cross-equatorial advection of absolute vorticity by large pressure gradients at the equator. In our idealized GCM simulations, however, there are no interhemi-spheric asymmetries by construction and so there is no time-mean pressure gradient at the equator and the zero contour of absolute vorticity lies at the equator. Consequently, theTomas and Webster (1997)theory cannot explain the off-equatorial ITCZ edges in our simulations though could be relevant for solsti-tial conditions or other hemispherically asymmetric climate states.
A more complete description of Ekman balance that includes the GCM-simulated wind stress tx,sfc,
but still neglects the meridional gradient of 1/f, sug-gests that the ITCZ edge should scale with the lati-tude where the easterly wind stress maximizes (i.e., where ›tx,sfc/›f 5 0). Estimates of the ITCZ edge
based on where wind stress maximizes are very sim-ilar to those based on the latitude of zero relative vorticity (Fig. 3). This agreement indicates that, at least for the idealized GCM simulations, the sim-plifying assumptions of linear drag and a constant drag coefficient are reasonable when investigating ITCZ width.
Figure 3 demonstrates that the surface wind stress alone cannot fully capture the dynamics of boundary layer ITCZ width. Before considering how other terms in the momentum budget affect ITCZ width (specifi-cally momentum advection), we first explore in more depth the implications of perfect Ekman balance for ITCZ width.
b. An Ekman scaling for ITCZ width
Further insights into the relationship between ITCZ width and wind stress can be obtained by
rearranging the vertically averaged zonal momentum equation, (2), and combining with the continuity equation.2 In particular, assuming Ekman balance {i.e., f[y] 5 2(g/Dp)tx,sfc}, making the small-angle
approximation so thatf52Vsinf’2Vfand cosf’
1 (valid close to the equator), ignoring the meridional gradient of Dp, and noting that vBL(fITCZ) 50 by
definition, we obtain an expression for the ITCZ-edge latitude:
fekmanITCZ 5›ttx,sfc
x,sfc
›f
j
f5fITCZ, (4)
where all quantities on the right-hand side are evaluated at the ITCZ edge. The diagnostic scaling,
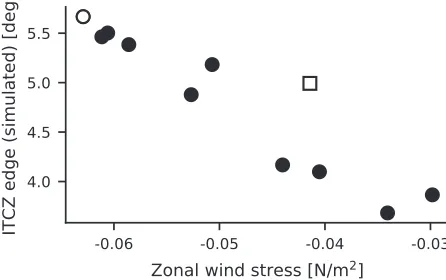
(4), suggests that the latitude of the ITCZ edge (in radians) is directly proportional to the wind stress and inversely proportional to the meridional gradient of the wind stress. The idealized GCM simulations support the prediction from the Ekman scaling, (4), that the ITCZ widens with increas-ing wind stress at the ITCZ edge (Fig. 4).Figures 5
[image:6.567.289.512.66.206.2]and6show estimates of the ITCZ-edge latitude us-ing (4) in the idealized GCM and CMIP5 simula-tions. Clearly, Ekman dynamics as encapsulated in(4)captures some of the behavior of ITCZ width across the idealized (r 50.89) and CMIP5 simula-tions (r 5 0.83) but the estimates depart from the simulated ITCZ edges, particularly for the ide-alized GCM (Fig. 5). This discrepancy hints at the importance of other processes—we investigate these processes in sections 5 and 6. Neverthe-less, the strong correlations in Figs. 5 and 6 high-light a robust link between ITCZ width and Ekman balance.
c. Impact of wind stress perturbations on ITCZ width: Investigations with a toy model
The diagnostic scaling (4) shows how, assuming Ekman balance, the ITCZ-edge latitude relates to the magnitude and gradient of the zonal wind stress. But how doperturbationsin wind stress, for example due to changes in wind speed or surface roughness, impact ITCZ width? To develop intuition for how ITCZ width is controlled by the wind stress, consider an idealized, reference zonal wind stress profile:
tref(f)5ymax3(fDp/g) sin(9f) (Fig. 7a). The
refer-ence wind stress profile is specified to have a sin(9f) shape so thattref50 at 208N, which is roughly
con-sistent with the observed wind stress. The wind stress is defined to be in Ekman balance with a reference boundary layer meridional wind,y(f)5ymaxsin(9f)
(Fig. 7b). We specify ymax 5 23 m s21 and Dp 5
200 hPa. For these reference profiles, the meridional wind maximizes at 108N; the ITCZ-edge latitude is shifted marginally equatorward of this maximum (9.98N) because of the cosf weighting when calcu-lating convergence and vertical velocity (Fig. 7c). The maximum wind stress is on the poleward side of the ITCZ edge at 12.98N (Fig. 7a) as is also the case in the idealized GCM simulations (Fig. 3). The dis-placement between the latitudes of maximum wind stress and ITCZ edge in this toy model is caused by
meridional gradients in the reciprocal of the Coriolis parameter.
We now perturb the reference stress profile in three ways and assess how these perturbations affect the ITCZ width:
1) Add or subtract a constant stress: Adding a con-stant westerly wind stress perturbation of dt 5
0.03 N m22at all latitudes shifts the ITCZ edge pole-ward relative to its reference position by 0.88. Adding a constant easterly wind stress of dt 5 20.03 N m22 shifts the ITCZ edge equatorward by 1.38(Figs. 7a–c). 2) Multiply or divide stress by a constant factor: Mul-tiplying or dividing the wind stress by a constant factor
m52 does not shift the ITCZ edge (Figs. 7d–f), de-spite the imposed changes in stress being substan-tially larger than in the previous case where we added a constant stress.
3) Shift latitude of maximum stress: Manipulating the reference stress profile so as to shift the latitude of maximum stress equatorward and poleward leads to large changes in the ITCZ-edge latitude (Figs. 7g–i). Specifically, shifting the stress maximum equatorward by 28causes an equatorward ITCZ shift of 3.48; shifting the stress maximum poleward by 28shifts the ITCZ edge poleward by 2.68.
The Ekman scaling, (4), we derived above is di-agnostic but can be extended to provide simple expla-nations for the contrasting responses of ITCZ width to the imposed changes in wind stress described above.
FIG. 5. Latitudes of the ITCZ edges in the idealized GCM simulations vs estimates of these latitudes using scalings(4)and
(9). The black circles indicate the full scaling,(9), and the red circles show the estimates assuming Ekman balance,(4), i.e., excluding horizontal and vertical momentum advection. The blue circles show estimates from the full scaling,(9), but including only the time-mean contributions to the advection terms (excluding the transient-eddy contributions). The transient-eddy contribu-tions to momentum advection are estimated using 6-hourly model data. Smoothing is applied to the meridional gradients of the wind stress and advection terms prior to evaluating the scalings. Here and in subsequent figures, the gray line indicates a one-to-one relationship.
First we define a functiong(f)5f(›tx,sfc/›f)2tx,sfc,
which, according to(4), is zero at the ITCZ edge under the assumption of Ekman balance. We are interested in how ITCZ width responds to an arbitrary wind stress perturbation. Using a first-order Taylor expansion of the perturbed functiong(f) [denotedg0(f)] about the ref-erence ITCZ-edge latitude, we can approximate the change infITCZas
dfITCZ’2g
0
›g0 ›f
j
fITCZ, (5)
wherefITCZis the reference ITCZ-edge latitude.
Thus g0(fITCZ) 5 2dt and ›g0/›fjfITCZ5
fITCZ(›2tx,sfc/›f2)jf
ITCZ, resulting in an expression for the change in ITCZ width in response to a constant wind stress perturbation:
dfITCZ’ 1 fITCZ
dt ›2t
x,sfc
›f2
j
fITCZ(6)
fort0x,sfc5tref1dt, wheredtis a constant.
The expression(6)reveals that the ITCZ-edge shift is directly proportional to the perturbation stressdt, and inversely proportional to the curvature of the refer-encetx,sfcprofile. For the wind stress profiles
consid-ered in this toy model (Figs. 7a,d,g), the curvature term is positive in the vicinity of the ITCZ edge (›2tx,sfc/›f2 . 0). Consequently, adding a westerly
stress (e.g., through weakened surface easterlies) widens the ITCZ whereas adding an easterly stress narrows the ITCZ (Fig. 7c). The asymmetry in the magnitudes of ITCZ-width responses to adding a west-erly versus an eastwest-erly stress perturbation (Figs. 7a–c) is not captured by the first-order Taylor expansion used to derive(6), but could be investigated with a higher-order expansion.
We can also use (5) to understand how scaling the wind stress by a constant factor m affects the ITCZ width. For this perturbation it is straightforward to show that changes in the magnitude and meridional gradi-ent of the wind stress cancel each other such that
g0(fITCZ)50. Thus for nonzero curvature intx,sfcthere
is no change in ITCZ width (seeFig. 7f):
dfITCZ50 (7)
fort0x,sfc5mtref.
Perhaps intuitively, shifting the latitude of maxi-mum wind stress toward the equator narrows the ITCZ
[image:9.567.107.516.541.597.2]whereas shifting it poleward widens the ITCZ (Fig. 7g). Simple analytical expressions for changes in ITCZ width due to meridional shifts in the wind stress profile are not as straightforward as for the previous two cases. Nev-ertheless, physical insights can be gained by examining
Fig. 7g. Shifting the wind stress profile equatorward in-creases the stress magnitude at the reference ITCZ-edge latitude (marked by the black dot) and decreases its meridional gradient; both effects contribute to ITCZ narrowing. Similar arguments apply to shifting the wind stress profile poleward. Interestingly, the ITCZ widen-ing is smaller in magnitude than the narrowwiden-ing (2.68 versus 3.48) despite equal prescribed shifts in the latitude of maximum wind stress. This widening versus narrow-ing asymmetry is caused by curvature in the wind stress profile near the ITCZ edge, further highlighting how the meridional shape of the zonal wind stress strongly in-fluences ITCZ width.
5. Boundary layer convergence: Ekman versus non-Ekman processes
Ekman dynamics cannot fully capture the behavior of ITCZ width across all simulations (Fig. 5), implying that additional processes need to be accounted for. By defining ITCZ width as a function of vertical velocity, the influences of Ekman versus non-Ekman processes can be quantified by assessing their respective contri-butions tovBLnear the ITCZ edge. To perform this
decomposition, we first convert the zonal momentum budget,(2), into an equation for boundary layer mass convergence and vertical velocity.
Neglecting the metric term in(2), dividing across by the Coriolis parameter, taking the derivative with re-spect to latitude, combining with the continuity equation and again assumingv50 at the surface, we obtain the following expression for vertical velocity at the bound-ary layer top:
vBL5 2 g
acosf › ›f
t
x,sfc f cosf
|fflfflfflfflfflfflfflfflfflfflfflfflfflfflfflfflfflfflfflfflfflffl{zfflfflfflfflfflfflfflfflfflfflfflfflfflfflfflfflfflfflfflfflfflffl}
vekman
1 Dp
acosf › ›f
cosf
f
v›u ›p
zfflfflfflfflfflfflfflfflfflfflfflfflfflfflfflfflfflfflfflfflfflfflffl}|fflfflfflfflfflfflfflfflfflfflfflfflfflfflfflfflfflfflfflfflfflfflffl{vvert
1 Dp
acosf › ›f
cosf
f
y
a
›u
›f
|fflfflfflfflfflfflfflfflfflfflfflfflfflfflfflfflfflfflfflfflfflfflfflffl{zfflfflfflfflfflfflfflfflfflfflfflfflfflfflfflfflfflfflfflfflfflfflfflffl}
vhoriz
. (8)
The total vertical velocity has been split into three components: A component associated with frictional Ekman convergence (vekman) and components related
to vertical and horizontal advection of relative mo-mentum (vvertandvhoriz, respectively). The components
of vertical velocity in the vicinity of the ITCZ edge are plotted as a function of latitude for the reference
simulation inFig. 8. The sum of the three components is approximately equal to the simulated vertical ve-locity; the small differences are due to the metric and residual terms in the zonal momentum budget being neglected.
budget (Fig. 1b), Ekman balance is insufficient for ac-curately estimating vertical velocity close to and within the ITCZ (Fig. 8). It is therefore clear why the latitude of the ITCZ edge cannot be fully understood through Ekman dynamics alone.
The vertical and horizontal advection terms have a relatively weak influence on the zonal momentum budget near the ITCZ edge (Fig. 2a), but it is the me-ridional gradients of these advection terms that de-termine convergence [see (8)]. The meridional gradients of the advection and frictional terms are comparable at the ITCZ edge, implying that the ad-vection components of the vertical velocity are non-negligible and contribute substantially to low-level convergence and ascent (Fig. 8). Interestingly, the vertical and horizontal advection terms in the zonal momentum budget at the ITCZ edge are strongly correlated with one another across the idealized GCM simulations (r50.99;Fig. 9). The importance of ver-tical advection of momentum between the boundary layer and free troposphere for determining tropical surface winds has been discussed previously (Stevens et al. 2002; Back and Bretherton 2009) so it is not surprising that this process affects ITCZ width. The horizontal advection component of vertical velocity is comparable to the vertical advection component across the idealized GCM simulations (Fig. 10). This horizontal advection term is often neglected in studies of tropical dynamics (e.g., Lindzen and Nigam 1987)
but its role in shaping tropical convergence has been highlighted previously (Holton 1975; Tomas et al. 1999; Gonzalez et al. 2016). Horizontal momentum advection has also been found to be important for determining the location and spatial pattern of sol-stitial convergence zones (Schneider and Bordoni 2008), and its influence increases the farther the ITCZ migrates off the equator (Faulk et al. 2017). There is Ekman-driven descent at the ITCZ edge in the ref-erence simulation (Fig. 8) and across all the idealized GCM simulations (Fig. 10). In the majority of simu-lations the vertical and horizontal advection terms drive convergence and ascent at the ITCZ edge (Figs. 8 and 10) and thus tend to widen the ITCZ relative to a hypothetical boundary layer in perfect Ekman balance. Figure 8 shows that vertical and horizontal momentum advection are crucial for the spatial distribution of convergence and rainfall in the tropics, at least in the idealized GCM—we will return to the influence of these advection processes on ITCZ width in the next section.
Vertical velocity is driven by components associ-ated with meridional gradients in (i) zonal wind stress and momentum advection and (ii) the re-ciprocal of the Coriolis parameter [see(8)]. It is in-teresting to compare these components: Both are large near the ITCZ (cf. the solid and dotted black lines in Fig. 8), indicating that ITCZ width is con-trolled by a delicate balance between the two terms. Meridional structure in the reciprocal of the Coriolis parameter is of zeroth-order importance for ITCZ width; the strong gradient in this function close to the equator drives descent and therefore acts to narrow the ITCZ (Fig. 8). The influence of the Coriolis parameter on boundary layer convergence decays rapidly (;1/tanf) moving poleward away from the ITCZ.
FIG. 9. Horizontal vs vertical momentum advection terms in the zonal momentum budget,(2), evaluated at the ITCZ edge for each idealized GCM simulation.
FIG. 8. Vertical velocity at the top of the boundary layer (s5
0.8) for the reference simulation (solid black line). Also shown are the Ekman (red line), vertical advection (blue line), and horizontal- advection (magenta line) components of the vertical velocity as defined by(8), along with their sum (dashed–dotted black line). The dotted black line shows an estimate of vertical velocity for which meridional gradients in the reciprocal of the Coriolis parameter have been neglected. The vertical dashed black line indicates the ITCZ edge. Note that the hatched region close to the equator does not show the estimated vertical ve-locity components; at these latitudes the 1/f;1/fdependence causes each component to rapidly increase in magnitude as
6. Scaling for ITCZ width based on the full momentum budget
The magnitude and pattern of zonal wind stress, via its influence on frictional Ekman convergence, is a strong constraint on ITCZ width (Figs. 4–7). However, in the previous section we demonstrated that in the idealized GCM ITCZ width is controlled by convergence driven by wind stress and horizontal/vertical advection of mo-mentum. Below we introduce an additional dynamical scaling to quantitatively investigate these competing physical controls on ITCZ width.
It is difficult to cleanly assess the roles of Ekman versus non-Ekman processes in determining the ITCZ width by examining the components of vertical velocity
(8). This is because the Ekman component does not pass through zero close to the equator in the idealized GCM because of its 1/fdependence, and so an ‘‘Ekman-only ITCZ width’’ is not defined. [Note that the Ekman scaling, (4), bypasses this issue by estimating ITCZ width using the zonal wind stress alone, which is a well-behaved function of latitude.] To quantitatively compare the effects of Ekman versus non-Ekman pro-cesses on ITCZ width, we instead derive an extended version of the analytical scaling,(4), for the ITCZ-edge latitude that includes horizontal and vertical advection of momentum:
ffullITCZ5
2(g/Dp)tx,sfc1 v›u ›p
1 y
a
›u
›f
2(g/Dp)›tx,sfc
›f 1 › ›f v
›u
›p
1 ›
›f y
a
›u
›f
j
f5fITCZ ,
(9)
where all quantities on the right-hand side are evaluated at the ITCZ edge. The ‘‘full’’ dynamical scaling, (9), captures the ITCZ-edge latitude across the wide range
of idealized GCM simulations with a correlation coef-ficient ofr50.97 (Fig. 5), and does reasonably well at capturing the behavior in more complex CMIP5 simu-lations (r50.81;Fig. 6). Comparing the black and red circles inFig. 5, we find that neglecting the momentum advection terms in the idealized GCM simulations leads to errors in estimating the ITCZ-edge latitude that are substantial relative to the ITCZ width itself. This sug-gests that momentum advection must be accounted for in any quantitative theory of ITCZ width. However, the CMIP5 simulations show only a weak effect of mo-mentum advection on ITCZ width (Fig. 6); additional work is needed to assess the importance of these ad-vective processes in more comprehensive models and in observations. The role of momentum transport by transient eddies in controlling ITCZ width is illustrated by comparing the blue and black circles inFig. 5. Ne-glecting vertical and horizontal momentum advection by transient eddies gives roughly constant errors of order 18in estimates of the ITCZ-edge latitude, im-plying that eddies affect the climatological ITCZ width but not necessarily how the width scales with temper-ature. The nonnegligible influence of transient eddies on ITCZ width is consistent withByrne and Schneider (2016a,b) who found, using an energetic framework, that transient eddies are important for controlling ITCZ width.
7. Relationships between ITCZ width and surface temperature, moist entropy
Up to this point we have studied ITCZ width in terms of dynamical quantities, specifically wind stress and momentum advection. It is also useful (and somewhat traditional in the field of tropical atmospheric dy-namics; Sobel 2007) to construct theories connecting the circulation to surface thermodynamic quantities such as SST. Below we propose two such theories for ITCZ width based on boundary layer Ekman balance.
a. Lindzen–Nigam theory
Lindzen and Nigam (1987)argued that tropical sur-face winds and convergence are closely controlled by the SST distribution via its influence on boundary layer pressure gradients. To make the problem more tracta-ble and link surface winds directly to SST, Lindzen and Nigam (1987)neglected horizontal and vertical mo-mentum advection and assumed that pressure gradients vanish above the boundary layer. Despite the validity of these assumptions being challenged (e.g.,Battisti et al. 1999), observations suggest that surface convergence in the tropics is largely driven by pressure gradients within (rather than above) the boundary layer (Back and FIG. 10. Components of vertical velocity at the top of the
Bretherton 2009). This is a strong indication that SST gradients are dynamically tied to ITCZ width.
To make our discussion of the link between ITCZ width and SST more concrete, consider simplified forms of the zonal and meridional momentum equations in Ekman balance followingLindzen and Nigam (1987):3
f[y]5C[u] , (10)
f[u]5 2
1
ra
›p
›f
2C[y] . (11)
In(10)and(11)we have assumed for simplicity that the drag coefficientCis the same for zonal and meridional winds, and have formulated the frictional force in terms of the boundary layer average winds. Combining the zonal and meridional momentum equations we obtain an expression for the meridional wind:
[y]5 2 C
f21C2
1
ra
›p
›f
. (12)
Ignoring pressure gradients above the boundary layer (which are typically taken to be small in the tropical free troposphere) and assuming that the boundary layer temperature is tightly coupled to SST via turbulent surface heat fluxes, from(12)and the ideal gas law we expect the meridional wind to be proportional to the meridional SST gradient: [y]} ›SST/›f. Neglecting gradients inC/(f21C2), it follows that the low-level convergence and vertical velocity at the top of the boundary layer are proportional to the Laplacian (or curvature) of SST:
vBL}›
2SST
›f2 . (13)
If the relationship(13)holds, it suggests that the ITCZ-edge latitude should scale with the latitude where the Laplacian of SST is zero. Separate studies have recently highlighted the importance of the Laplacian of SST for seasonal migrations of the ITCZ position (Wei and Bordoni 2018) and for projected changes in tropical precipitation (Duffy et al. 2019, manuscript submitted to
J. Climate).
In the idealized GCM simulations, there is reasonable agreement between the simulated ITCZ-edge latitudes and the latitudes where›2SST/›f250 (Fig. 11a), with
a correlation coefficient of r 5 0.85. The ITCZ-edge estimates from this adapted Lindzen–Nigam theory do not lie on the one-to-one line, and there are several reasons for this. Most importantly we have assumed Ekman balance, which, as discussed, cannot fully cap-ture ITCZ width across the simulations. We have also assumed zero horizontal pressure gradients above the boundary layer and ignored vertical momentum trans-port, though these assumptions are not generally valid (Back and Bretherton 2009). Finally, we have neglected meridional gradients in the drag coefficient and Coriolis parameter. Nevertheless, the prediction from Lindzen– Nigam theory that the ITCZ-edge latitude should scale with the latitude where the Laplacian of SST is zero is found to approximately hold in idealized GCM simulations and provides a simple framework for understanding ITCZ-width changes in response to changing SST patterns.
b. Emanuel (1995)theory
A complementary but distinct relationship between ITCZ width and surface thermodynamics can be de-rived followingEmanuel (1995). Emanuel considered the transition between an atmosphere in radiative– convective equilibrium (RCE) and an atmosphere
FIG. 11. ITCZ-edge latitudes in the idealized GCM simulations vs estimates based on the latitudes closest to the equator where (a) the Laplacian of SST is zero and (b) the Laplacian of the de-parture of the simulated surface moist entropy distribution from the critical distribution is zero. See(13)and(15)for details. The correlation coefficients are (a)r50.85 and (b)r50.18. The cor-relation coefficient for (b) increases tor50.77 when the outlier (the coldest simulation) is excluded.
3Note thatLindzen and Nigam (1987)presented their
[image:12.567.289.512.59.298.2]with a thermally direct overturning circulation. Start-ing with the assumption that a RCE state is not sus-tainable if the product of the Coriolis parameter and absolute vorticity at the tropopause is negative (fh,0),4Emanuel found that a sufficient condition for the RCE state to breakdown and a circulation to emerge is for the meridional gradient in subcloud moist entropy to exceed a critical threshold. Beyond this criti-cal threshold, thermal wind becomes inconsistent with Hide’s theorem (Hide 1969) and a circulation spins up so as to reduce the meridional moist entropy gradient. As-suming active convection and moist adiabatic lapse rates, Emanuel derived an expression for this critical moist entropy gradient and further argued that tropical surface winds can be estimated by the degree to which the actual moist entropy distribution departs from the critical gra-dient.Shaw and Voigt (2016)applied this theory to un-derstand shifts in the Hadley circulation and storm tracks under climate change, but it has not been applied to ITCZ width to our knowledge.
TheEmanuel (1995)estimate for the balanced surface zonal wind is
usfc5SST2Tt
fa
›
›f(s2scrit) , (14)
whereTtis the tropopause temperature (which we take to be the temperature at thes50.22 level),s5cplogue is the boundary layer moist entropy,ueis the boundary layer equivalent potential temperature and scrit is the
critical moist entropy distribution [see (7) ofShaw and Voigt (2016)]. Assuming Ekman balance, that tx,sfc } usfcandusfc}[u], and neglecting meridional gradients
in SST2Ttand the Coriolis parameter, we find
vBL} ›
2
›f2(s2scrit) . (15)
Expressed in words,(15)suggests that the ITCZ width scales with the latitude where the Laplacian of the de-parture of moist entropy from its critical distribution is zero. This scaling holds to some extent in the idealized GCM simulations when an outlier (the coldest simu-lation) is excluded (Fig. 11b), suggesting that ITCZ width is dynamically coupled to surface temperature and specific humidity via atmospheric convection and angular-momentum constraints. As for the adapted
Lindzen–Nigam theory, deviations of the ITCZ-edge estimates in Fig. 11b from the one-to-one line are due to a variety of assumptions made in deriving(15). In particular, meridional gradients in SST 2 Tt are not expected to be negligible in the ITCZ and the as-sumption of moist adiabatic lapse rates is not generally valid, even in the deep tropics (Byrne and O’Gorman 2013b). Assessing which of these assumptions are most critical for ITCZ width is a topic for future research.
8. Summary
The dynamical processes controlling ITCZ width have been investigated using idealized simulations together with the boundary layer zonal momentum budget and various scalings. A key result of this study is that Ekman processes place a strong constraint on ITCZ width: The boundary layer is approximately in Ekman balance (Fig. 2a) and the Ekman component of vertical velocity is large at the ITCZ edge (Fig. 8). Scalings for ITCZ width based on Ekman dynamics are useful for under-standing the behavior of ITCZ width across simulations (Figs. 3–7). In particular, ITCZ width defined in terms of the midtropospheric streamfunction scales with the lat-itude where the surface relative vorticity is zero and the latitude where the meridional gradient in zonal wind stress is zero (Fig. 3). However, the boundary layer definition of ITCZ width does not scale with either the latitude of zero relative vorticity or with definitions of ITCZ width based on the midtropospheric streamfunction and precipitation minus evaporation. Understanding why different measures of ITCZ width respond differently to increasing temperature is a topic for future work.
Although the ITCZ edge scales with the latitude where the wind stress maximizes, the ITCZ edge ro-bustly lies equatorward of the stress maximum due to meridional variations in the Coriolis parameter (Fig. 3). An analytical Ekman scaling for the ITCZ-edge latitude,(4), suggests that ITCZ width is directly proportional to the magnitude of the wind stress and inversely proportional to its meridional gradient. The link between wind stress magnitude and ITCZ width is also found in the idealized GCM simulations (Fig. 4). The strong control of Ekman dynamics on ITCZ width is examined in more detail using a toy model of the atmospheric boundary layer (Fig. 7). The ITCZ-width responses to simple wind stress perturbations reveal nonintuitive behavior: Adding a constant westerly (easterly) wind stress widens (narrows) the ITCZ (Figs. 7a–c). The size of the change in ITCZ width depends not only on the magnitude of the stress per-turbation but also on the curvature of the reference stress profile. Multiplying a reference wind stress 4We recall from section 4 that Tomas and Webster (1997),
using a theory based on the dynamically equilibrated surface ab-solute vorticity field [and therefore distinct fromEmanuel (1995)], argued that the ITCZ is bounded by the contour along which
profile by a constant factor does not shift the ITCZ edge (Figs. 7d–f) but changes in the latitude at which the wind stress maximizes lead to large shifts in the ITCZ edge (Figs. 7g–i). Given that the angular mo-mentum imparted by the surface to the atmosphere in the tropics is transported poleward and ultimately re-turned to the solid Earth by the midlatitude surface westerlies (e.g.,Held 2000), it is clear that the dynamics of ITCZ width are connected to atmospheric circula-tions at higher latitudes (Watt-Meyer and Frierson 2019) and the problem is therefore inherently nonlocal. Although Ekman processes are the primary influence on ITCZ width, a scaling that includes horizontal and vertical momentum advection [see (9)] is needed to quantitatively capture ITCZ width across the full range of idealized GCM simulations (Fig. 5). The magnitudes of the advection terms in the zonal momentum budget are small (Fig. 2) but it is the meridional gradients of these terms that control vertical velocity and ITCZ width, and advection contributes substantially to verti-cal velocity at the ITCZ edge (Fig. 8). Therefore a full, prognostic theory for ITCZ width in the idealized GCM simulations requires not only a prediction for wind stress changes but also for changes in horizontal and vertical momentum advection (though helpfully these advection terms are strongly correlated; Fig. 9). In the more comprehensive CMIP5 simulations, ITCZ width is only weakly controlled by momentum advection (Fig. 6) raising the possibility of a more dominant influence of Ekman processes on ITCZ width than suggested by the idealized GCM simulations. Additional research is re-quired to assess the relative influences of Ekman pro-cesses versus momentum advection on ITCZ width in more realistic GCMs and in the observed atmosphere.
Because of the fast time scales of atmospheric pro-cesses relative to the slow time scales on which SST evolves, there has been a long-standing interest in de-veloping theories for tropical circulation and pre-cipitation given the SST distribution (e.g.,Sobel 2007). Extending theLindzen and Nigam (1987)theory, which itself is based on the assumption of Ekman balance, we find that ITCZ width scales with the latitude at which the Laplacian of SST is zero (Fig. 11). This powerful result connects ITCZ width to a well-observed and fundamental physical feature of the climate system (SST) and provides a simple dynamical framework with which to understand the responses of ITCZ width to SST variability, for example, between phases of El Niño–Southern Oscillation (Dias and Pauluis 2011) and under global warming (e.g., Byrne and Schneider 2016b). An alternative model of the tropical circulation (Emanuel 1995) suggests that ITCZ width scales with the latitude where the Laplacian of the departure of
boundary layer moist entropy from a critical distribution is zero. Our extensions to theLindzen and Nigam (1987)
and Emanuel (1995) theories have some skill in cap-turing the behavior of ITCZ width across the idealized GCM simulations.
The analyses and scalings presented here establish a dynamical framework with which to understand the processes determining ITCZ width. This dynamical framework complements recent efforts to understand ITCZ width based on the atmospheric energy budget (Chou et al. 2009;Byrne and Schneider 2016a;Harrop and Hartmann 2016;Dixit et al. 2018) and has the po-tential to be more informative and predictive, given that surface convergence and the ITCZ are thought to be driven predominantly by boundary layer pressure gra-dients and dynamics rather than by thermodynamic effects higher in the atmosphere (Lindzen and Nigam 1987; Sobel and Neelin 2006; Back and Bretherton 2009). Ultimately, however, the tropical circulation obeys both momentum balance and energy balance. The challenge for future theoretical work on ITCZ width will be to combine dynamical and energetic perspectives into a unified theory, perhaps through the use of a quasi-equilibrium framework following
Sobel and Neelin (2006). In conclusion, our investiga-tions into the dynamics of ITCZ width have advanced fundamental understanding of the atmospheric circula-tion and are likely to be useful for examining ITCZ biases in more complex climate models, differences in ITCZ width over land versus ocean regions, and the past and future evolution of tropical rainfall.
Acknowledgments.This project has received funding from the EU’s Horizon 2020 Research and Innovation Programme under the Marie Skłodowska-Curie Grant Agreement 794063. We also acknowledge support from the Imperial College London Research Fellow-ship Scheme and useful discussions with Arnaud Czaja, David Battisti, Kerry Emanuel, and Marty Singh. We appreciate constructive comments from Spencer Hill and two anonymous reviewers that improved the man-uscript. This work used JASMIN, the U.K. collaborative data analysis facility.
REFERENCES
Back, L. E., and C. S. Bretherton, 2009: On the relationship be-tween SST gradients, boundary layer winds, and convergence over the tropical oceans.J. Climate, 22, 4182–4196,https:// doi.org/10.1175/2009JCLI2392.1.
Bischoff, T., and T. Schneider, 2014: Energetic constraints on the position of the intertropical convergence zone.
J. Climate,27, 4937–4951, https://doi.org/10.1175/JCLI-D-13-00650.1.
Bretherton, C. S., and A. H. Sobel, 2002: A simple model of a convectively coupled Walker circulation using the weak tem-perature gradient approximation.J. Climate,15, 2907–2920,
https://doi.org/10.1175/1520-0442(2002)015,2907:ASMOAC. 2.0.CO;2.
Broccoli, A. J., K. A. Dahl, and R. J. Stouffer, 2006: Response of the ITCZ to Northern Hemisphere cooling.Geophys. Res. Lett.,33, L01702,https://doi.org/10.1029/2005GL024546. Byrne, M. P., and P. A. O’Gorman, 2013a: Land–ocean warming
contrast over a wide range of climates: Convective quasi-equilibrium theory and idealized simulations.J. Climate,26, 4000–4016,https://doi.org/10.1175/JCLI-D-12-00262.1. ——, and ——, 2013b: Link between land–ocean warming contrast
and surface relative humidities in simulations with coupled climate models.Geophys. Res. Lett.,40, 5223–5227,https:// doi.org/10.1002/grl.50971.
——, and T. Schneider, 2016a: Energetic constraints on the width of the intertropical convergence zone.J. Climate,29, 4709– 4721,https://doi.org/10.1175/JCLI-D-15-0767.1.
——, and ——, 2016b: Narrowing of the ITCZ in a warming cli-mate: Physical mechanisms.Geophys. Res. Lett.,43, 11 350– 11 357,https://doi.org/10.1002/2016GL070396.
——, and ——, 2018: Atmospheric dynamics feedback: Concept, simulations, and climate implications.J. Climate, 31, 3249– 3264,https://doi.org/10.1175/JCLI-D-17-0470.1.
——, A. G. Pendergrass, A. D. Rapp, and K. R. Wodzicki, 2018: Response of the intertropical convergence zone to climate change: Location, width, and strength.Curr. Climate Change Rep.,4, 355–370,https://doi.org/10.1007/s40641-018-0110-5. Chiang, J. C. H., and A. R. Friedman, 2012: Extratropical
cooling, interhemispheric thermal gradients, and tropical climate change.Annu. Rev. Earth Planet. Sci.,40, 383–412,
https://doi.org/10.1146/annurev-earth-042711-105545. Chou, C., and J. D. Neelin, 2004: Mechanisms of global warming
impacts on regional tropical precipitation. J. Climate, 17, 2688–2701,https://doi.org/10.1175/1520-0442(2004)017,2688: MOGWIO.2.0.CO;2.
——, ——, C.-A. Chen, and J.-Y. Tu, 2009: Evaluating the ‘‘rich-get-richer’’ mechanism in tropical precipitation change under global warming.J. Climate, 22, 1982–2005,
https://doi.org/10.1175/2008JCLI2471.1.
Dias, J., and O. Pauluis, 2011: Modulations of the phase speed of convectively coupled Kelvin waves by the ITCZ.J. Atmos. Sci.,68, 1446–1459,https://doi.org/10.1175/2011JAS3630.1. Dixit, V., O. Geoffroy, and S. C. Sherwood, 2018: Control of ITCZ
width by low-level radiative heating from upper-level clouds in aquaplanet simulations.Geophys. Res. Lett.,45, 5788–5797,
https://doi.org/10.1029/2018GL078292.
Donohoe, A., and A. Voigt, 2017: Why future shifts in tropical precipitation will likely be small: The location of the tropical rain belt and the hemispheric contrast of energy input to the atmosphere.Climate Extremes: Patterns and Mechanisms, Vol. 226, Amer. Geophys. Union, 115–137,https://doi.org/10.1002/ 9781119068020.ch8.
——, J. Marshall, D. Ferreira, and D. McGee, 2013: The relation-ship between ITCZ location and cross-equatorial atmospheric heat transport: From the seasonal cycle to the Last Glacial Maximum.J. Climate,26, 3597–3618,https://doi.org/10.1175/ JCLI-D-12-00467.1.
Emanuel, K. A., 1995: On thermally direct circulations in moist atmospheres. J. Atmos. Sci.,52, 1529–1536, https://doi.org/ 10.1175/1520-0469(1995)052,1529:OTDCIM.2.0.CO;2. ——, 2019: Inferences from simple models of slow, convectively
coupled processes.J. Atmos. Sci.,76, 195–208,https://doi.org/ 10.1175/JAS-D-18-0090.1.
Faulk, S., J. Mitchell, and S. Bordoni, 2017: Effects of rotation rate and seasonal forcing on the ITCZ extent in planetary atmo-spheres.J. Atmos. Sci.,74, 665–678, https://doi.org/10.1175/ JAS-D-16-0014.1.
Frierson, D. M. W., 2007: The dynamics of idealized convection schemes and their effect on the zonally averaged tropical cir-culation.J. Atmos. Sci.,64, 1959–1976,https://doi.org/10.1175/ JAS3935.1.
——, I. M. Held, and P. Zurita-Gotor, 2006: A gray-radiation aquaplanet moist GCM. Part I: Static stability and eddy scale.J. Atmos. Sci.,63, 2548–2566,https://doi.org/10.1175/ JAS3753.1.
——, and Coauthors, 2013: Contribution of ocean overturning circulation to tropical rainfall peak in the Northern Hemi-sphere. Nat. Geosci., 6, 940–944, https://doi.org/10.1038/ ngeo1987.
Gonzalez, A. O., C. J. Slocum, R. K. Taft, and W. H. Schubert, 2016: Dynamics of the ITCZ boundary layer.J. Atmos. Sci., 73, 1577–1592,https://doi.org/10.1175/JAS-D-15-0298.1. Harrop, B. E., and D. L. Hartmann, 2016: The role of cloud
radi-ative heating in determining the location of the ITCZ in aquaplanet simulations. J. Climate, 29, 2741–2763, https:// doi.org/10.1175/JCLI-D-15-0521.1.
Held, I. M., 2000: The general circulation of the atmosphere. Woods Hole Oceanographic Institution Fellows Project Rep. WHOI-2001-03, 54 pp.
——, 2001: The partitioning of the poleward energy transport be-tween the tropical ocean and atmosphere.J. Atmos. Sci.,58, 943–948,https://doi.org/10.1175/1520-0469(2001)058,0943: TPOTPE.2.0.CO;2.
——, and A. Y. Hou, 1980: Nonlinear axially symmetric circu-lations in a nearly inviscid atmosphere.J. Atmos. Sci.,37, 515–533,https://doi.org/10.1175/1520-0469(1980)037,0515: NASCIA.2.0.CO;2.
Hide, R., 1969: Dynamics of the atmospheres of the major planets with an appendix on the viscous boundary layer at the rigid bounding surface of an electrically-conducting rotating fluid in the presence of a magnetic field.J. Atmos. Sci.,26, 841–853,
https://doi.org/10.1175/1520-0469(1969)026,0841:DOTAOT. 2.0.CO;2.
Holton, J. R., 1975: On the influence of boundary layer friction on mixed Rossby-gravity waves.Tellus,27, 107–115,https:// doi.org/10.3402/tellusa.v27i2.9893.
Kang, S. M., I. M. Held, D. M. W. Frierson, and M. Zhao, 2008: The response of the ITCZ to extratropical thermal forcing: Ideal-ized slab-ocean experiments with a GCM.J. Climate,21, 3521– 3532,https://doi.org/10.1175/2007JCLI2146.1.
——, Y. Shin, and S.-P. Xie, 2018: Extratropical forcing and trop-ical rainfall distribution: Energetics framework and ocean Ekman advection.npj Climate Atmos. Sci.,1, 20172,https:// doi.org/10.1038/s41612-017-0004-6.
Lindzen, R. S., and S. Nigam, 1987: On the role of sea surface tem-perature gradients in forcing low-level winds and convergence in the tropics. J. Atmos. Sci., 44, 2418–2436, https://doi.org/ 10.1175/1520-0469(1987)044,2418:OTROSS.2.0.CO;2. O’Gorman, P. A., and T. Schneider, 2008a: Energy of
climates. J. Climate, 21, 3815–3832, https://doi.org/10.1175/ 2007JCLI2065.1.
——, and ——, 2008b: The hydrological cycle over a wide range of climates simulated with an idealized GCM. J. Climate,21, 5797–5806,https://doi.org/10.1175/2008JCLI2099.1.
Peixóto, J. P., and A. H. Oort, 1984: Physics of climate.Rev. Mod. Phys.,56, 365,https://doi.org/10.1103/RevModPhys.56.365. Philander, S. G. H., D. Gu, G. Lambert, T. Li, D. Halpern, N. C.
Lau, and R. C. Pacanowski, 1996: Why the ITCZ is mostly north of the equator.J. Climate,9, 2958–2972,https://doi.org/ 10.1175/1520-0442(1996)009,2958:WTIIMN.2.0.CO;2. Popp, M., and L. G. Silvers, 2017: Double and single ITCZs with
and without clouds.J. Climate,30, 9147–9166,https://doi.org/ 10.1175/JCLI-D-17-0062.1.
Schneider, T., and S. Bordoni, 2008: Eddy-mediated regime tran-sitions in the seasonal cycle of a Hadley circulation and im-plications for monsoon dynamics.J. Atmos. Sci.,65, 915–934,
https://doi.org/10.1175/2007JAS2415.1.
——, T. Bischoff, and G. H. Haug, 2014: Migrations and dynamics of the intertropical convergence zone. Nature, 513, 45–53,
https://doi.org/10.1038/nature13636.
Shaw, T. A., and A. Voigt, 2016: What can moist thermody-namics tell us about circulation shifts in response to uniform warming?Geophys. Res. Lett.,43, 4566–4575,https://doi.org/ 10.1002/2016GL068712.
Sobel, A. H., 2003: On the coexistence of an evaporation minimum and precipitation maximum in the warm pool.J. Climate,16, 1003–1009,https://doi.org/10.1175/1520-0442(2003)016,1003: OTCOAE.2.0.CO;2.
——, 2007: Simple models of ensemble-averaged precipitation and surface wind, given the sea surface temperature.The Global Circulation of the Atmosphere, T. Schneider and A. H. Sobel, Eds., Princeton University Press, 219–251.
——, and J. D. Neelin, 2006: The boundary layer contribution to intertropical convergence zones in the quasi-equilibrium tropical circulation model framework.Theor. Comput. Fluid Dyn.,20, 323–350,https://doi.org/10.1007/s00162-006-0033-y.
Stevens, B., J. Duan, J. C. McWilliams, M. Münnich, and J. D. Neelin, 2002: Entrainment, Rayleigh friction, and boundary layer winds over the tropical Pacific.J. Climate,15, 30–44,https://doi.org/ 10.1175/1520-0442(2002)015,0030:ERFABL.2.0.CO;2. Su, H., and Coauthors, 2017: Tightening of tropical ascent and high
clouds key to precipitation change in a warmer climate.Nat. Commun.,8, 15771,https://doi.org/10.1038/ncomms15771. Taylor, K. E., R. J. Stouffer, and G. A. Meehl, 2012: An overview of
CMIP5 and the experiment design.Bull. Amer. Meteor. Soc., 93, 485–498,https://doi.org/10.1175/BAMS-D-11-00094.1. Tomas, R. A., and P. J. Webster, 1997: The role of inertial
instability in determining the location and strength of near-equatorial convection.Quart. J. Roy. Meteor. Soc.,123, 1445– 1482,https://doi.org/10.1002/qj.49712354202.
——, J. R. Holton, and P. J. Webster, 1999: The influence of cross-equatorial pressure gradients on the location of near-equatorial convection. Quart. J. Roy. Meteor. Soc., 125, 1107–1127,https://doi.org/10.1002/qj.1999.49712555603. Waliser, D. E., and C. Gautier, 1993: A satellite-derived
climatol-ogy of the ITCZ.J. Climate, 6, 2162–2174,https://doi.org/ 10.1175/1520-0442(1993)006,2162:ASDCOT.2.0.CO;2. ——, and R. C. J. Somerville, 1994: Preferred latitudes of the
in-tertropical convergence zone.J. Atmos. Sci.,51, 1619–1639,
https://doi.org/10.1175/1520-0469(1994)051,1619:PLOTIC. 2.0.CO;2.
Watt-Meyer, O., and D. M. W. Frierson, 2019: ITCZ width con-trols on Hadley cell extent and eddy-driven jet position, and their response to warming.J. Climate,32, 1151–1166,https:// doi.org/10.1175/JCLI-D-18-0434.1.
Wei, H.-H., and S. Bordoni, 2018: Energetic constraints on the ITCZ position in idealized simulations with a seasonal cycle.
J. Adv. Model. Earth Syst., 10, 1708–1725, https://doi.org/ 10.1029/2018MS001313.