University of Warwick institutional repository: http://go.warwick.ac.uk/wrap
This paper is made available online in accordance with
publisher policies. Please scroll down to view the document
itself. Please refer to the repository record for this item and our
policy information available from the repository home page for
further information.
To see the final version of this paper please visit the publisher’s website.
Access to the published version may require a subscription.
Author(s): Edward M. Smith, Jack Littrell and Michael Olivier
Article Title: Automated SNP Genotype Clustering Algorithm to
Improve Data Completeness in High-Throughput SNP Genotyping
Datasets from Custom Arrays
Year of publication: 2008
Link to published article:
http://dx.doi.org/10.1016/S1672-0229(08)60014-5
Automated SNP Genotype Clustering Algorithm to Improve Data
Completeness in High-Throughput SNP Genotyping Datasets
from Custom Arrays
Edward M. Smith, Jack Littrell, and Michael Olivier*
Human and Molecular Genetics Center, Medical College of Wisconsin, Milwaukee, WI 53226, USA.
Abstract
High-throughput SNP genotyping platforms use automated genotype calling algorithms to assign genotypes. While these algorithms work efficiently for individual platforms, they are not compatible with other platforms, and have individual biases that result in missed genotype calls. Here we present data on the use of a second complementary SNP genotype clustering algorithm. The algorithm was originally designed for individual fluorescent SNP genotyping assays, and has been optimized to permit the clustering of large datasets generated from custom-designed Affymetrix SNP panels. In an analysis of data from a 3K array genotyped on 1,560 samples, the additional analysis increased the overall number of genotypes by over 45,000, significantly improving the completeness of the experimental data. This analysis suggests that the use of multiple genotype calling algorithms may be advisable in high-throughput SNP genotyping experiments. The software is written in Perl and is available from the corresponding author.
Keywords
clustering; SNP genotyping; algorithm
Introduction
Single nucleotide polymorphisms (SNPs) are the most common form of genetic variation in the human genome, and are the marker of choice for disease association studies due to their prevalence and ease of genotyping. Large-scale SNP genotyping arrays are improving the speed and volume of genomic research. Whilst these techniques are highly accurate and efficient, there remains a desire to maximize the amount of data obtained.
In recent years, a number of reports have described algorithms that can be used to replace or supplement Affymetrix genotype calling algorithms (1-6). However, these algorithms are all designed to be used with data generated from genome-wide SNP arrays, and are not compatible with other genotyping platforms or formats. As specific chromosomal regions are identified as being linked to a phenotype of interest, there is an increasing need to target high-density
*Corresponding author. E-mail: [email protected]. Authors’ contributions
EMS supervised and coordinated the collection of the datasets, conducted data analysis, and prepared the manuscript. JL contributed to the data analysis and data management, and was responsible for modifying the code of the cluster algorithm. MO conceived the idea of using this approach, critically reviewed the data analysis, and assisted with manuscript preparation. All authors read and approved the
NIH Public Access
Author Manuscript
Genomics Proteomics Bioinformatics. Author manuscript; available in PMC 2009 September 20.
Published in final edited form as:
Genomics Proteomics Bioinformatics. 2007 December ; 5(3-4): 256–259. doi:10.1016/S1672-0229(08)
60014-5.
NIH-PA Author Manuscript
NIH-PA Author Manuscript
genotyping to these loci. The Affymetrix custom-designed SNP panels based on molecular inversion probe technology (7,8) allow for such an approach. One major difference in the output from this assay is that there is only one chip feature per SNP rather than multiple averaged sites as generated with the genome-wide arrays. Thus, it is difficult to assess the accuracy and reliability of genotype calls from the analysis software without additional experimental work, and some SNPs result in poor call rates in the automated analysis although manual inspection of the data suggests clear distinction of three different genotype clusters. For custom high-resolution SNP genotyping, data completeness is essential, and a high percentage of missed calls for an individual SNP or the complete lack of data for any SNP significantly impedes the subsequent analysis.
To overcome this challenge in the automated data analysis and to improve overall data quality, an in-house clustering algorithm designed for analysis of single SNP assays was modified to analyze the data from genotyping 1,560 individuals of 261 families on an Affymetrix GeneChip custom 3K array. As shown below, the combined analysis using both the commercial algorithm and the custom supplementary clustering algorithm (MCW_CA) significantly improves the overall call rate, and “rescues” individual SNPs eliminated in the initial analysis using the commercial algorithm alone.
Results and Discussion
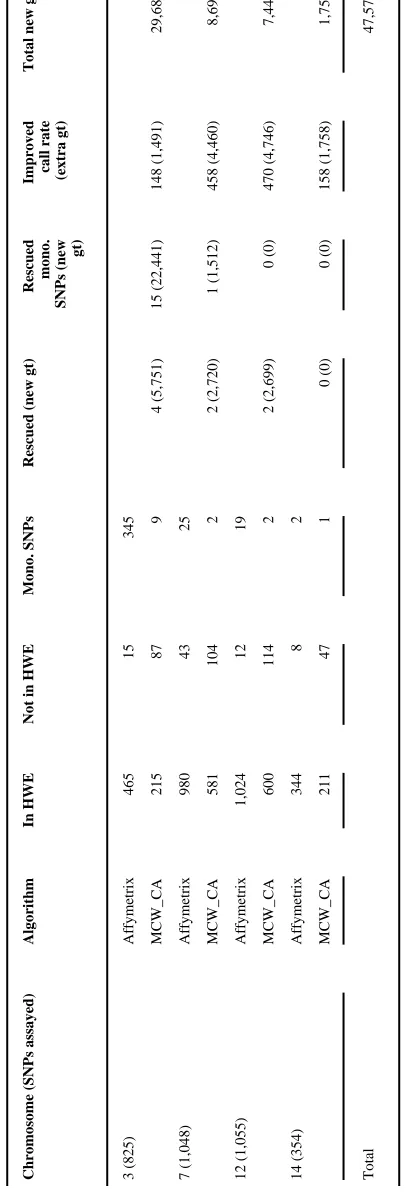
In total, 3,345 SNPs were genotyped using 1,560 samples from the MRC-OB cohort using an Affymetrix GeneChip custom 3K array. Initially, data were analyzed using the commercial analysis tools provided by Affymetrix. In this analysis, 99.6% of all SNPs successfully passed the quality control criteria. However, our subsequent analysis revealed that not all passed SNPs were informative. Based on the Affymetrix genotype calls, 41.8% (345/825) of SNPs assayed on Chromosome 3 were identified as monomorphic following determination of allele frequencies (Table 1), supporting the anecdotal evidence that SNP failures are due to under-calling of heterozygotes. This percentage was significantly reduced to 1.1% (9/825) when based on the MCW_CA results, and it was possible to rescue 15 SNPs previously identified as monomorphic. Based on this analysis, the genotype distribution was in Hardy-Weinberg equilibrium (HWE), and greater than 80% of the cohort were successfully genotyped. Further four SNPs on Chromosome 3, which were identified as polymorphic by the Affymetrix genotype calling algorithm but not in HWE, were also rescued (passed HWE and greater than 80% genotyped) by MCW_CA (Table 1). In addition, of the 250 SNPs that passed both forms of analysis, it was possible to improve the call rate of 148 (59.2%) SNPs using MCW_CA. This supplementary analysis resulted in a total of 29,683 additional genotypes identified on Chromosome 3.
Corresponding values for the remaining chromosomal regions investigated are presented in Table 1. Similar to the analysis described for Chromosome 3, it was possible for MCW_CA to rescue further five SNPs and increase the call rates for another 1,086 SNPs. In total it resulted in an extra 47,578 genotypes identified, an average of 30 genotypes per individual tested. This number of genotypes would correspond to an additional 15 SNP arrays worth of data.
Overall, our analysis strongly suggests that it is highly beneficial to re-analyze high-throughput SNP genotyping data with more than one genotype calling algorithm. A significant number of additional genotype calls can be made, and more complete data are obtained, a result essential for fine-mapping studies. While several algorithms have been developed to help in the analysis of genome-wide 100K and 500K SNP arrays, our algorithm is also suitable for use with custom 3K, 5K, or 10K arrays. Furthermore, a significant advantage of MCW_CA over other clustering algorithms is the ability to set a user-defined confidence threshold. This allows users to select their own cut-off value depending on individual requirements. Altering the threshold level will
Smith et al. Page 2
Genomics Proteomics Bioinformatics. Author manuscript; available in PMC 2009 September 20.
NIH-PA Author Manuscript
NIH-PA Author Manuscript
have an effect on both the number of genotypes per SNP and on the number of SNPs that remain in HWE. For example, on Chromosome 7, at a confidence level of 0%, 50%, 90%, and 95%, the number of SNPs with a call rate above 80% were 1,023, 1,020, 824, and 772, and the number of SNPs in HWE were 633, 633, 615, and 605, respectively. Thus, users can select and statistically define the confidence of genotype calls. If the sample set only includes unrelated individuals, the confidence level can be set conservatively to only include genotypes called with high accuracy and confidence. Alternatively, if family-based samples are used, an initial analysis with a lower confidence level followed by a comprehensive analysis of Mendelian errors in individual families may result in a higher rate of genotype calls.
Materials and Methods
Population and genotyping
The 1,560 individuals studied were a subset of the MRC-OB population recruited from the TOPS membership as described previously (9,10). All individuals were genotyped on a 3K custom-designed SNP chip, with 3,345 SNPs distributed across 5 chromosomal regions: one on Chromosomes 3, 7, and 14, respectively, and two on Chromosome 12. The SNP selection strategies have been described previously (11). Briefly, for the regions on Chromosomes 3 and 14, SNPs were selected using a gene-centric approach with an emphasis on putative functional SNPs; those on Chromosome 7 were selected based on the linkage disequilibrium (LD) patterns of the CEPH population of the HapMap; and those on Chromosome 12 were located within known genes, based on LD patterns and putative functionality.
Algorithm
The algorithm was initially described by Olivier et al (12). Briefly, each datapoint is assigned
to one of four clusters: 1, 2, 3, or 4, representing no-target (negative) controls (NTCs), homozygotes one (XX), homozygotes two (YY), and heterozygotes (XY), respectively. Clusters are described by an ellipse whose major and minor axes are the standard deviations in the x and y directions of the component points, which are rotated so that their covariance is equal to zero.
Fluoresence values are extracted from the MegAllele results for all samples and SNPs. Initially, fluorescence values for each SNP are scaled to between 0.05 and 0.95, and four negative control values are appended to the data to provide a reference start point for the analysis.
An ellipse containing the negative control datapoints is determined, and the probability of other datapoints belonging to this cluster is calculated using an empirically determined cut-off value. The ellipse is then redefined to include any new points.
The center of the genotype cluster locations is determined by a two-step process. Initially, a Cartesian coordinate system is overlaid on the data with its origin at (0.55, 0.55). The center of each quadrant is identified by averaging the component points. New coordinate systems are drawn in each quadrant with their origin at each quadrant's center. This process continues outward—towards the upper left corner, upper right, and lower right—until one point remains in each quadrant. Secondly, circles are drawn around the extreme point(s). The average location of the points inside the circle is computed and the circle center moves to this position. This process repeats until the circle center moves negligibly.
If either of the homozygote clusters are missing, the existing homozygote cluster center is mirrored to create the missing datapoint. If the heterozygote cluster is absent, the x axis coordinating from one homozygote cluster and the y axis coordinating from the other are used to determine the cluster center.
NIH-PA Author Manuscript
NIH-PA Author Manuscript
Cluster center locations are then separated by lines drawn through the NTC cluster center and exactly halfway between the identified cluster centers. All points above or to the left of the uppermost line are considered to be homozygote cluster one; the points between the lines are heterozygotes; and the points to the right or below the bottommost line are homozygote cluster two.
Based on the determination of cluster centers and bisecting lines, ellipses are calculated for each cluster. The probability that an individual datapoint belongs to each cluster is calculated using the two-dimensional normal distribution function represented by the probability ellipses. New ellipses are then created to reflect the new datapoints in the cluster, and this is repeated
for three times. The p-value for a point belonging to a particular cluster is equal to the
probability that it is in that cluster, which is divided by the summation of the individual probabilities of the point being in each of the four clusters.
The results are output depending on the p-value selected by users, and points are assigned to
one of the four regular clusters or are considered as a no call.
Data analysis
Once genotypes were determined for all SNPs and individuals at a confidence level of 99.0%, data accuracy was checked by ensuring that the allelic distribution for all loci does not significantly differ from HWE. As family-based samples were used, a modified allele frequency estimation method taking account of family relationships was employed (13). Predicted genotype frequencies were then compared with the observed values and statistically
significant (p < 0.05) differences were determined by a Chi-squared test. Only SNPs with a
call rate greater than 80% were described, and the data below this threshold were classed as insufficiently informative. A Bonferroni correction was applied to the data to account for multiple testing. SNPs with predicted allele frequencies of 1.0 or 0.0 were classed as monomorphic.
Acknowledgements
We thank Claire Beste, Regina Cole, Jeffrey Eckert, and Biljana Stojsavljevic for their assistance in producing the data used in this study. The data and analysis presented here were built on the development work for the genotype clustering algorithm by Jason von Bergen, Brian Gau, and Ronit Slyper at the Human and Molecular Genetics Center of the Medical College of Wisconsin. This work was partly funded by the National Institutes of Health, USA (Grant No. 1RO1HL74168).
References
1. Liu WM, et al. Algorithms for large-scale genotyping microarrays. Bioinformatics 2003;19:2397– 2403. [PubMed: 14668223]
2. Huentelman MJ, et al. SNiPer: improved SNP genotype calling for Affymetrix 10K GeneChip microarray data. BMC Genomics 2005;6:149. [PubMed: 16262895]
3. Lamy P, et al. Genotyping and annotation of Affymetrix SNP arrays. Nucleic Acids Res 2006;34:e100. [PubMed: 16899450]
4. Hua J, et al. SNiPer-HD: improved genotype calling accuracy by an expectation-maximization algorithm for high-density SNP arrays. Bioinformatics 2007;23:57–63. [PubMed: 17062589] 5. Rabbee N, Speed TP. A genotype calling algorithm for Affymetrix SNP arrays. Bioinformatics
2006;22:7–12. [PubMed: 16267090]
6. Xiao Y, et al. A multi-array multi-SNP genotyping algorithm for Affymetrix SNP microarrays. Bioinformatics 2007;23:1459–1467. [PubMed: 17459966]
7. Hardenbol P, et al. Multiplexed genotyping with sequence-tagged molecular inversion probes. Nat. Biotechnol 2003;21:673–678. [PubMed: 12730666]
Smith et al. Page 4
Genomics Proteomics Bioinformatics. Author manuscript; available in PMC 2009 September 20.
NIH-PA Author Manuscript
NIH-PA Author Manuscript
8. Hardenbol P, et al. Highly multiplexed molecular inversion probe genotyping: over 10,000 targeted SNPs genotyped in a single tube assay. Genome Res 2005;15:269–275. [PubMed: 15687290] 9. Kissebah AH, et al. Quantitative trait loci on chromosomes 3 and 17 influence phenotypes of the
metabolic syndrome. Proc. Natl. Acad. Sci. USA 2000;97:14478–14483. [PubMed: 11121050] 10. Sonnenberg GE, et al. Genetic determinants of obesity-related lipid traits. J. Lipid Res 2004;45:610–
615. [PubMed: 14754912]
11. Smith EM, et al. Comparison of linkage disequilibrium patterns between the HapMap CEPH samples and a family-based cohort of Northern European descent. Genomics 2006;88:407–414. [PubMed: 16713172]
12. Olivier M, et al. High-throughput genotyping of single nucleotide polymorphisms using new biplex invader technology. Nucleic Acids Res 2002;30:e53. [PubMed: 12060691]
13. McPeek MS, et al. Best linear unbiased allele-frequency estimation in complex pedigrees. Biometrics 2004;60:359–367. [PubMed: 15180661]
NIH-PA Author Manuscript
NIH-PA Author Manuscript
NIH-PA Author Manuscript
NIH-PA Author Manuscript
NIH-PA Author Manuscript
[image:7.612.65.269.67.666.2]Smith et al. Page 6
Table 1
Distribution of SNPs with call rates greater than 80% after clustering by the Affymetrix and MCW_CA algorithms
*
Chromosome (SNPs assayed)
Algorithm
In HWE
Not in HWE
Mono. SNPs
Rescued (new gt)
Rescued mono.
SNPs (new
gt)
Improved call rate (extra gt)
Total new gt
3 (825) Affymetrix 465 15 345 MCW_CA 215 87 9 4 (5,751) 15 (22,441) 148 (1,491) 29,683 7 (1,048) Affymetrix 980 43 25 MCW_CA 581 104 2 2 (2,720) 1 (1,512) 458 (4,460) 8,692 12 (1,055) Affymetrix 1,024 12 19 MCW_CA 600 114 2 2 (2,699) 0 (0) 470 (4,746) 7,445 14 (354) Affymetrix 344 8 2 MCW_CA 211 47 1 0 (0) 0 (0) 158 (1,758) 1,758 Total 47,578
gt = genotype; Mono. = monomorphic.
* The table summarizes the additional genotypes obtained in a second analysis using the MCW_CA algorithm.