MSc. Business Administration May 2017
A maturity model for improving
data quality management
Onur Kirikoglu
Colophon
Date : 31 May 2017
Version : 5.5
Project Reference : Master Thesis
Status : Final version
Author : Onur Kirikoglu
Student number : s1620576
E-mail : [email protected]
Education : MSc. Business Administration
Track : Business Information Management (BIM)
Institute : University of Twente
School of Management and Governance Enschede, The Netherlands
University supervisors : Dr. A.B.J.M. (Fons) Wijnhoven Dr. ir. S.J.A. (Sandor) Löwik
Synopsis
Acknowledgements
I have had difficult times during the course of my master thesis and therefore would like to thank some people. Firstly, Fons Wijnhoven for his support, theoretical insights and providing guidance during the course of this study. Secondly, Sandor Löwik for his feedback which made me think about certain subjects differently. In addition, I appreciate the support and patience from both my supervisors and cannot express my gratitude. Lastly, I would like to thank my parents, friends and family for their support in completing my thesis.
Abstract
Nowadays, firms cannot afford any mistakes with the data in their firm. The reason for this is that the data within the firm should provide additional value and not hurt the firm. Therefore, firms should be aware of the quality of their data and take possible actions to improve. This study focuses on providing firms with a tool for determining their state of maturity and evaluate data quality management. Specifically, this thesis investigates maturity models and analyzes different data quality management principles. The reason is that, these models are a fitting tool in assisting organizations in indicating the organization’s current or desirable state with regards to a specific topic of concern. During the course of this study, a maturity model and supporting scorecard were developed. These were both applied at nine different firms in the form of case studies and showed the practical applicability. On the basis of the results of this study, it can be concluded that the maturity model and scorecard are well applicable to firms that are looking at ways to improve their data quality management processes. Finally, the maturity model and supporting scorecard proved its usefulness within practice with the help of the conducted case studies and presented some insights in the business processes of the firms using it.
Contents
List of abbreviations 7
List of tables 7
List of figures 7
1. Introduction 8
2. Literature search 11
2.1 Methodology for the literature search 11
2.2 Data quality and quality characteristics 11
2.3 Data management 14
2.4 Maturity Models 19
2.5 Research problem and model 22
2.6 Conclusion of the literature search 31
3. Methodology 32
3.1 Qualitative vs. Quantitative research 32
3.2 Reliability and Validity of this research 33
3.3 Collecting data 34
3.4 Analysis 37
4. Analysis 38
4.1 Interviews 38
4.2 Interview results 39
4.2.1 Data quality within practice 39
4.2.2 Applicability of maturity model within practice 41
5. Results 46
5.1 Improved maturity model and scorecard 46
5.2 Testing the improved maturity model and scorecard 50
6. Conclusion and discussion 52
6.1 Conclusion 52
6.2 Discussion 53
6.3 Contribution 54
6.3 Limitations and future research 55
Appendices 57
Appendix I: Time schedule 57
Appendix II: Interview agreement (PacificWorlds, 2016). 59
Appendix III: Interview request letter (English and Dutch). 62
Appendix IV: Interview guide (English and Dutch) 64
Appendix V: Coding agenda 68
Appendix VI: Category system 75
List of abbreviations
DBMS Database management system
CMM Capability maturity model
List of tables
Table 1: Data quality characteristics (Cai & Zhu, 2015; Pipino et al., 2002; Strong et al., 1997).
... 13
Table 2: Advantages of using databases. ... 16
Table 3: Design principles 'checklist' (Pöppelbuß & Röglinger, 2011). ... 23
Table 4: Maturity stages of the maturity model. ... 25
Table 5: Criteria for each maturity level. ... 26
Table 6: Maturity model for determining the level of data quality management. ... 28
Table 7: Scorecard for determining the current state of maturity. ... 29
Table 8: Scorecard factors. ... 30
Table 9: Respondents for this study. ... 36
Table 10: Detailed overview of respondents. ... 38
Table 11: Feedback of each factor in the scorecard. ... 42
Table 12: Improved scorecard for determining the current state of maturity. ... 49
1. Introduction
Poor quality consumer data costs U.S. businesses $611 billion a year (Eckerson, 2002). According to a research conducted by Veritas (2015), where they identified the value of data within firms, they found out that the majority of data within firms is neglected, not used or redundant. Within the research 1,475 respondents were covered across 14 countries. The results of this research showed that 14% of all the data within firms is critical data, 32% is redundant data (data that is not relevant for the business) and the remaining 54% is dark data (data that is not used within the business). Furthermore, Veritas mentions that redundant data could cost organizations $891 billion by 2020 (Veritas, 2015).
This is shocking because data available within firms and insights gained from them could widely benefit business performance (Chang, 2014; Mantha, 2014; McAfee & Brynjolfsson, 2012; Merino, Caballero, Rivas, Serrano, & Piattini, 2015). Firms use systems to increase their overall business performance and optimize their services. However, these systems usually generate unneeded data but they cannot be missed within firms (Romero & Vernadat, 2016). Furthermore, Tayi & Ballou (1998) mention that “data is viewed as a key organizational resource and should be managed accordingly” (p. 54). In other words, the data available within firms should be managed properly so that this data is always ready for use. With this in mind, the correctness of data is also very important. Graham (2015) points out that when creating reports, managers would easily oversee duplicate data and therefore communicate more revenue than actually made. Redman (1996) states that “Errors in data can cost a company millions of dollars, alienate customers, and make implementing new strategies difficult or impossible.” (p. 99). We can say that firms cannot tolerate any mistakes with regards to their data in their enterprise systems.
misinterpretation can occur because there are no standard rules and procedures. Employee A could register the data in a different way than employee B. This will lead to employees making assumptions when viewing the data. Tayi & Ballou (1998) also mention that firms generally assign low priority to data quality. Low qualitative data could not only affect the competitiveness of the firm, but also hurt the firm from within; the trust among employees could be affected, because of constantly receiving invalid information (Ryu, Park, & Park, 2006). Xu et al. (2002) state that data quality is critical to an firm’s success, however not many firms take action to solve these issues.
In existing literature, many aspects of data quality and data management are discussed (Batini, Cappiello, Francalanci, & Maurino, 2009; Cappiello, Francalanci, & Pernici, 2004; Cong et al., 2007; Haug, Zachariassen, & van Liempd, 2011; Lee, Strong, Kahn, & Wang, 2002; Ryu et al., 2006; Tayi & Ballou, 1998). The increase of enterprise systems and the direct access to information by managers and employees have increased the need for, and awareness of, high quality data within firms (Lee et al., 2002). Furthermore, Chengalur-Smith, Ballou & Pazer (1999) mention that often managers must make decisions without thinking about the imperfections of the data found in their systems.
Nowadays, more and more systems share and exchange data in order to form an interconnected IT landscape. In addition, Marsh (2005) states that “data has always been ‘wrong’, but now the effects of it are much more visible and the consequences more serious.” (p. 105). In the past firms were mainly working with one system. Currently, an error within one connected system could assure that the data within all the other systems are also affected. This means that inaccurate, incomplete and inconsistent data cannot be neglected so easily, because it could directly affect for example the sales numbers.
To contribute to science, a maturity model for data quality management is developed which aims to create awareness for firms. The model creates points of discussion for firms and may guide firms in making plans for improving data quality management. In this research, the following central research question is treated:
To guide this research, the concept of maturity models is used. Specifically, the advantages and disadvantages of data quality management and the impact it can have on firms are treated. Maturity models are widely applied within different types of research and don’t always have the same topic of interest. The reason for using the maturity model concept is because this type of model is a fitting tool in assisting organizations in indicating the organization’s current or desirable state with regards to a specific topic, in this case data quality management (De Bruin, Freeze, Kaulkarni, & Rosemann, 2005; Pöppelbuß & Röglinger, 2011). In addition, the theories of data quality, databases and data management are treated. The reason for using these is that the maturity model developed within this research is focused on data quality management and the theories add to defining the context of the maturity model. As a limitation to this study, other possible topics that could influence data quality management (e.g. environmental factors, competition etc.) are beyond the scope of the study. Since this study aims to add data quality management within the subject of maturity models and therefore introduces new insights in this topic, it can be classified as explorative research (Babbie, 2012; Crossman, 2016).
2. Literature search
This chapter establishes and discusses data quality management. It starts with the methodology of this literature search (2.1). Additionally, data quality and the quality characteristics are presented (2.2). Subsequently, data management is treated and discussed (2.3). Furthermore, the concepts of maturity models are analyzed (2.4). Moreover, the research problem and the model of this study are elaborated (2.5). Lastly, a conclusion of the literature search is given (2.6).
2.1 Methodology for the literature search
The first part of this research is based on a critical review of relevant literature. The literature search was conducted between September 2016 and November 2016. In order to gather relevant articles several search engines were accessed: Google Scholar, ICT Services & Archive (LISA), ScienceDirect and Scopus. No publication date limits or language restrictions were used. A few keywords were applied for the search process: ‘data quality’ OR ‘data quality management’ OR ‘quality management’ OR ‘data improvement’ OR ‘data enhancement’ OR ‘data management’ OR ‘database management’ OR ‘databases’ OR ‘data maturity model’ OR ‘master data management’. In some cases, these keywords were used in combination of each other. Additionally, the collected articles were reviewed on the impact score of the journal and number of times the article was cited. With the literature search a total of 104 articles and 13 books were found. The articles and books provided further insights and points of discussion for this thesis. For finding new articles the same sources were applied. The articles were categorized based on publication data and books were separated from articles.
2.2 Data quality and quality characteristics
addition, Cai & Zhu (2015) propose that the judgment of data quality depends on the data consumers (the ones that use the data). Moreover, Strong et al. (1997) define a data quality problem as any difficulty that renders data completely or largely unfit for use. Cai & Zhu (2015) have identified several challenges of data quality: (1) There are many types of data sources that bring different data types and complex structures, this causes difficulty with data integration between different systems; (2) The amount of data within systems has a lot of volume, therefore it is difficult to judge the quality in a given time; (3) Data within firms change very fast and thus the ‘timeliness’ of data is very short. This may cause outdated or invalid information.
Table 1: Data quality characteristics (Cai & Zhu, 2015; Pipino et al., 2002; Strong et al., 1997).
Categories Characteristics Description
1. Availability
a. Accessibility (Strong et al., 1997)
“Accessibility” refers to the amount of access employees have to the data within the firm. Can the employees find the data needed or do they always need to put effort in getting it?
b. Timeliness (Cai & Zhu, 2015; Pipino et al., 2002)
“Timeliness” refers to the availability of data within a given time and if the data is updated regularly. Furthermore, if data retrieval and processing to release, meet the requirements.
2. Usability a. Credibility
“Credibility” refers to the amount of maintenance that is performed in order to check the correctness of the data.
3. Reliability
a. Accuracy
“Accuracy” means that data within the firm is correct and precise, and no errors are found in the gathered information.
b. Consistency
“Consistency” means that the same data within different systems should be identical and no differences should be present.
c. Integrity “Integrity” means that the data is clear and meets the given criteria.
d. Completeness (Pipino et al., 2002)
“Completeness” means that no data is missing in the information that has been gathered. For example, no orders can be excluded from the total amount of sales.
e. Free-of-Error (Pipino et al., 2002)
“Free-of-Error” refers to the extent in which data is correct and contains no errors. Furthermore, data with no errors is regarded as reliable.
4. Relevance
(Pipino et al., 2002) a. Fitness
“Fitness” refers to the usability of the data retrieved by employees and if this retrieved data meets the users’ needs.
5. Presentation (Strong
et al., 1997) a. Reliability
2.3 Data management
Databases are used to store, manipulate, and retrieve data in practically every kind of organization, including business, health care, education, government and libraries (Hoffer, J. A., Prescott, M.B., Topi, 2008). Databases are used by everyone in their daily life, whether it is writing a message on Facebook or storing your invoices in a finance software. If the systems used within the firm are arranged properly, then the customers of the firm can also access these systems and add new data to the databases or change existing data within the databases. Hoffer, Prescott & Topi (2008) state that many organizations have incompatible databases that were developed to meet immediate needs, rather than based on a planned strategy or a well-managed evolution. Furthermore, Hoffer, Prescott & Topi (2008) mention that “much of the data is trapped within older systems, and the data are often of poor quality.” (p. 45). Hoffer, Prescott & Topi (2008) define a database as an organized collection of logically related data. Databases are of any size and complexity. Nowadays, databases store any kind of data, such as documents, maps, photos, sound and video segments. Hoffer, Prescott & Topi (2008) define data as stored representations of objects and events that have meaning and importance in the users’ environment. Furthermore, Hoffer, Prescott & Topi (2008) define information as data that has been processed in such a way as to increase the knowledge of the person who uses the data. A way to convert data into information is to summarize them and create a report (Hoffer, J. A., Prescott, M.B., Topi, 2008).
A database management system (DBMS) is a system that is used to create, maintain, update, store, retrieve and provide controlled access to user databases (Hoffer, J. A., Prescott, M.B., Topi, 2008). A DBMS also enables users and programmers to share data among diverse applications, however the application in concern should support data sharing. Designing a database accordingly is fundamental to creating a database that meets the users’ needs. Data models are used to capture the relationship and nature among data. Hoffer, Prescott & Topi (2008) state that the effectiveness and efficiency of a database is directly associated with the structure of the database. A data model exists of objects, also known as entities. Examples of entities are Customers, Invoices, Cases and Orders. Information about each of these entities is referred to as an instance, for example the name of a customer or her given ID. A well-structured database establishes the many relationships between entities that exist in organizational data so that the desired information can be retrieved. Relational databases establish the relationship between entities by a common field, for example the ID of an order and the ID of a customer. With the help of a relational database, it is possible to create a relation between the different entities. For example, customers and their orders.
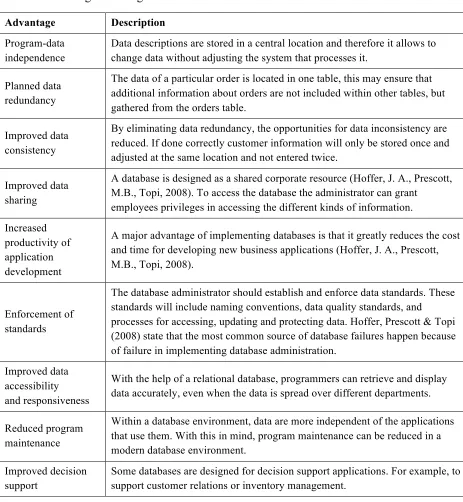
The database approach underlines the integration of system applications and enables sharing of data throughout the organization, or at least across major divisions within the organization (Hoffer, J. A., Prescott, M.B., Topi, 2008). The advantages of the database approach are almost the opposite of working with files. Table 2 presents the advantages mentioned by Hoffer, Prescott & Topi (2008).
Table 2: Advantages of using databases.
Advantage Description Program-data
independence
Data descriptions are stored in a central location and therefore it allows to change data without adjusting the system that processes it.
Planned data redundancy
The data of a particular order is located in one table, this may ensure that additional information about orders are not included within other tables, but gathered from the orders table.
Improved data consistency
By eliminating data redundancy, the opportunities for data inconsistency are reduced. If done correctly customer information will only be stored once and adjusted at the same location and not entered twice.
Improved data sharing
A database is designed as a shared corporate resource (Hoffer, J. A., Prescott, M.B., Topi, 2008). To access the database the administrator can grant
employees privileges in accessing the different kinds of information. Increased
productivity of application development
A major advantage of implementing databases is that it greatly reduces the cost and time for developing new business applications (Hoffer, J. A., Prescott, M.B., Topi, 2008).
Enforcement of standards
The database administrator should establish and enforce data standards. These standards will include naming conventions, data quality standards, and processes for accessing, updating and protecting data. Hoffer, Prescott & Topi (2008) state that the most common source of database failures happen because of failure in implementing database administration.
Improved data accessibility and responsiveness
With the help of a relational database, programmers can retrieve and display data accurately, even when the data is spread over different departments.
Reduced program maintenance
Within a database environment, data are more independent of the applications that use them. With this in mind, program maintenance can be reduced in a modern database environment.
Improved decision support
Besides the advantages of database systems, Hoffer, Prescott & Topi (2008) also recognize several costs and risks: (1) New, Specialized Personnel: organizations that adopt the database approach need to hire specialized personnel to implement and manage these databases and because of the rapid changes in technologies these employees need to be trained on regular basis; (2) Installation, management cost and complexity: A multiuser database system is a large and complex system, has high initial cost, requires trained staff and has annual maintenance and support costs; (3) Conversion costs: the costs of converting old file handling systems to a database are often high. These costs are measured in terms of money, time and organizational commitment; (4) Need for explicit backup and recovery: The data within databases should be available anytime, and during casualties a backup should always be available. Based on the importance of the data the frequency of backups can be set and (5) Organizational conflict: conflicts on data definitions, data formats and coding may occur, handling these issues require organizational commitment. Lack of commitment may cause bad decision making that threatens the well-being of the organization (Hoffer, J. A., Prescott, M.B., Topi, 2008).
Two different types of database management exist: (1) the management by systems: that ensures that the data is stored in the right place and available when needed and (2) management by users: that assure that the data is correct by performing daily checks and ensure that new data enters the different systems correctly. The second type can potentially lead to poor data quality because, mistakes can be made when inserting the data in the ‘correct’ systems. In addition, users of the data could willingly neglect addition of ‘new information’ because of the potential harm for their own career. Neglecting this data, may cause missing and incomplete data. If all the data is not present, managers will make assumptions based on the data they at that point possess.
Hoffer, Prescott and Topi (2008) mention that using default values or not permitting empty values could be a solution for missing data. However, missing data is not completely unavoidable. Babad and Hoffer (1984) mention that “when data are missing, lost, or incomplete, procedures may work incorrectly; computations may lose reliability, and their results may have to be interpreted as estimates (if they are even valid at all).” (p. 748). Additionally, Babad and Hoffer (1984) define a set of procedures for handling missing data:
2. Track missing data so that special reports and other system elements cause people to resolve unknown values quickly: this can be done by setting up triggers in the database definition. These triggers are routines that trigger when a special event occurs;
3. Perform sensitivity testing so that missing data are ignored unless knowing a value might significantly change results: monitoring thresholds would be of case, for example when the compensation of an employee based on sales almost reaches a limit that would make a difference in his/her compensation.
2.4 Maturity Models
Since the introduction of the capability maturity model (CMM) of Paulk et al. (1993), different types of maturity models are introduced by many researchers. For example, the Process Maturity Model developed by the Rummler-Brache Group (De Bruin et al., 2005) and the Project Management Maturity Model developed by the Office of Government Commerce, UK (De Bruin et al., 2005). The goal of a maturity model is to reach a certain level of maturity. Paulk et al. (1993) define the differences between immature and mature organizations: “In an immature organization, processes and tasks are improvised by practitioners and managers during a project. Even if a process has been specified, it is not correctly followed or enforced” (p. 19) and “A mature organization has the organization-wide ability to manage development and maintenance. Managers communicate well with staff and work activities are carried out according to plan.” (p. 19). The CMM is based on the idea of continues improvement and aid organizations in prioritizing its improvement efforts. The CMM proposes five different maturity levels, in which achieving each level of maturity establishes a different component in a software process, resulting in an increase in the process capability of an organization (Paulk et al., 1993). Each maturity level forms a foundation for the next. The five maturity levels are described below (Paulk et al., 1993):
1. At level 1: Initial, an organization typically does not provide a stable environment for developing and maintaining software. These kinds of firms have difficulties with commitment of staff and this can result in crisis. During a crisis, projects typically abandon planned procedures. Focus is given to individuals, not organizations.
2. At level 2: Repeatable, policies for management and procedures to implement those policies are established. New projects are based on experiences with similar projects. Project standards are defined and the organization ensures that they are faithfully followed. Level 2 organizations are disciplined because project planning and tracking are stable and earlier successes can be repeated.
4. At level 4: Managed, an organization sets quantitative quality goals for both products and processes with well-defined and consistent measurements. An organization-wide process database is used to collect and analyze the data available from a project’s defined processes. The risks involved in moving up the learning curve are known and carefully managed. When limits are exceeded, managers take action to correct the situation.
5. At level 5: Optimizing, the entire organization is focused on continuous improvement. The organization has the means to identify weaknesses and strengthen the process proactively, with the goal of preventing defects. At level 5, waste is unacceptable; organized efforts to remove waste result in changing the system by changing the common causes of inefficiency. Reducing waste happens at all maturity levels, but it is the focus of level 5. Improvement occurs both by incremental advancements in the existing process and by innovations in technologies and methods (Paulk et al., 1993).
Paulk et al. (1993) mentions several attention points with regards to the maturity levels. For example, level 1 organizations often miss their deliver date based on their initial schedule by a wide margin. More mature organizations should be able to meet the targeted dates with increased accuracy. Moreover, as maturity increases, the variability of actual results around targeted results decreases. In addition, similar projects in mature organizations, should be delivered within a smaller range. As organizations mature, costs decrease, development times shorten and productivity and quality increase. Development times in level 1 organizations are time consuming, because of rework needed. This rework is mostly needed because of incorrectly following the defined standards and procedures.
Skipping a maturity level is not advised, because each maturity level lays the foundation for achieving the next and is therefore counterproductive. Paulk et al. (1993) state that processes without a proper foundation fail and provide no basis for future improvement. Specifically, achieving higher levels of maturity is incremental and requires a long-term commitment to continues process improvement and should therefore be conducted accordingly. The CMM identifies the characteristics of an effective software process, but the mature organization addresses all issues that are essential for a successful project, including people, technology and process.
as this topic is regarded as important because it is the basis of an information system. Moreover, quality plays an important role within businesses and acts as one of the powerful metrics to gain competitive advantage (Ryu et al., 2006). In order to increase the competitiveness of organizations this maturity model has been introduced. The maturity model helps to appraise firms’ levels of data quality management and to acquire better quality. The four defined maturity levels are described below (Ryu et al., 2006):
1. At level 1: Initial, the data structure quality is managed through the rules defined in the database system catalogue. It is the early stage of data management.
2. At level 2: Defined, data is managed through the logical and physical data models. If the data structure is modified or remodeled, it should refer to the data model. The modification should be returned as a new input to the database.
2.5 Research problem and model
In this research, a maturity model for data quality management will be developed. This maturity model aims to determine the state of maturity of an organization and with this provide an overview of the current state of the organization by looking at data quality management principles. With this in mind the maturity model of Ryu et al. (2006) will be critically analyzed and looked at from a new angle. In the current maturity model firms cannot directly categorize themselves within a specific maturity level, additional effort is needed for categorization within this model. The firm using the model needs to sit together with some technical personnel, to discuss the certain aspects of each maturity level and classify themselves accordingly. The maturity model of this study focuses on providing an easy tool that can be used by any employee that is included within the business processes of the firm, for example managers. However, the maturity model is not applicable to any type of organization, for instance a bakery around the corner would not easily start in applying this maturity model within her firm. But, firms that are dealing with a decent amount of data and if data is critical in their business processes, this model would be suitable.
Poppelbuß & Röglinger (2011) have defined a set of design principles that maturity models as design products should meet, because there is no comprehensive understanding of relevant principles. Poppelbuß & Röglinger (2011) have created a checklist which researchers that are involved in the design of a maturity model can use. This checklist is used in the development of the maturity model of this study. In addition, several purposes of use for maturity models are mentioned:
- Descriptive: this purpose of use applies when the maturity model is used for assessing the current capabilities of the firm with respect to certain criteria. The model hereby is used as a diagnostic tool (Pöppelbuß & Röglinger, 2011).
- Prescriptive: this purpose of use applies when the maturity model is used to indicate how to identify desirable maturity levels and provides some guidelines for improvements. - Comparative: this purpose of use applies when the maturity levels of similar business units
and organizations can be compared with each other.
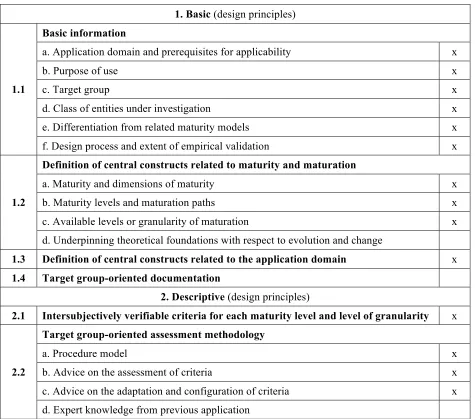
could be applied in the design stage of a maturity model. In addition, some principles with regards to the purpose of use, in this case ‘descriptive’ are also mentioned. Nevertheless, Poppelbuß & Röglinger (2011) state that “We do not require each maturity model to meet all design principle. Instead, the framework serves as a checklist when designing new maturity models.” (p. 5). With this in mind, the design principles will be followed accordingly. Table 3 presents the checklist applied for designing the maturity model of this study.
Table 3: Design principles 'checklist' (Pöppelbuß & Röglinger, 2011).
1. Basic (design principles)
1.1
Basic information
a. Application domain and prerequisites for applicability x
b. Purpose of use x
c. Target group x
d. Class of entities under investigation x
e. Differentiation from related maturity models x
f. Design process and extent of empirical validation x
1.2
Definition of central constructs related to maturity and maturation
a. Maturity and dimensions of maturity x
b. Maturity levels and maturation paths x
c. Available levels or granularity of maturation x d. Underpinning theoretical foundations with respect to evolution and change
1.3 Definition of central constructs related to the application domain x 1.4 Target group-oriented documentation
2. Descriptive (design principles)
2.1 Intersubjectively verifiable criteria for each maturity level and level of granularity x
2.2
Target group-oriented assessment methodology
a. Procedure model x
b. Advice on the assessment of criteria x
The design principles that are applied in the design process of the maturity model will be checked within the checklist that is given in Table 3. Poppelbuß & Röglinger (2011) have categorized the design principles into different groups, these are applied in this study accordingly.
- 1.1: (a) The domain where this maturity model will be applied is the field of data quality management, because data quality management is nowadays not the focus of many firms, while it of huge importance (Cai & Zhu, 2015; Strong et al., 1997). The prerequisites for applicability of this model are that the firm using the model should be highly dependable on their data, cannot afford mistakes in their data, should work with critical data within their business processes and must have some knowledge of the firms’ business processes. (b) The purpose of use for the maturity model is ‘descriptive’ because the model acts as a tool for diagnosing the current state of an organization. (c) The target group of the maturity model are mostly managers that have a good overview of the business processes of the firm or employees that also possess this same view. It is targeted towards managers because not every employee on the workplace may have the needed knowledge about the firms’ business processes. (d) The entities selected to be investigated for this study are diversified, from insurance, software and consultancy firms to government agencies. This diversification is applied, so that different views towards the maturity model of this study could be gathered. (e) The model in this study provides a new angle to the model of Ryu et al. (2006), which is more focused towards databases of the firm and the management of these and has a technical nature. The difference of the maturity model in this study is that it focuses on individuals that are known with the firms’ business processes and with this can categorize themselves within a certain maturity level. (f) Lastly, the maturity model will be subject to empirical validation with the means of interviews that will be conducted with a variety of individuals. In addition, within the interviews an overview of data quality management will be gathered and afterwards the developed maturity model will be discussed and the model usage will be tested.
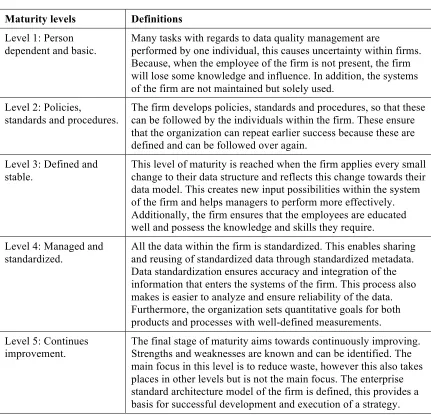
dimensions are applied: (1) person dependent and basic, (2) policies, standards and procedures, (3) defined and stable, (4) managed and standardized, (5) continues improvement. Table 4 provides elaboration on these dimensions.
Table 4: Maturity stages of the maturity model.
Maturity levels Definitions Level 1: Person
dependent and basic.
Many tasks with regards to data quality management are
performed by one individual, this causes uncertainty within firms. Because, when the employee of the firm is not present, the firm will lose some knowledge and influence. In addition, the systems of the firm are not maintained but solely used.
Level 2: Policies,
standards and procedures.
The firm develops policies, standards and procedures, so that these can be followed by the individuals within the firm. These ensure that the organization can repeat earlier success because these are defined and can be followed over again.
Level 3: Defined and stable.
This level of maturity is reached when the firm applies every small change to their data structure and reflects this change towards their data model. This creates new input possibilities within the system of the firm and helps managers to perform more effectively. Additionally, the firm ensures that the employees are educated well and possess the knowledge and skills they require. Level 4: Managed and
standardized.
All the data within the firm is standardized. This enables sharing and reusing of standardized data through standardized metadata. Data standardization ensures accuracy and integration of the information that enters the systems of the firm. This process also makes is easier to analyze and ensure reliability of the data. Furthermore, the organization sets quantitative goals for both products and processes with well-defined measurements. Level 5: Continues
improvement. The final stage of maturity aims towards continuously improving. Strengths and weaknesses are known and can be identified. The main focus in this level is to reduce waste, however this also takes places in other levels but is not the main focus. The enterprise standard architecture model of the firm is defined, this provides a basis for successful development and execution of a strategy.
the standard consistent process, because policies, standards and procedures are defined. This ensures consistency throughout the organization. From level 3 to level 4 the maturation path is called the predictable process, because measurements are made and therefore predications about future trends can be drafted. The process is both stable and measured, this ensures that during circumstances, managers can take actions to correct the situation. From level 4 to level 5 the path is defined as the continuously improving process, because firms following this process should always aim to improve. Firms can identify their strengths and weaknesses, with the goal of preventing mistakes. Additionally, teams in level 5 organizations aim to determine causes of events and evaluate these to prevent reoccurring errors in the future.
- 1.3: The domain where the maturity model would be applicable are firms whom are dealing with a decent amount of data within their business processes and these data are critical in the daily processes of the firm. This excludes firms like bakeries who are not really focused on their data, but rather towards generating enough turnover before the end of the month. However, government agencies cannot afford mistakes within their data and therefore need the quality of their data to be at a certain level and could use the maturity model of this study to determine their current state and build up upon that. Some central constructs that could apply to this application domain are: data quality, usability and organizational performance.
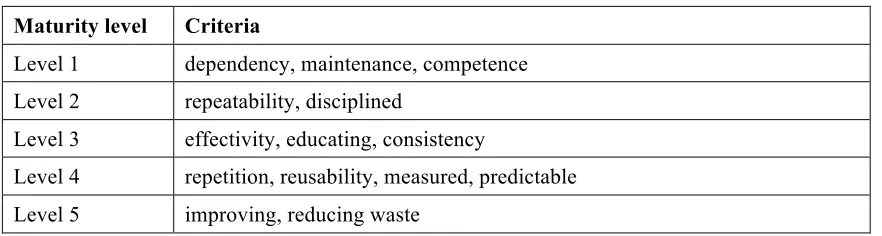
[image:26.612.106.547.589.707.2]2.1: The criteria that are defined for each maturity level originate from the description of each level, so that consistency between both can be achieved. Table 5 shows the criteria defined for each maturity level. Probably some additional criteria could be defined, however during the analysis of the theory only these criteria are included.
Table 5: Criteria for each maturity level.
Maturity level Criteria
Level 1 dependency, maintenance, competence Level 2 repeatability, disciplined
Level 3 effectivity, educating, consistency
Poppelbuß & Röglinger (2011) also mention within their checklist the procedure within the maturity model, so how you get from one level to the other. Additionally, some advice about the selected criteria needs to be included. Moreover, expert knowledge from previous application is not available for this study, because a new not previously applied model will be used. In the next paragraph, the maturity model for this study will be presented and the procedure and advice on assessment of criteria will be discussed.
Maturity model for Data Quality Management
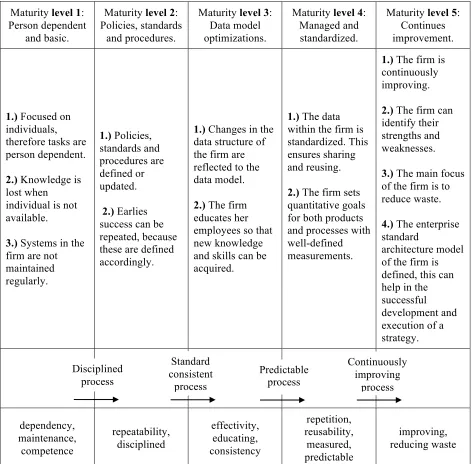
The maturity model of this study provides a quick overview of each maturity level and its criteria. Each maturity level is shown in a column, within the column the characterizing descriptions of each level are summed up. In addition, the maturation paths for each advancement are illustrated with an arrow below the description of each maturity level. Lastly, the criteria for each maturity level are given. Table 6 illustrates the maturity model of this study.
Table 6: Maturity model for determining the level of data quality management.
Maturity level 1: Person dependent
and basic.
Maturity level 2: Policies, standards
and procedures.
Maturity level 3: Data model optimizations.
Maturity level 4: Managed and standardized.
Maturity level 5: Continues improvement.
1.) Focused on individuals, therefore tasks are person dependent.
2.) Knowledge is lost when individual is not available.
3.) Systems in the firm are not maintained regularly. 1.) Policies, standards and procedures are defined or updated. 2.) Earlies success can be repeated, because these are defined accordingly.
1.) Changes in the data structure of the firm are reflected to the data model.
2.) The firm educates her employees so that new knowledge and skills can be acquired.
1.) The data within the firm is standardized. This ensures sharing and reusing.
2.) The firm sets quantitative goals for both products and processes with well-defined measurements.
1.) The firm is continuously improving.
2.) The firm can identify their strengths and weaknesses.
3.) The main focus of the firm is to reduce waste.
4.) The enterprise standard
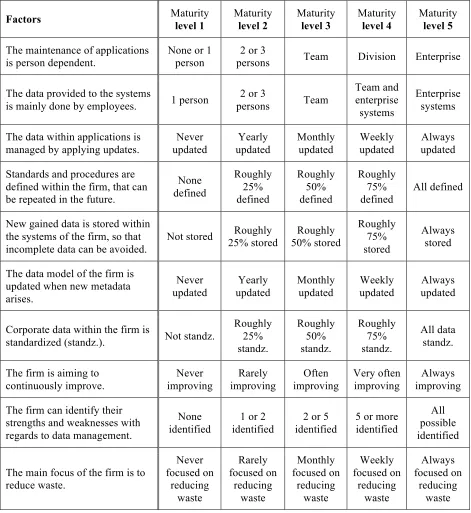
Table 7: Scorecard for determining the current state of maturity.
Factors Maturity
level 1 Maturity level 2 Maturity level 3 Maturity level 4 Maturity level 5
The maintenance of applications
is person dependent. None or 1 person persons 2 or 3 Team Division Enterprise
The data provided to the systems
is mainly done by employees. 1 person
2 or 3
persons Team
Team and enterprise systems
Enterprise systems
The data within applications is managed by applying updates.
Never updated Yearly updated Monthly updated Weekly updated Always updated
Standards and procedures are defined within the firm, that can be repeated in the future.
None defined Roughly 25% defined Roughly 50% defined Roughly 75% defined All defined
New gained data is stored within the systems of the firm, so that incomplete data can be avoided.
Not stored 25% stored Roughly 50% stored Roughly
Roughly 75% stored
Always stored
The data model of the firm is updated when new metadata arises. Never updated Yearly updated Monthly updated Weekly updated Always updated
Corporate data within the firm is
standardized (standz.). Not standz.
Roughly 25% standz. Roughly 50% standz. Roughly 75% standz. All data standz.
The firm is aiming to continuously improve. Never improving Rarely improving Often improving Very often improving Always improving
The firm can identify their strengths and weaknesses with regards to data management.
None identified
1 or 2 identified
2 or 5 identified
5 or more identified
All possible identified
The main focus of the firm is to reduce waste. Never focused on reducing waste Rarely focused on reducing waste Monthly focused on reducing waste Weekly focused on reducing waste Always focused on reducing waste
be regarded as the current maturity level of the firm. However, there could be scenario’s that more than one maturity level is marked. In this case, the lowest maturity level should be preferred, before advancement to a higher level is made. The factors in the lower maturity level should be improved upon first. (3) It should be noted that other factors besides the one mentioned could also have an influence on the maturity level and data quality management within the firm. These factors are currently unknown and therefore not included within the scorecard. The choice for ten factors is also related to the fact that some are unknown and based on the descriptions of each maturity level these were regarded as sufficient to determine the current state of maturity. (4) The factors influence the data quality of the firm, for example when procedures are defined the data will reach the correct systems and stored correctly. This ensures that correct analysis can be made.
Table 8: Scorecard factors.
Factors Elaboration
The maintenance of applications is
person dependent. The firm has assigned an individual who is responsible for the maintenance and only that individual possesses the knowledge. The data provided to the systems is
mainly done by employees. This is aimed towards, how much the tasks within the firm are automatized versus manual tasks. The data within applications is
managed by applying updates.
This factor refers towards the up-to-dateness of the data and how complete the available data is.
Standards and procedures are defined within the firm, that can be repeated in the future.
If this is achieved, employee can approach documents wherein is stated how they should perform a certain task. These documents should always be available, and therefore repeatable.
New gained data is stored within the systems of the firm, so that incomplete data can be avoided.
New retrieved information is directly stored within the systems and not documented somewhere not approachable by others.
The data model of the firm is updated when new metadata arises.
Previously not available data is made available within the systems, so that these can be included in future registrations. Corporate data within the firm is
standardized (standz.).
By standardizing the data, accuracy and integration of the information within the systems can be established. The firm is aiming to continuously
improve.
This factor is aimed towards removing repetitive tasks by improving for example procedures.
The firm can identify their strengths and weaknesses with regards to data management.
The firm is aware of mistakes within their processes and know how they could solve these. The firm also knows their strengths and know how to operate based on these.
The main focus of the firm is to reduce waste.
2.6 Conclusion of the literature search
Firstly, data quality is discussed and the definition ‘fitness for use, by data consumers’ is used as the central definition of data quality within this research. Furthermore, two problems caused by poor data quality are mentioned: extra time needed to reconcile data and loss of reliability because of existing errors. In addition, several data quality characteristics are presented and briefly discussed. The presented characteristics are: Accessibility, Timeliness, Credibility, Accuracy,
Consistency, Integrity, Completeness, Free-of-Error, Fitness and Reliability (2.2).
Second, data management as a separate topic has been discussed (2.3). Within this section of the literature search, the principles of managing data accordingly are discussed. Additionally, examples of poor data management are shown and the advantages and disadvantages (costs and risks) of using databases are noted. For instance, databases provide improved data sharing, because employees can easily access the systems and gather the data needed. Furthermore, implementing a good database system within the firms needs someone with that knowledge, this could be costly depending on the task that needs to be conducted. Lastly, some procedures for handling missing data are mentioned. For instance, using estimates when the data is not available.
Lastly, the capability maturity model of Paulk et al. (1993) and the maturity model for data quality management of Ryu et al. (2006) are discussed. The maturity levels of each model are elaborated (2.4). Additionally, the design principles by Poppelbuß & Röglinger (2011) that maturity models as design products have to meet are discussed (2.5). With these in mind, the model of this research has been categorized as descriptive because the model acts as a tool for diagnosing the current state of an organization with regards data quality management. Furthermore, the maturity model of this research is illustrated (table 6) and a scorecard that acts a tool for determining the current state of maturity is developed (table 7).
3. Methodology
This chapter will discuss in depth how this research was conducted. First, the choice for qualitative research is presented (3.1). Second, the reliability and validity of this research are discussed (3.2). Third, how data was collected for this research is explained (3.3) and, as last data analysis is treated (3.4).
Since this study aims to add a new angle towards data quality management within the subject of maturity models and with this introduce new insights in this topic, it can be classified as explorative research (Crossman, 2016). Furthermore, within every research the discussion whether qualitative or quantitative methods are more valid is treated, therefore both methodologies will be briefly discussed.
3.1 Qualitative vs. Quantitative research
Quantitative research is an approach for testing objectives (theories) by investigating the relationship among different variables (Creswell, 2013). Mostly the researcher defines a hypothesis and tests this hypothesis with statistical procedures through fixed variables. Quantitative research follows deductive reasoning: this implies reasoning from one or more statements in order to reach a certain conclusion. Furthermore, quantitative research is suitable for relatively large samples (Silverman, 2013). Interviews within quantitative research are mainly structured and are conducted with the help of surveys (Edwards & Holland, 2013).
Qualitative research is an approach for exploring and understanding the meaning of individuals with regards to a specific problem (Creswell, 2013). Within this type of research the researcher develops questions and procedures in order to gather additional information for his/her research. Qualitative research follows inductive reasoning: this implies reasoning in providing strong evidence for the truth of a drafted conclusion and also generalizes the observations made. Semi-structured and unstructured interviews are mostly used within qualitative research settings. Edward & Holland (2013) mention that these types of interviews are characterized by increasing levels of flexibility and lack of structure.
qualitative research generalization of the findings is not the main goal, it aims to understand and explore certain cases and contexts (Bryman, 2013).
The research method chosen depends mainly on the central research question of a study. Since this study aims to add data quality management within the subject of maturity models and therefore introduces new insights in this topic, it can be classified as explorative research. A qualitative research design will be applied within this study, wherein insights in the topic of data quality management will be collected.
3.2 Reliability and Validity of this research
Reliability is aimed towards whether the results of a study are repeatable by different researchers or by the same researcher at a different time and place, and if these would give the same results. Achieving reliability is no easy task within qualitative studies, because the results of the study may change based on the perception of each researcher. Reliability can further be divided to external and internal reliability. External reliability is the degree to which the findings of the study can be replicated (Bryman, 2013). For this study, the findings of the study can be replicated in some way. However, identical replication could probably not occur, because of a ‘open’ interview structure. This means that the interviewee would probably not answer exactly the same, because he or she gives an answer based on their thoughts at that exact moment. Nevertheless, also each individual will have a different look at a certain subject. In addition, Bryman (2013) states that “true replication of a qualitative research is difficult because it is unstructured and often reliant upon the qualitative researcher’s ingenuity and hardly any standard procedures can be followed.” (p. 405). Internal reliability is aimed towards whether the observers within a research agree about their findings and if an independent researcher would come to the same conclusion (Bryman, 2013). It is difficult to reach internal reliability for this study, because like mentioned before each research has their own point of view which regards to the topic of concern. Therefore, reaching the same conclusion could be rather difficult.
any specific measurement and therefore could be regarded as relevant. Internal validity refers to the causality of two or more variables and whether there is a good match between the observations and the ideas researchers develop (Bryman, 2013). Internal validity does not directly apply to this study, because no causal relation between two or more variables are tested. The researcher does not test if different approaches to maturity models have different outcomes for maturity levels.
External validity refers to the generalizability of the findings of the study beyond the specific research context (Bryman, 2013). Achieving generalizability is no easy task within qualitative research, because of the relatively small sample sizes within the study. The people that are generally interviewed within this type of research are not representative of the whole population. Additionally, Bryman (2013) mentions that the findings within qualitative research are to generalize to theory rather than to populations. Ecological validity refers to the applicability of the findings of a study to people’s everyday lifestyle. This type of validity is discussable, because each researcher may look differently at what exactly influences an individual’s life. For this topic, the firm could drastically change their procedures or processes to improve data quality management within the firm. And by looking at this scenario, employees could be affected towards their lifestyle, because of more workload within the firm. Therefore, ecological validity could be applicable in some sense for this study.
3.3 Collecting data
In qualitative research, several main research methods are applied, such as ethnography/participant observation, interviews and focus groups. For this study, interviews seem to be a suitable method because they allow open ended questions to a small sample and make it possible to gather insights or experiences of individuals. Within qualitative research two types of interviews are generally used; semi-structured and unstructured. In comparison to quantitative research, interviews within qualitative research are less structured and have more flexibility, the researcher can deviate from any schedule and gathering detailed answers is possible (Bryman, 2013).
the questions within the interview guide could be asked in any order assumed most suitable for the current situation. Additionally, questions not listed within the interview guide could be asked based on the answers picked up by the researcher. No questions will be neglected for no valid reason.
The available literature was studied intensively, before conducting any interviews. The insights gained from the literature were used as inspiration to define the questions for the interviews. In addition, an informed consent with the principles of ethics in mind was constructed which can be found in Appendix II. This informed consent is discussed with the interviewee which in turn needs to agree to these in order for the interview to take place. The informed consent acts as additional information about the research in order for the interviewee to make an informed decision about whether or not they wish to participate in this research (Bryman, 2013).
An interview guide was developed to act as a tool in guiding the interviews and to ensure that all the planned subjects for this study were covered. Possible misunderstandings about the questions were taken into consideration, because of the different backgrounds of the interviewees. Accordingly, clarifying questions were asked whenever deemed necessary the check if the interviewee understood the questions and if their given answer matches the question correctly. The interview guide can be found in Appendix IV.
should have a role within the firm that is associated with using, arranging and analyzing the data, (2) the firm of the respondent should be dealing with critical data among their business processes, (3) the respondents should not solely be the users of the data but also the ones that maintain them and (4) the respondent should have some level of experience in the topic of data quality management and should not be inexperienced.
[image:36.612.75.544.509.702.2]To limit bias, highly knowledgeable respondents with regards to data quality management were selected (Bryman, 2013). The respondents were found through different channels. Some were personal contacts of the researcher and some were approached through the networks of these contacts. Others were contacted through LinkedIn, because the occupation of individuals can be found. The Dutch language was preferred for conducting the interviews, however if needed otherwise, the English language was preferred. All the interviews were voice recorded and promised anonymity. The interviewees gave permission to record, by agreeing to the informed consent defined within Appendix II. Six interviews took place at the interviewees workplaces, two were invited to my personal workspace and one was done with the help of FaceTime. Each interview took approximately between 40 and 55 minutes. The number of interviewees was decided based on the time and costs available for this research. This number excludes any dropouts that have occurred by for example withdrawing from this research because of personal reasons. The interviews were stopped because enough differentiated results were gathered with regards to the maturity model and the interviews were not providing any new and different insights.
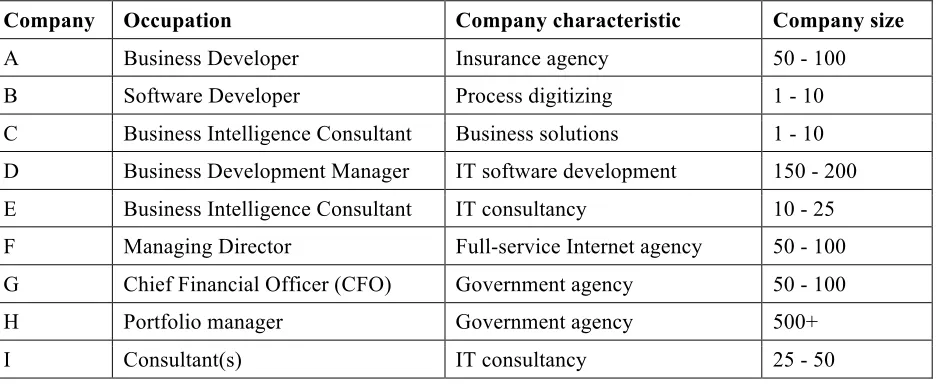
Table 9: Respondents for this study.
Company Occupation Company characteristic Company size
A Business Developer Insurance agency 50 - 100
B Software Developer Process digitizing 1 - 10
C Business Intelligence Consultant Business solutions 1 - 10 D Business Development Manager IT software development 150 - 200 E Business Intelligence Consultant IT consultancy 10 - 25 F Managing Director Full-service Internet agency 50 - 100 G Chief Financial Officer (CFO) Government agency 50 - 100
H Portfolio manager Government agency 500+
3.4 Analysis
Before conducting analysis on the data collected, the interviews were transcribed. The interviews were transcribed without neglecting any important data and usefully summarized. In order to provide more detailed insights in how the transcribed interviews were turned into analyzable contents for this study, the following actions were taken: Firstly, the topics of each set of questions within the interview guide were grouped as a theme. Consequently, the themes were included in a coding agenda, which can be seen in Appendix V. In defining the columns for the coding agenda, the qualitative content analysis approach of Mayring (2000) was used. Second, after creating the coding agenda, a category system was defined wherein the statements of the interviewee were included. Some statements were directly quoted, but most were summarized and written in the researchers own words. For instance, company B mentioned that “We don’t really use any procedures or standards; mostly common sense is applied.”. Statements and answers on the questions within the interviews are included in the category system. The category system can be found in Appendix VI. Lastly, themes that provided additional value to the topic of this study were analyzed and discussed in more detail (see chapter 4). The collected statements, opinions and events were interchanged and combined within the different themes. Data that seemed less important was completely left out.
4. Analysis
Within this chapter, the interviews and their objectives are discussed (4.1). In addition, the interviews are analyzed to provide a practical view on data quality management (4.2). Furthermore, the points of improvement for the maturity model and scorecard gathered from the case studies are presented (4.3).
4.1 Interviews
[image:38.612.71.550.421.657.2]The interviews were conducted at nine different firms, some firms are active in a similar field, but none of the firms are correlated with each other. Some firms of similar type were interviewed, so that differences between the firms could be gathered. The interviewed firms ranged from large to small firms. This variety was applied so that the applicability of the maturity model and scorecard could be tested in firms of different size and if this would have some effects. By identifying possible effects, the model and scorecard could be adjusted for better fit in practice, so that the size of a firm would not negatively or positively affect the maturity level. Table 10 illustrates the interviewed firms in more detail.
Table 10: Detailed overview of respondents.
Company Company
size Located in Contact type
Length of interview
Number of participants A 50 - 100 The Netherlands face-to-face 37 minutes 2 B 1 - 10 The Netherlands face-to-face 43 minutes 2
C 1 - 10 The Netherlands face-to-face 57 minutes 2 D 150 - 200 The Netherlands face-to-face 42 minutes 2
E 10 - 25 The Netherlands face-to-face 72 minutes 2 F 50 - 100 The Netherlands face-to-face 45 minutes 2
G 50 - 100 Turkey facetime 106 minutes 2
H 500+ The Netherlands face-to-face 45 minutes 2
The first objective of the interviews was to gain insights in the principles firms applied for data quality management within practice, so that a comparison with theory could be made. For instance, discussions with regards to experiences of poor data quality were reviewed. Furthermore, the interviews confirmed any assumptions the researcher had with regards to data quality management within practice. The second objective was to receive feedback on the maturity model and scorecard of this study. The feedback in turn lead to improvements for better fit within practice. During each interview fitting questions regarding the topic of interest were presented, that would reflect back to the maturity model. Furthermore, the maturity model and scorecard were tested accordingly by performing a case study, on the organization of the respondent that was interviewed. Additionally, conclusions could be drafted for what was working well and bad within the model and scorecard. This was also the overall objective of the interviews; to enhance the applicability of the model and scorecard of this study, this data collection of different perspective was successful.
4.2 Interview results
In this section, the themes used within the interviews will be discussed. The themes consist of several questions; however, some will be combined in order to decrease the length of this section. The topics data quality within practice (4.2.1) and applicability of maturity model within practice
(4.2.2) are discussed in detail and statements from the respondents are stated. Not all the data that are collected with the help of the interviews are discussed in detail, an overview of all can be found in Appendix VI.
4.2.1 Data quality within practice
cannot freely fill-in the data, but rather had to select the data from a pre-filled dropdown. Nevertheless, changes like these could improve data quality. Furthermore, company E noted that
“We don’t have any quality procedures, only responsibilities of what needs to be done. Our firm is not internally giving additional attention to managing data quality.”. This confirms the assumption of the researcher that not many additional attention is given for managing data within practice, but rather tasks are just executed. In addition, firms assume that data management is not really important until it proves useful. Firms do not want to spend time in improving their data quality management processes, but in the long run this proves otherwise. Nonetheless, this does not mean that all firms are not giving any attention to data quality management. More and more firms are seeing the benefits of good data quality management. For instance, company H mentioned that they are gradually increasing the attention given to good data quality. Nowadays, more techniques and software are available to manage the data within the firm and more firms are starting to apply these so that mistakes within their data can be avoided.
Reasons for collecting data, could be for instance to provide input for management; create ‘monthly’ reports; aid in decision making and to track the business processes of the firm. If the users don’t collect the data, then most of the time the systems provide insights within specific software. However, in most cases the firms have to arrange these data and provide input for the different kinds of software. For example, company B was providing services to their customers and with this service the customers were using the databases of the firm. The company could arrange the data and their sources accordingly, because they eventually maintained it. The company mentioned “We collect our data from our own MYSQL-databases and make connections by performing queries.”. This is not always the case, when you provide services to your customers, then you can arrange the data correctly and present them with regards to your own standards. However, when you need to rearrange the customers’ data sources, then you can experience some difficulties, like mentioned by company E “We have difficulties in combining multiple information sources, because the data is different within every system. For example, within system A, credit numbers are saved as 103 etcetera, but within system B, these are noted as 103-1. This ensures problems in making comparisons and combining the data sources.”
added to their databases.”. Whereas, company A and company F note that firms are relying too much on manual work and do not put any effort in automatization. In addition, company F added
“Employees don’t take any action for making improvements, they just repeat their work over and over again, because they are accustomed to it.”. This shows that little initiative is taken by employees and maybe this could be one of the causes of poor data quality management.
When comparing the findings within practice to the theory, the conclusion can be made that these are in close connection with each other. The reason for this is that challenges of data quality match with practice, for example data integration with different systems is stated as a challenge of data quality by Cai & Zhu (2015) and this challenge repeats itself within practice. In addition, the problem that extra time is needed to reconcile data caused by poor data quality mentioned by Eckerson (2002) has also been noted by the respondents within the interviews. These show that the theory of data quality management and the reality within practice are in close connection to each other and maybe firms should start considering these theories. Next, the applicability of the maturity model and scorecard are discussed.
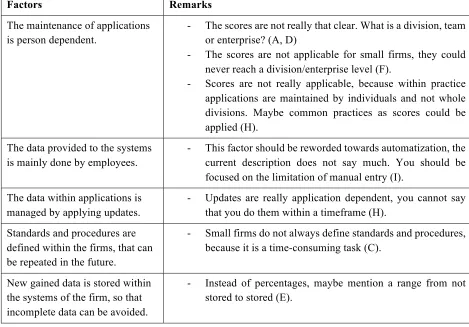
4.2.2 Applicability of maturity model within practice
The maturity model was presented to and discussed with each interviewee. These discussions ensured that valuable new information could be gathered in order to improve the maturity model of this research. Furthermore, the scorecard was applied to the firm of the interviewee which indicated the maturity level of the corresponding firm. With the application of the scorecard and discussion of the maturity model, points for improvements were mentioned, these are discussed in depth in this paragraph.
Firstly, it was mentioned if a similar model was used by the interviewees within their field of practice. Most of the interviewees mentioned that they did not use any similar maturity model, at least not with regards to data quality management. However, one interviewee told that he has used a similar model and also was included within the development of this model. The model was called the Prince2 Maturity Model, where a set of requirements were defined within. The performance of the firm was defined by the extent of which the firms followed these. This model was created digitally, and provided immediate feedback on the level of maturity.